

A multi-parent recombinant inbred line population of C. elegans allows identification of novel QTLs for complex life history traits
- PMID: 30866929
- PMCID: PMC6417139
- DOI: 10.1186/s12915-019-0642-8
A multi-parent recombinant inbred line population of C. elegans allows identification of novel QTLs for complex life history traits
Abstract
Background: The nematode Caenorhabditis elegans has been extensively used to explore the relationships between complex traits, genotypes, and environments. Complex traits can vary across different genotypes of a species, and the genetic regulators of trait variation can be mapped on the genome using quantitative trait locus (QTL) analysis of recombinant inbred lines (RILs) derived from genetically and phenotypically divergent parents. Most RILs have been derived from crossing two parents from globally distant locations. However, the genetic diversity between local C. elegans populations can be as diverse as between global populations and could thus provide means of identifying genetic variation associated with complex traits relevant on a broader scale.
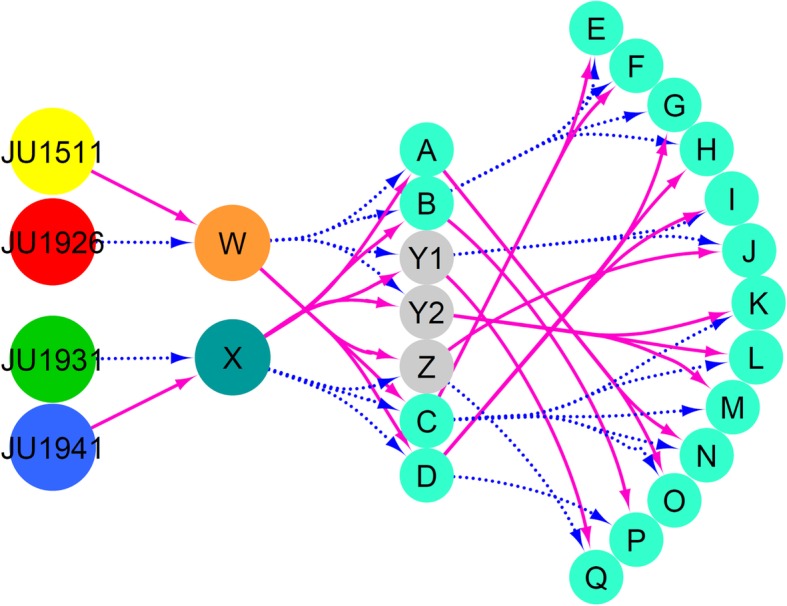
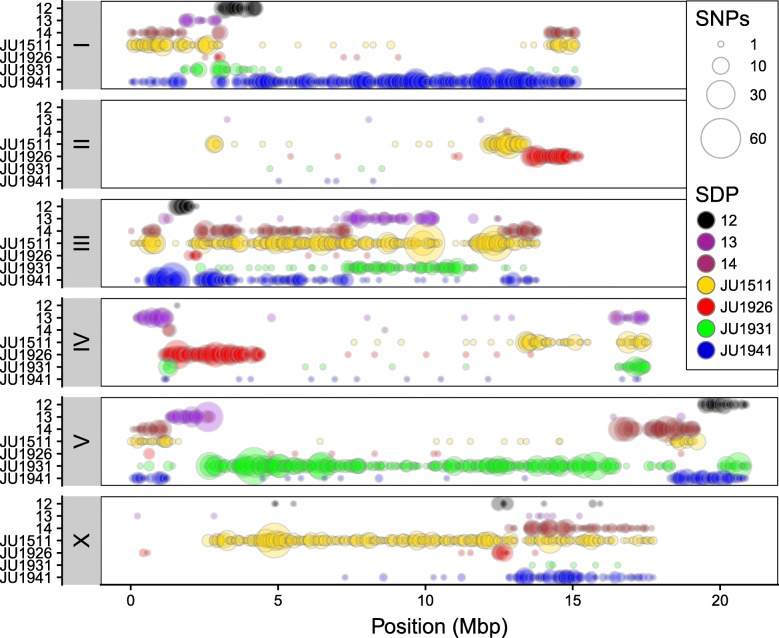
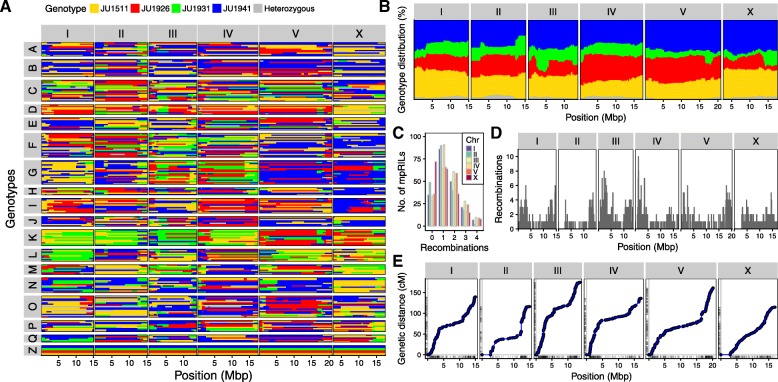
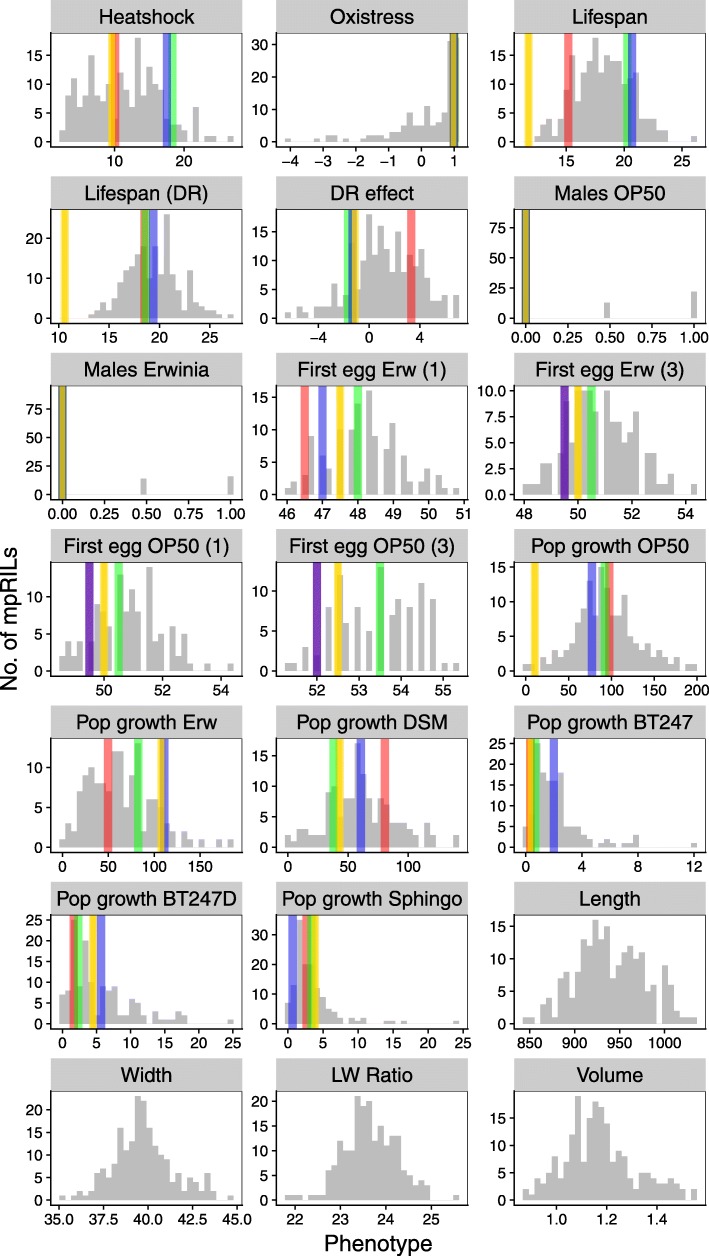
Results: To investigate the effect of local genetic variation on heritable traits, we developed a new RIL population derived from 4 parental wild isolates collected from 2 closely located sites in France: Orsay and Santeuil. We crossed these 4 genetically diverse parental isolates to generate a population of 200 multi-parental RILs and used RNA-seq to obtain sequence polymorphisms identifying almost 9000 SNPs variable between the 4 genotypes with an average spacing of 11 kb, doubling the mapping resolution relative to currently available RIL panels for many loci. The SNPs were used to construct a genetic map to facilitate QTL analysis. We measured life history traits such as lifespan, stress resistance, developmental speed, and population growth in different environments, and found substantial variation for most traits. We detected multiple QTLs for most traits, including novel QTLs not found in previous QTL analysis, including those for lifespan and pathogen responses. This shows that recombining genetic variation across C. elegans populations that are in geographical close proximity provides ample variation for QTL mapping.
Conclusion: Taken together, we show that using more parents than the classical two parental genotypes to construct a RIL population facilitates the detection of QTLs and that the use of wild isolates facilitates the detection of QTLs. The use of multi-parent RIL populations can further enhance our understanding of local adaptation and life history trade-offs.
Keywords: C. elegans; Genetic map; Life-history; Multi-parent RILs; Natural variation; QTL.
Conflict of interest statement
Ethics approval and consent to participate
Not applicable
Competing interests
The authors declare that they have no competing interests. The funders had no role in study design, data collection and analysis, decision to publish, or preparation of the manuscript.
Publisher’s Note
Springer Nature remains neutral with regard to jurisdictional claims in published maps and institutional affiliations.
Figures
Similar articles
-
The genetics of gene expression in a Caenorhabditis elegans multiparental recombinant inbred line population.G3 (Bethesda). 2021 Sep 27;11(10):jkab258. doi: 10.1093/g3journal/jkab258. G3 (Bethesda). 2021. PMID: 34568931 Free PMC article.
-
Validation of QTL mapping and transcriptome profiling for identification of candidate genes associated with nitrogen stress tolerance in sorghum.BMC Plant Biol. 2017 Jul 11;17(1):123. doi: 10.1186/s12870-017-1064-9. BMC Plant Biol. 2017. PMID: 28697783 Free PMC article.
-
Construction of a high-density genetic map based on large-scale markers developed by specific length amplified fragment sequencing (SLAF-seq) and its application to QTL analysis for isoflavone content in Glycine max.BMC Genomics. 2014 Dec 10;15(1):1086. doi: 10.1186/1471-2164-15-1086. BMC Genomics. 2014. PMID: 25494922 Free PMC article.
-
Natural genetic variation as a tool for discovery in Caenorhabditis nematodes.Genetics. 2022 Jan 4;220(1):iyab156. doi: 10.1093/genetics/iyab156. Genetics. 2022. PMID: 35134197 Free PMC article. Review.
-
The nature of quantitative genetic variation for Drosophila longevity.Mech Ageing Dev. 2002 Jan;123(2-3):95-104. doi: 10.1016/s0047-6374(01)00330-x. Mech Ageing Dev. 2002. PMID: 11718804 Review.
Cited by
-
The genetic architecture underlying body-size traits plasticity over different temperatures and developmental stages in Caenorhabditis elegans.Heredity (Edinb). 2022 May;128(5):313-324. doi: 10.1038/s41437-022-00528-y. Epub 2022 Apr 5. Heredity (Edinb). 2022. PMID: 35383317 Free PMC article.
-
Conservative evolution of genetic and genomic features in Caenorhabditis becei, an experimentally tractable gonochoristic worm.bioRxiv [Preprint]. 2025 May 15:2025.05.09.653148. doi: 10.1101/2025.05.09.653148. bioRxiv. 2025. PMID: 40463230 Free PMC article. Preprint.
-
The genetics of gene expression in a Caenorhabditis elegans multiparental recombinant inbred line population.G3 (Bethesda). 2021 Sep 27;11(10):jkab258. doi: 10.1093/g3journal/jkab258. G3 (Bethesda). 2021. PMID: 34568931 Free PMC article.
-
Analysis of lifespan across diversity outbred mouse studies identifies multiple longevity-associated loci.Genetics. 2025 Aug 6;230(4):iyaf081. doi: 10.1093/genetics/iyaf081. Genetics. 2025. PMID: 40326784 Free PMC article.
-
Plasticity of maternal environment-dependent expression-QTLs of tomato seeds.Theor Appl Genet. 2023 Feb 22;136(2):28. doi: 10.1007/s00122-023-04322-0. Theor Appl Genet. 2023. PMID: 36810666 Free PMC article.
References
-
- Petersen C, Dirksen P, Schulenburg H. Why we need more ecology for genetic models such as C. elegans. Trends Genet. 2015;31(3):120–127. - PubMed
-
- Lynch M, Conery JS. The origins of genome complexity. Science. 2003;302(5649):1401–1404. - PubMed
-
- Mackay TF, Stone EA, Ayroles JF. The genetics of quantitative traits: challenges and prospects. Nat Rev Genet. 2009;10(8):565–577. - PubMed
Publication types
MeSH terms
LinkOut - more resources
Full Text Sources
