. 2019 Mar 12;7(1):68.
doi: 10.1186/s40425-019-0556-6.

Collagen density regulates the activity of tumor-infiltrating T cells

Affiliations

Collagen density regulates the activity of tumor-infiltrating T cells

Dorota E Kuczek et al. J Immunother Cancer. .

Abstract

Background: Tumor progression is accompanied by dramatic remodeling of the surrounding extracellular matrix leading to the formation of a tumor-specific ECM, which is often more collagen-rich and of increased stiffness. The altered ECM of the tumor supports cancer growth and metastasis, but it is unknown if this effect involves modulation of T cell activity. To investigate if a high-density tumor-specific ECM could influence the ability of T cells to kill cancer cells, we here studied how T cells respond to 3D culture in different collagen densities.

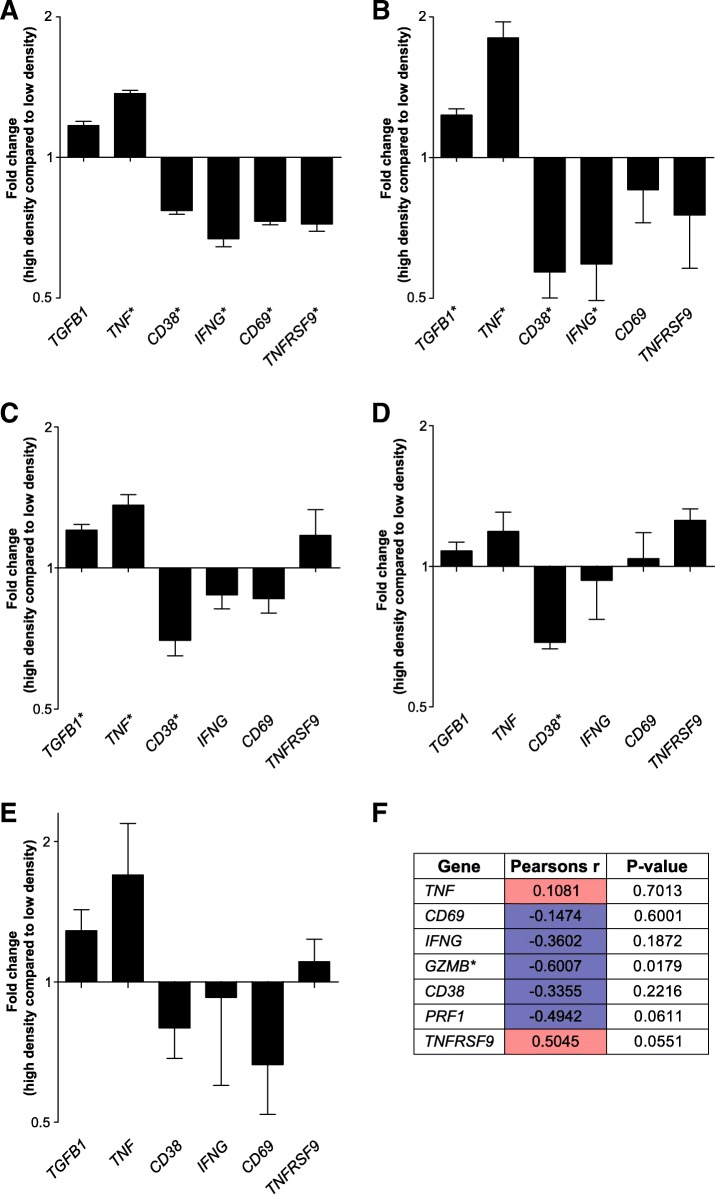
Methods: T cells cultured in 3D conditions surrounded by a high or low collagen density were imaged using confocal fluorescent microscopy. The effects of the different collagen densities on T cell proliferation, survival, and differentiation were examined using flow cytometry. Cancer cell proliferation in similar 3D conditions was also measured. Triple-negative breast cancer specimens were analyzed for the number of infiltrating CD8+ T cells and for the collagen density. Whole-transcriptome analyses were applied to investigate in detail the effects of collagen density on T cells. Computational analyses were used to identify transcription factors involved in the collagen density-induced gene regulation. Observed changes were confirmed by qRT-PCR analysis.

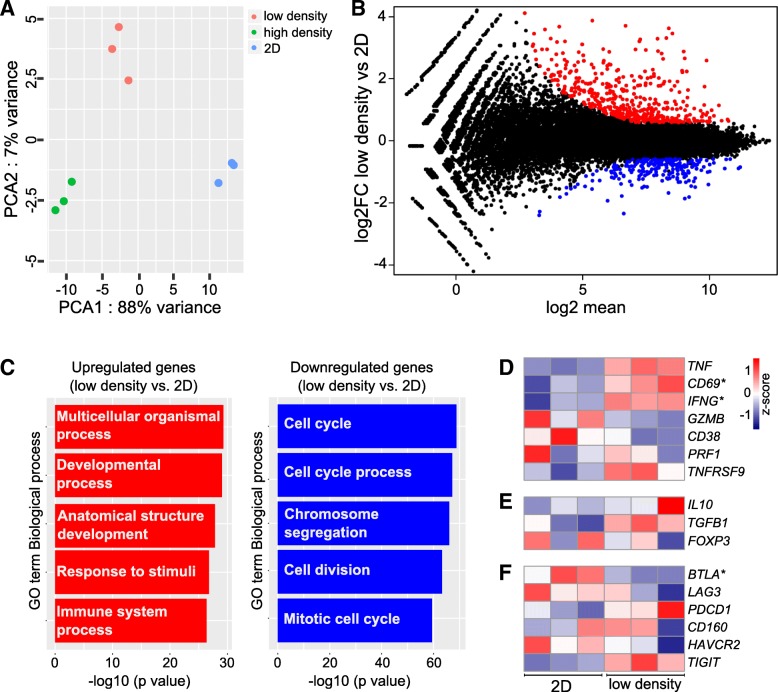
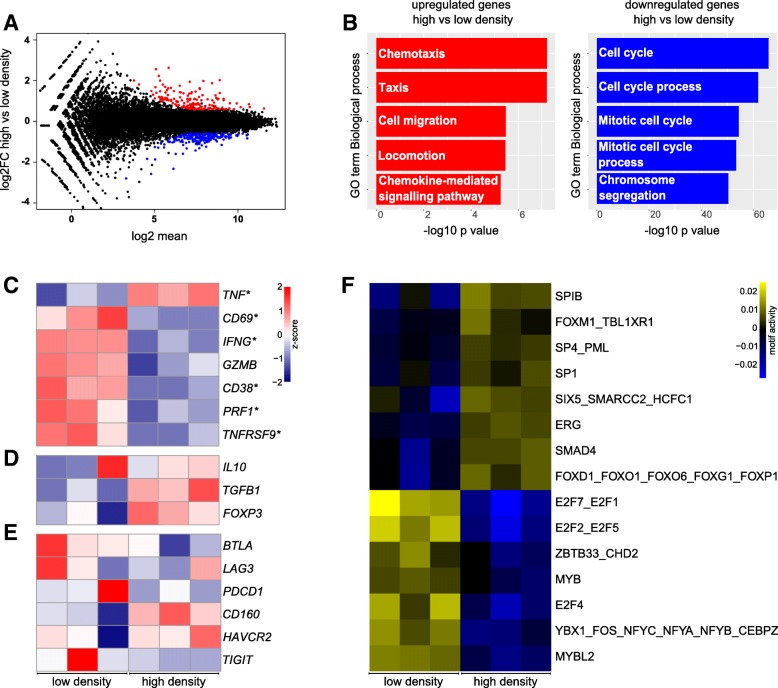
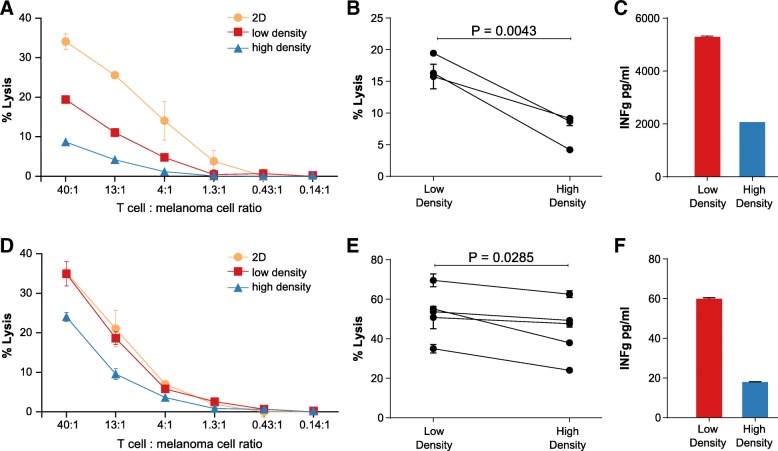
Results: T cell proliferation was significantly reduced in a high-density matrix compared to a low-density matrix and prolonged culture in a high-density matrix led to a higher ratio of CD4+ to CD8+ T cells. The proliferation of cancer cells was unaffected by the surrounding collagen-density. Consistently, we observed a reduction in the number of infiltrating CD8+ T-cells in mammary tumors with high collagen-density indicating that collagen-density has a role in regulating T cell abundance in human breast cancer. Whole-transcriptome analysis of 3D-cultured T cells revealed that a high-density matrix induces downregulation of cytotoxic activity markers and upregulation of regulatory T cell markers. These transcriptional changes were predicted to involve autocrine TGF-β signaling and they were accompanied by an impaired ability of tumor-infiltrating T cells to kill autologous cancer cells.

Conclusions: Our study identifies a new immune modulatory mechanism, which could be essential for suppression of T cell activity in the tumor microenvironment.

Keywords: 3D culture; Extracellular matrix; Immune modulation; T cell activity; Tumor microenvironment.


Conflict of interest statement

Ethics approval and consent to participate

Healthy donor PBLs were obtained from buffy coats available from the central blood bank of the capital region of Copenhagen and informed consent was obtained from all donors. Breast cancer samples were anonymized and used upon approval by the Scientific Ethics Committee for The Capital Region of Denmark.

Consent for publication

Not applicable.

Competing interests

The authors declare that they have no competing interests.

Publisher’s Note

Springer Nature remains neutral with regard to jurisdictional claims in published maps and institutional affiliations.

Figures

Fig. 1
Fig. 1
3D culture in high collagen density impairs T cell proliferation. a Schematic model of the 3D culture system. b T cells were cultured for 5 days in the indicated conditions, and subsequently viability was analyzed by flow cytometry. Each dot in the graph represents an individual donor. Error bars indicate standard error of the mean (SEM). c-e T cells cultured in a collagen matrix of low density (1 mg/ml, c-d) or high density (4 mg/ml, E) including fluorescently labeled collagen were imaged by confocal microscopy. c 3D projection of collagen matrix with embedded T cells. d-e Representative images of individual T cells within a low- density collagen matrix (d) or high-density collagen matrix (e). Size bars: (c-e) 10 μm. f-g T cell proliferation after 5 days in culture was measured by flow cytometry-based analysis of CellTrace Violet (CTV) dilution. f Representative histogram showing CTV dilution in T cells cultured in 2D or in 3D in a low-density collagen matrix or high-density collagen matrix. g Quantification of T cell proliferation based on CTV dilution. Three individual donors were analyzed. Connecting lines indicate measurements of the same donor. h T cells were cultured in collagen gels of high and low density and their proliferation was measured using a BrdU-based flow cytometry assay. The percentage of CD3-positive BrdU-positive cells is shown. i The breast cancer cell lines EO771.LMB, MDA-MB-231, and 4 T1 were cultured in collagen matrices of low or high density for 5 days and analyzed using a BrdU-based flow cytometry assay. The percentage of BrdU-positive cells is depicted. j-k The ratio of CD4+ to CD8+ cells was analyzed by flow cytometry after culture for 2 days (i) or 5 days (j). g-k Error bars indicate standard deviations of technical replicates
Fig. 2
Fig. 2
Breast cancer samples of high collagen density have fewer infiltrating T cells. a-d Histological sections of triple-negative breast cancers were picrosirius red (PSR)-stained for visualization of fibrillar collagen (a and c, red color) or immunostained for CD8 for visualization of cytotoxic T cells (B and D, brown color). a-b Example of a specimen containing low levels of collagen (a) and high abundance of tumor-infiltrating T cells (b). c-d Example of a specimen containing high levels of collagen (c) and low abundance of tumor-infiltrating T cells (d). Size bar: (a and c) 1 mm; (b and d) 100 μm. e Using Visiopharm-assisted automated image analysis, 20 triple-negative breast cancer sections were analyzed for the PSR-positive area and the number of tumor-infiltrating CD8+ T cells. Each dot in the graph represents an individual cancer sample. Pearson correlation r = 0.37, P = 0.11. f Areas of high and low collagen density were defined and the number of CD8+ T cells in these areas was assessed
Fig. 3
Fig. 3
Distinct transcriptomic signatures in 2D culture and in 3D culture in different collagen densities. a Principal component analysis of each RNAseq replicate of T cells cultured on plastic (2D) or in 1 mg/ml (low density) or 4 mg/ml (high density) collagen matrices for 2 days. b MA plot illustrating the differentially regulated genes (FDR < 0.01 and fold change > +/− 1.5) between cells cultured in a low-density collagen matrix or in regular 2D culture. Genes that are upregulated in low-density collagen compared to 2D are shown in red and downregulated genes are shown in blue. c Gene ontology analysis illustrates biological processes most significantly enriched within genes that are upregulated (left panel, red bars) or downregulated (right panel, blue bars) in low density collagen compared to 2D. d-f Heatmaps of normalized (Z-score) RNAseq read counts of genes encoding markers of T cell activity (d), Tregs (e), or T cell exhaustion (f). d-f Asterisks indicate significantly regulated genes
Fig. 4
Fig. 4
A high-density matrix induces a transcriptomic program indicative of reduced proliferation and cytotoxic activity. a MA plot illustrating the differentially regulated genes (FDR < 0.01 and fold change > +/− 1.5) between cells cultured in a high-density collagen matrix or a low-density collagen matrix for 2 days. Genes that are upregulated in high-density collagen compared to low-density are shown in red and downregulated genes are shown in blue. b Gene ontology analysis illustrates biological processes most significantly enriched within genes that are upregulated (left panel, red bars) or downregulated (right panel, blue bars) in high density compared to low density. c-e Heatmaps of normalized (Z-score) RNAseq read counts of genes encoding markers of T cell activity (c), Tregs (d), or T cell exhaustion (e). d-e Asterisks indicate significantly regulated genes. f Heatmap of most significantly up- or downregulated TF motifs in high-density vs. low-density collagen
Fig. 5
Fig. 5
T cells from different donors respond similarly to the surrounding collagen density. a Bar graph of normalized (Z-score) RNAseq read counts of a selected panel of differentially regulated genes. b-e Bar graphs of qRT-PCR analyses of the same panel of genes as in (a) in 3–4 different donors. Cultured cells were either PBMCs enriched for T cells (b), purified T cells (c), purified CD8+ cells (d) or TCR transduced T cells (e) cultured for 2 days in a high-density collagen matrix or a low-density collagen matrix. f Table of correlation analyses between COL1A1 gene and the same panel of genes as in (a) from a single-cell RNA sequencing dataset available in the Gene Expression Omnibus (GSE103322) (a-f) Asterisks indicate significantly regulated genes
Fig. 6
Fig. 6
Tumor-infiltrating T cells display reduced cytotoxicity after culture in a high-density collagen matrix. Tumor-infiltrating T cells from melanoma MM33 were cultured for 3 days on plastic (2D) or in collagen matrices of high- or low density, after which the cells were assayed for their ability to lyze autologous MM3 melanoma cells using a 51Cr-release assay. T cells were transiently PMA/ionomycin stimulated before the culture period (a-c) or cultured without any stimulus (d-f). (a and d) Representative example of MM33 melanoma cell lysis after 4 h incubation with different numbers of T cells, which had been transiently PMA/ionomycin stimulated (a) or directly embedded in collagen (d) and pre-cultured as indicated. b Percentage of melanoma cell lysis at the highest T cell: melanoma cell ratio in 3 different experiments. The T cells had been transiently PMA/ionomycin stimulated and cultured for 3 days in a low-density or high-density collagen matrix before extraction and incubation with 51Cr-labeled MM33 melanoma cells. c and f IFNγ levels in conditioned media of MM33 T cells, which had been transiently PMA/ionomycin stimulated (c) or directly embedded in collagen (f) and cultured for 3 days in a low-density or high-density collagen matrix. e Percentage of melanoma cell lysis at the highest T cell: melanoma cell ratio in 5 different experiments. The T cells had been cultured for 3 days in a low-density or high-density collagen matrix before extraction and incubation with 51Cr-labeled MM33 melanoma cells

References

    1. Fridman WH, Zitvogel L, Sautès–Fridman C, Kroemer G. The immune contexture in cancer prognosis and treatment. Nat Rev Clin Oncol. 2017;14:717–734. doi: 10.1038/nrclinonc.2017.101. - DOI - PubMed
    1. Tumeh PC, Harview CL, Yearley JH, Shintaku IP, Taylor EJM, Robert L, et al. PD-1 blockade induces responses by inhibiting adaptive immune resistance. Nature. 2014;515:568–571. doi: 10.1038/nature13954. - DOI - PMC - PubMed
    1. Dunn GP, Bruce AT, Ikeda H, Old LJ, Schreiber RD. Cancer immunoediting: from immuno-surveillance to tumor escape. Nat Immunol. 2002;3:991–998. doi: 10.1038/ni1102-991. - DOI - PubMed
    1. Munn DH, Bronte V. Immune suppressive mechanisms in the tumor microenvironment. Curr Opin Immunol. 2016;39:1–6. doi: 10.1016/j.coi.2015.10.009. - DOI - PMC - PubMed
    1. Joyce JA, Fearon DT. T cell exclusion, immune privilege, and the tumor microenvironment. Science. 2015;348:74–80. doi: 10.1126/science.aaa6204. - DOI - PubMed

Publication types

MeSH terms