. 2019 May 10;294(19):7573-7587.
doi: 10.1074/jbc.RA118.005209. Epub 2019 Mar 13.

The hepatitis C virus RNA-dependent RNA polymerase directs incoming nucleotides to its active site through magnesium-dependent dynamics within its F motif

Affiliations

The hepatitis C virus RNA-dependent RNA polymerase directs incoming nucleotides to its active site through magnesium-dependent dynamics within its F motif

Kaouther Ben Ouirane et al. J Biol Chem. .

Abstract

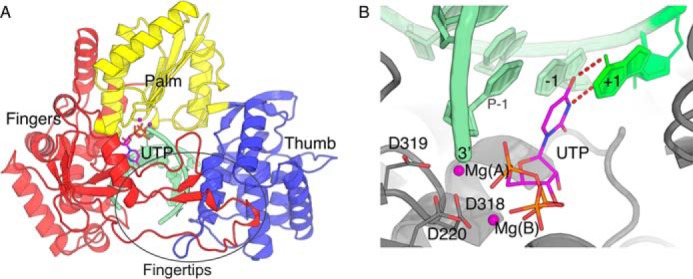
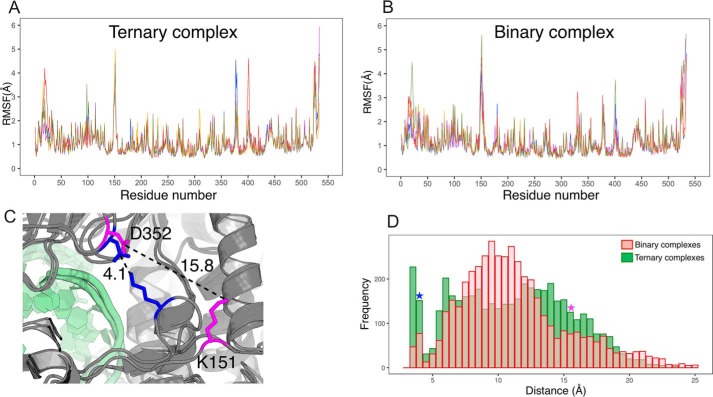
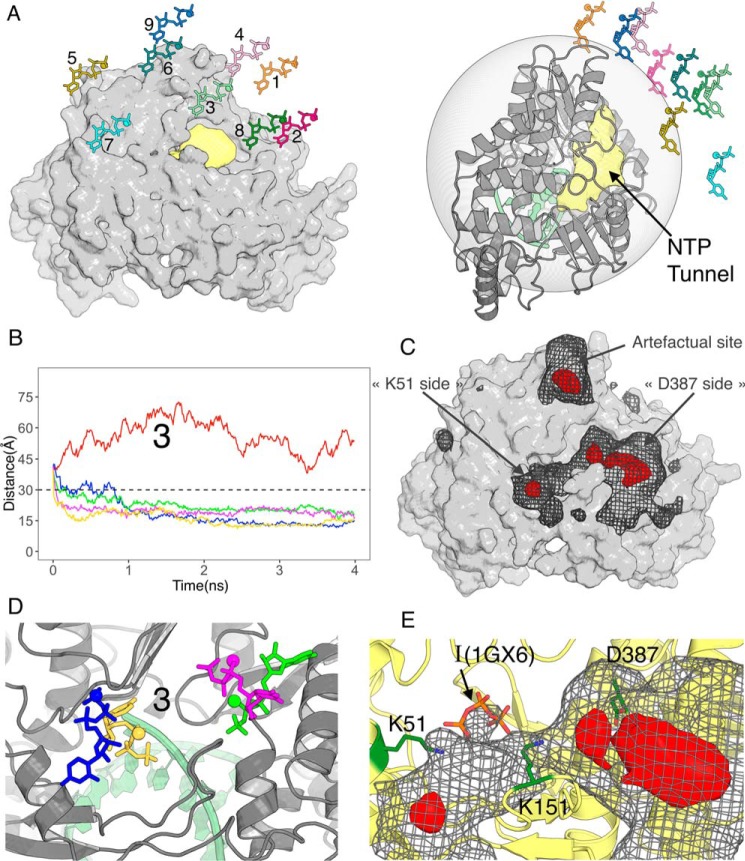
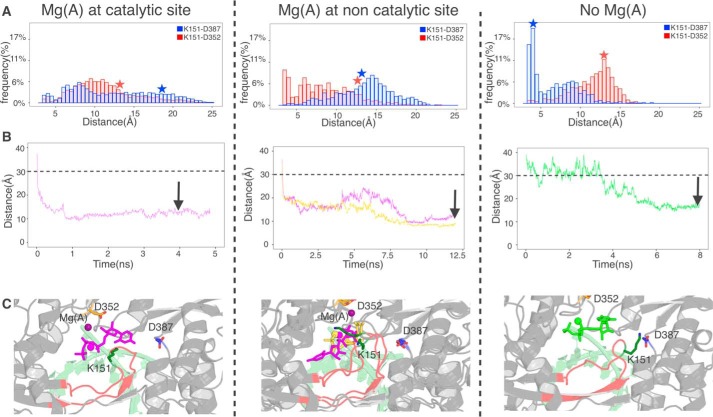
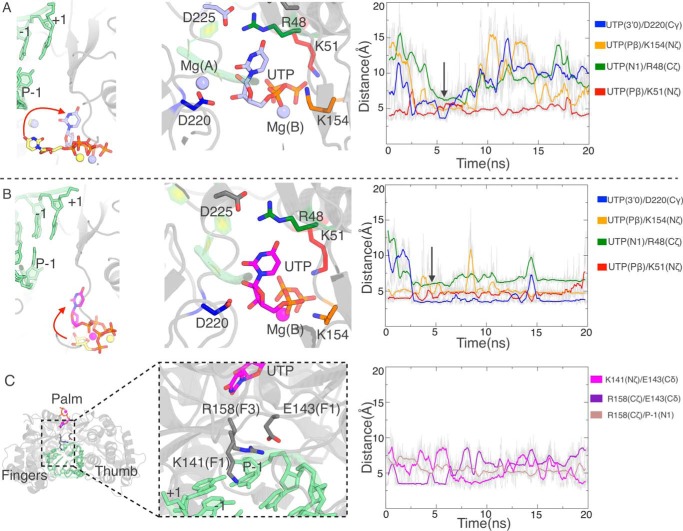
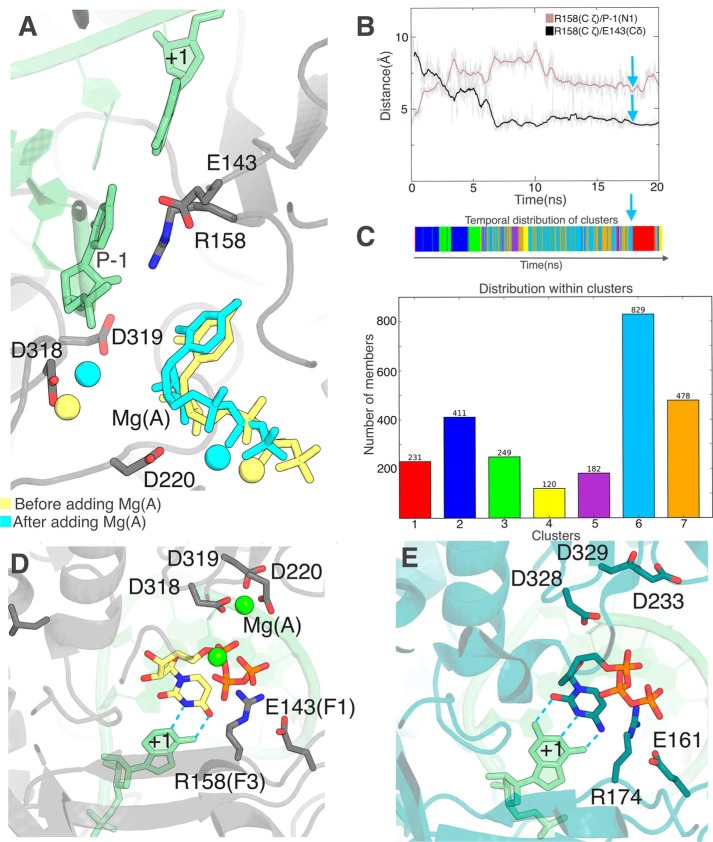
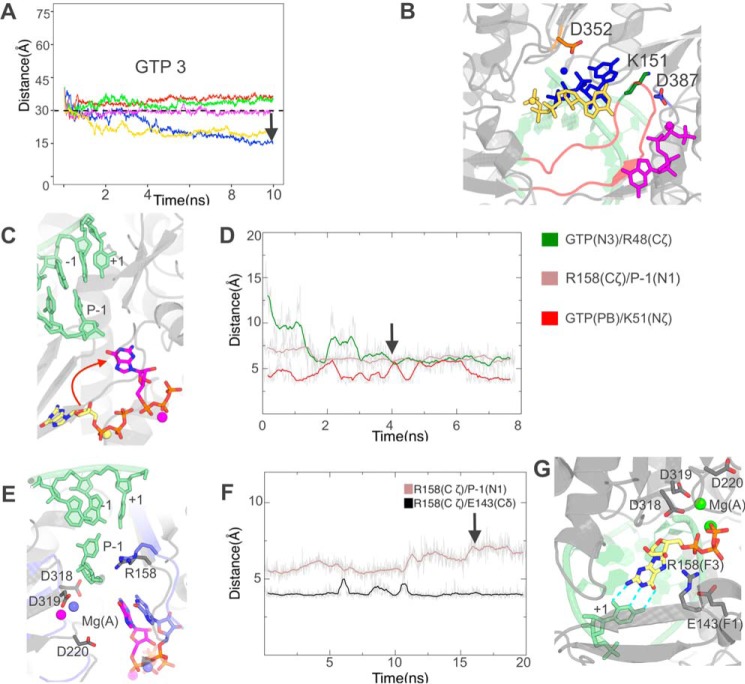
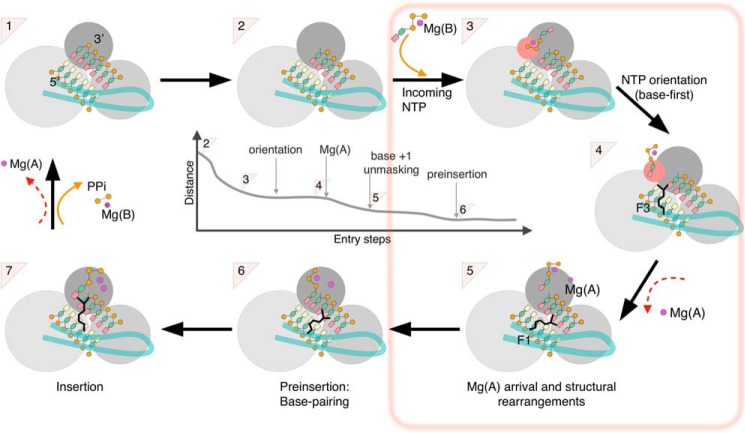
RNA viruses synthesize new genomes in the infected host thanks to dedicated, virally-encoded RNA-dependent RNA polymerases (RdRps). As such, these enzymes are prime targets for antiviral therapy, as has recently been demonstrated for hepatitis C virus (HCV). However, peculiarities in the architecture and dynamics of RdRps raise fundamental questions about access to their active site during RNA polymerization. Here, we used molecular modeling and molecular dynamics simulations, starting from the available crystal structures of HCV NS5B in ternary complex with template-primer duplexes and nucleotides, to address the question of ribonucleotide entry into the active site of viral RdRp. Tracing the possible passage of incoming UTP or GTP through the RdRp-specific entry tunnel, we found two successive checkpoints that regulate nucleotide traffic to the active site. We observed that a magnesium-bound nucleotide first binds next to the tunnel entry, and interactions with the triphosphate moiety orient it such that its base moiety enters first. Dynamics of RdRp motifs F1 + F3 then allow the nucleotide to interrogate the RNA template base prior to nucleotide insertion into the active site. These dynamics are finely regulated by a second magnesium dication, thus coordinating the entry of a magnesium-bound nucleotide with shuttling of the second magnesium necessary for the two-metal ion catalysis. The findings of our work suggest that at least some of these features are general to viral RdRps and provide further details on the original nucleotide selection mechanism operating in RdRps of RNA viruses.

Keywords: RNA virus; RNA-dependent RNA polymerase (RdRp); Single-stranded, positive-sense RNA virus; molecular dynamics; nucleoside/nucleotide transport; protein motif; structural biology; viral polymerase.


Conflict of interest statement

The authors declare that they have no conflicts of interest with the contents of this article

Figures

Figure 1.
Figure 1.
HCV NS5B ternary complex. UTP ternary complex derived from PDB 4WTA by adding the γ-phosphate and substituting the two Mn2+ ions of the crystal structure with two Mg2+, Mg(A) and Mg(B) (in deep purple). The primer/template RNA is in pale green. A, overall view with domains fingers, palm, and thumb colored red, yellow, and blue, respectively. The two loops extending from the fingers (Fingertips) are indicated. B, close up of the active site showing Watson-Crick base pairing of UTP with the +1 template base and coordination of Mg(A) and Mg(B) by aspartates 220 (motif A) and 318–319 (motif C) and the primer's 3′-end on one side, and the UTP triphosphate moiety on the other side.
Figure 2.
Figure 2.
Molecular dynamics simulations of HCV NS5B ternary and binary complexes. A and B, RMSF along the NS5B sequence for five replicas of 100-ns simulations of NS5B ternary complex (A) and binary complex where UTP and Mg(B) were removed (B). The last 90 ns of the simulations were considered. C, two snapshots of alternate conformations of the entry loop taken from simulations of binary complexes. Lys151 in the loop is displayed, as well as Asp352 on the other side of the NTP tunnel with which Lys151 makes a salt bridge in the closed entry loop conformation (residues in blue), whereas the two side chains are far away in open conformations (residues in magenta). D, distributions of the distance between Lys151 Nζ and Asp352 Cγ in binary complex simulations (transparent red histogram) and ternary complex simulations (green histogram). The blue and magenta stars signal the value for the closed and open entry loop conformations, respectively.
Figure 3.
Figure 3.
Molecular dynamics simulations with distance restraints on UTP. NS5B is in the same orientation in panels A, left, and C–E. A, nine initial positions for UTP (together with Mg(B)) 40 Å from NS5B's active site on the side of the NTP tunnel (in pale yellow). The semitransparent gray sphere on the right panel signals the 30 Å distance from the active site under which no extra energy term is added. B, UTP distances from the active site during five 4-ns simulations starting from position 3 and with five energy constants of 0 (no bias, red curve), 0.02 (blue), 0.05 (green), 0.1 (magenta), and 0.5 (yellow) Kcal/mol/Å2. C, UTP density when considering the 45 4-ns simulations (nine initial positions times five energy constants) simultaneously, contoured at two levels to highlight regions of nucleotide binding (gray mesh) and more localized binding sites (red volumes). D, the four stable positions reached by UTP from initial position 3, colored according to the energy constant applied beyond 30 Å. E, close up of the density at the NTP tunnel entry also showing the locations of Lys51, Lys151, and Asp387. I(1GX6) is the triphosphate for the UTP at the “I” site reported previously (27).
Figure 4.
Figure 4.
Simulations for alternate hypotheses as to Mg(A) prior to UTP approach at the catalytic site (left), at the noncatalytic site (middle), and not present (right). A, simulations of binary complexes under the three hypotheses. Displayed are distance distributions between Lys151 Nζ and Asp352 Cγ (red histograms) and Lys151 Nζ and Asp387 Cγ (blue histograms). Red and blue stars denote the single conformation that was used in each case for downstream distance-restrained MD. B, selected simulations from the initial position 3 with distance restraints between the centers of masses of UTP and Asp319, chosen this time for location of the active site. The color code for the curves is as described in the legend to Fig. 2B and the distance of 30 Å below, which no extra energy term is added is indicated. Arrows denote the snapshots from which further simulations were performed (see Fig. 5). C, stable positions reached by UTP in the indicated snapshots.
Figure 5.
Figure 5.
Accelerated molecular dynamics simulations show spontaneous UTP orientation at the NTP tunnel entry. A, in the case of Mg(A) at the catalytic site. B and C, in the case of no Mg(A) in the system. A and B, left panels, positions of UTP at the different starts of the two accelerated simulations and at the (transiently) stable same position (shown by the arrow in the right panels). Middle panels, details of key residues lining the UTP triphosphate, ribose, and base. Right panels, evolution of relevant distances between those residues and UTP during the simulations. C, concerted shift in motifs F3 and F1 following UTP orientation. The distances in the right panel record the closing of Arg158 with the P-1 base and the switch in salt bridges from Arg158–Glu143 to Glu143–Lys14.
Figure 6.
Figure 6.
Addition of Mg(A) at the noncatalytic site triggers a displacement of motif F3 unmasking the +1 base. A–C, unbiased simulation after Mg(A) addition. A, initial UTP and Mg(A) positions (yellow) superimposed on the snapshot (cyan) defined by cyan arrows in B and C. The P-1 primer base on which the incoming nucleotide is to stack and the +1 adenine with which it is to bp are labeled. B, evolution of the same Arg158 distances as in Fig. 5C show a reversal of Arg158 interaction with base P-1 as the salt bridge with Glu143 is re-established. C, clustering of the Arg158 conformation along the trajectory with a timeline (top) and a distribution of clusters (bottom). The representative snapshot from the major cluster 6 used for A is indicated by the cyan arrow. D, after targeted molecular dynamics (see text for details), base-pairing with the template base (labeled “+1”) is readily established. E, the same view for the preinsertion complex crystal structure for the poliovirus RdRp obtained with a 2′,3′-ddCTP (PDB 3OLB) (17) is shown for comparison with D.
Figure 7.
Figure 7.
GTP entry with a cytosine as the +1 base occurs through successive steps similar to those as UTP entry with an adenosine as +1 base. A and B, molecular dynamics simulations with distance restraints between the centers of masses of Asp319 and GTP starting from position 3. A, evolution of GTP distances from Asp319 during five 10-ns simulations with five energy constants 0 (no bias, red curve), 0.02 (blue), 0.05 (green), 0.1 (magenta), and 0.5 (yellow) Kcal/mol/Å2. The distance of 30 Å below which no extra energy term is added is indicated. The black arrow denotes the snapshot that was selected for further simulations. B, the three stable positions closest to Asp319 reached by GTP from initial position 3, colored according to the energy constant applied beyond 30 Å. C and D, accelerated molecular dynamics simulations show spontaneous GTP orientation at the NTP tunnel entry. C, positions of GTP at the start of simulations (yellow carbons) and at a stable position reached in two of five replicas (magenta carbons). D, evolution of relevant distances between GTP and residues lining the NTP tunnel in one such simulation. The black arrow denotes the snapshot that was selected for further simulations. E and F, simulation after addition of Mg(A) at the noncatalytic site. E, initial GTP position (magenta carbons for GTP and Arg158) superimposed on the snapshot (purple carbons) defined by the arrow in F. F, evolution of the same Arg158 distances as in Fig. 6B also show a reversal of Arg158 interactions with base P-1 unmasking, this time with no change in the interaction with Glu143. The black arrow denotes the snapshot that was selected for further simulations. G, after targeted molecular dynamics simulations, GTP preinsertion is established.
Figure 8.
Figure 8.
Overall scheme of nucleotide entry in RdRp. The new findings of the present work (from step 2 to step 6) are boxed. Crystal structures are available for a number of (+)-ssRNA RdRp of supergroup I and for HCV NS5B (supergroup II) for steps 1 (product state/pre-translocation) and 7 (ternary complex). Crystal structures for step 4 (post-translocation) are available only for supergroup I RdRp, and for step 6 (preinsertion) only for two enteroviruses (supergroup I). The RdRp domains are represented as three gray spheres (dark, palm; middle gray, fingers; light gray, thumb) with the entry loop of the RdRp-specific fingertips in pale green. The dsRNA is represented with yellow bases for template and salmon bases for primer. The central panel depicts the general reduction of distance between the base of the incoming nucleotide and the +1 base from the first nucleotide capture (2 to 3) to preinsertion (5 to 6), where Watson-Crick base pairing is established. Note that the actual values in early stages differ in different simulations and only converge at orientation.

References

    1. Steitz T. A. (1998) A mechanism for all polymerases. Nature 391, 231–232 10.1038/34542 - DOI - PubMed
    1. Delarue M., Poch O., Tordo N., Moras D., and Argos P. (1990) An attempt to unify the structure of polymerases. Protein Eng. 3, 461–467 10.1093/protein/3.6.461 - DOI - PubMed
    1. Ago H., Adachi T., Yoshida A., Yamamoto M., Habuka N., Yatsunami K., and Miyano M. (1999) Crystal structure of the RNA-dependent RNA polymerase of hepatitis C virus. Structure 7, 1417–1426 10.1016/S0969-2126(00)80031-3 - DOI - PubMed
    1. Bressanelli S., Tomei L., Roussel A., Incitti I., Vitale R. L., Mathieu M., De Francesco R., and Rey F. A. (1999) Crystal structure of the RNA-dependent RNA polymerase of hepatitis C virus. Proc. Natl. Acad. Sci. U.S.A. 96, 13034–13039 10.1073/pnas.96.23.13034 - DOI - PMC - PubMed
    1. Lesburg C. A., Cable M. B., Ferrari E., Hong Z., Mannarino A. F., and Weber P. C. (1999) Crystal structure of the RNA-dependent RNA polymerase from hepatitis C virus reveals a fully encircled active site. Nat. Struct. Biol. 6, 937–943 10.1038/13305 - DOI - PubMed

Publication types

MeSH terms

Substances