. 2019 Apr 1;218(4):1390-1406.
doi: 10.1083/jcb.201807216. Epub 2019 Mar 13.

The Wave complex controls epidermal morphogenesis and proliferation by suppressing Wnt-Sox9 signaling

Affiliations

The Wave complex controls epidermal morphogenesis and proliferation by suppressing Wnt-Sox9 signaling

Jonathan Cohen et al. J Cell Biol. .

Abstract

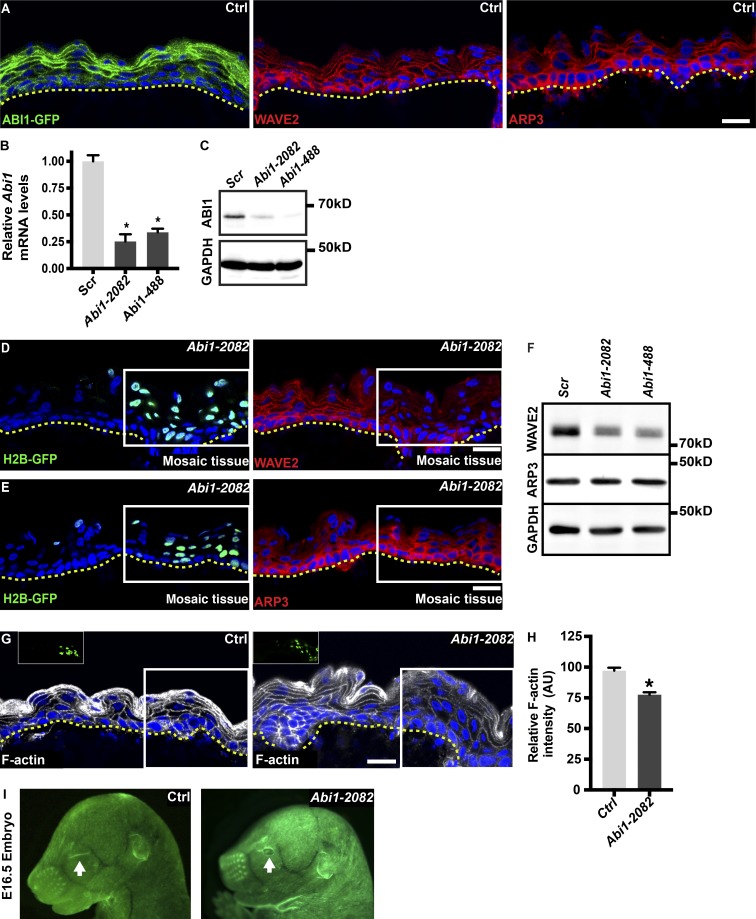
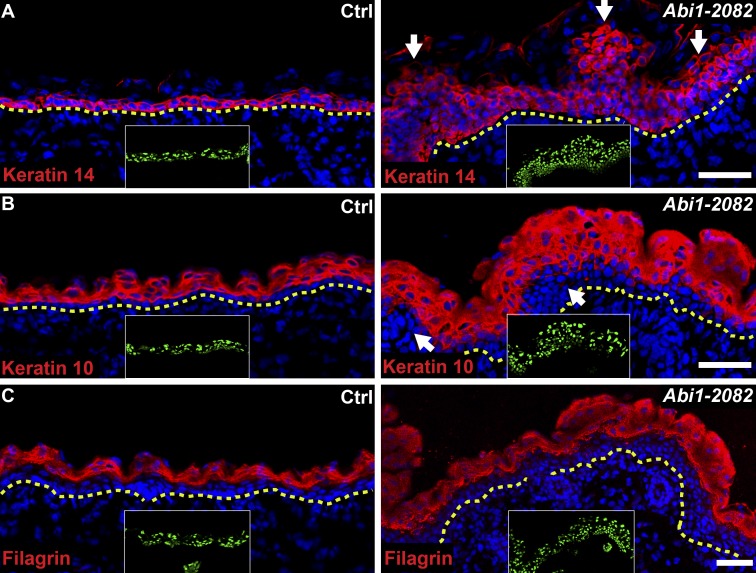
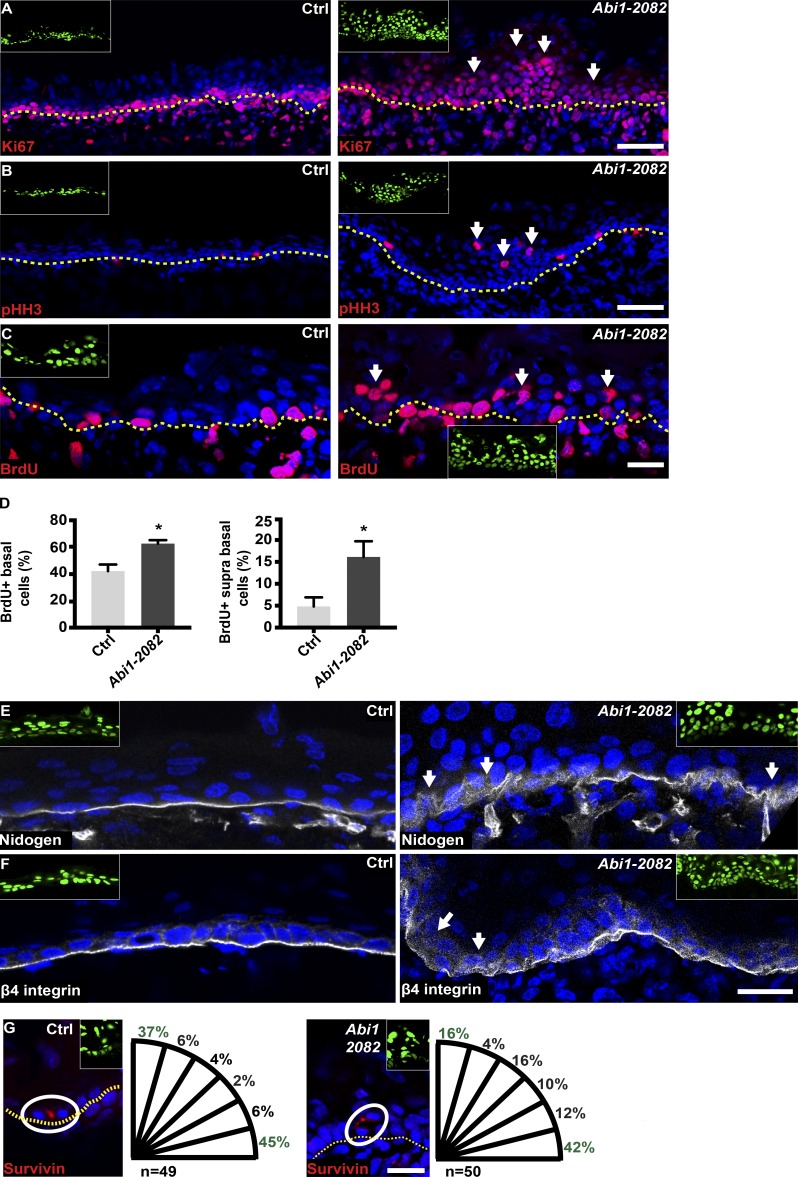
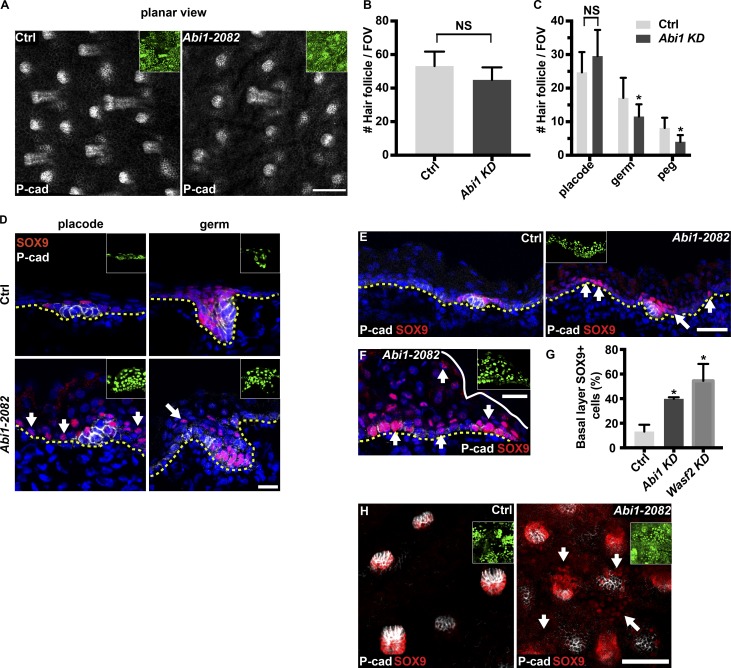
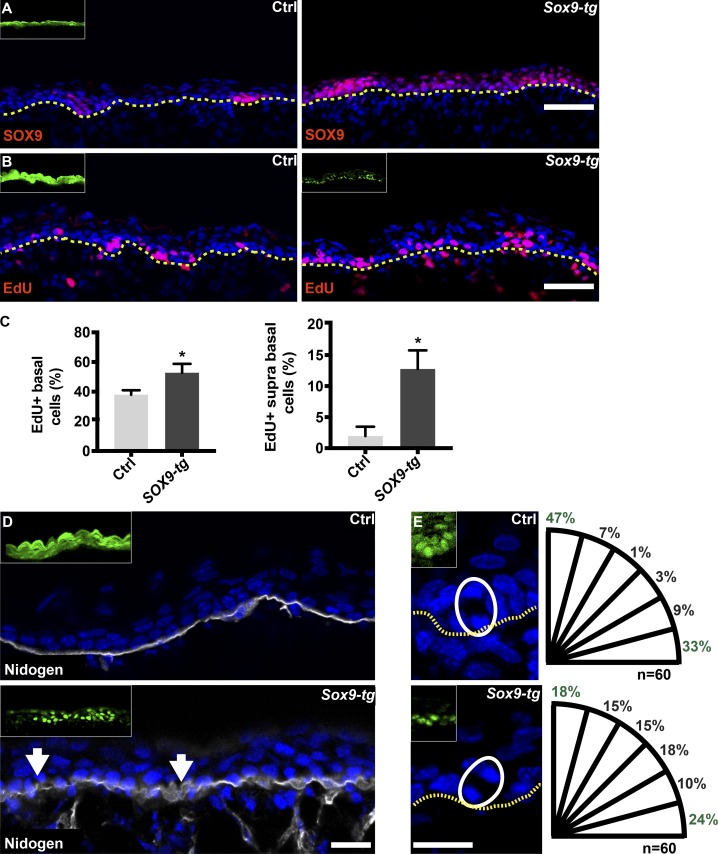
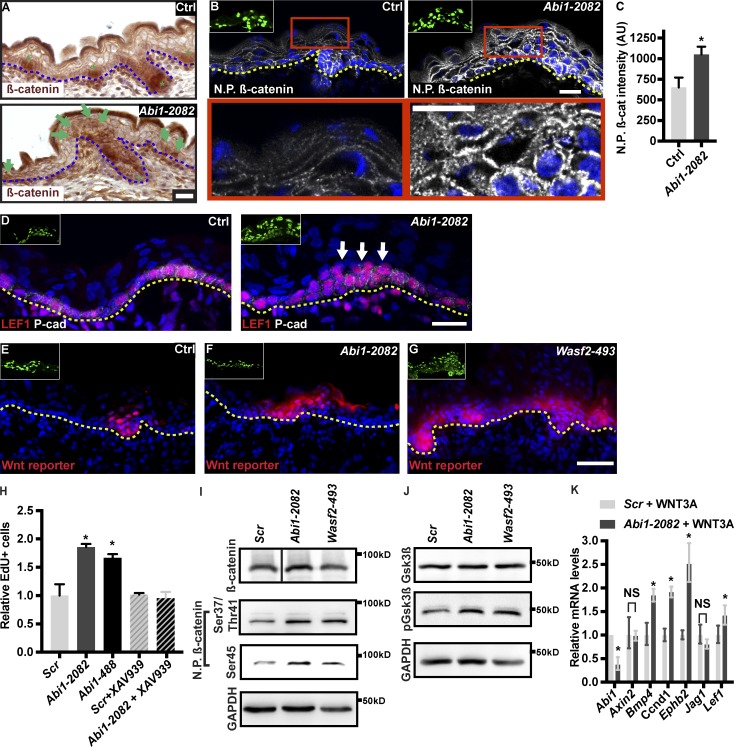
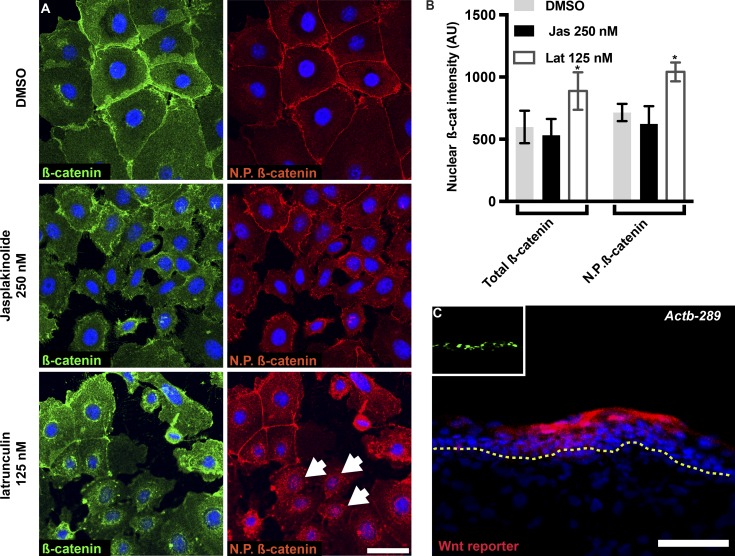
Development of the skin epidermis requires tight spatiotemporal control over the activity of several signaling pathways; however, the mechanisms that orchestrate these events remain poorly understood. Here, we identify a key role for the Wave complex proteins ABI1 and Wave2 in regulating signals that control epidermal shape and growth. In utero RNAi-mediated silencing of Abi1 or Wasf2 induced cellular hyperproliferation and defects in architecture of the interfollicular epidermis (IFE) and delayed hair follicle growth. Unexpectedly, SOX9, a hair follicle growth regulator, was aberrantly expressed throughout the IFE of the mutant embryos, and its forced overexpression mimicked the Wave complex loss-of-function phenotype. Moreover, Wnt signaling, which regulates SOX9+ cell specification, was up-regulated in Wave complex loss-of-function IFE. Importantly, we show that the Wave complex regulates filamentous actin content and that a decrease in actin levels is sufficient to elevate Wnt/β-catenin signaling. Our results identify a novel role for Wave complex- and actin-regulated signaling via Wnt and SOX9 in skin development.


Figures

Figure 1.
Figure 1.
Abi1 depletion in the developing epidermis affects the actin cytoskeleton. (A) Sagittal views of 10-µm sections of dorsal skin from E16.5 CD1 mouse embryos. Left: Embryos were injected on E9 with an ABI1-GFP-encoding lentivirus. Middle and right: Control embryos were immunostained for Wave2 (middle) or Arp3 (right). Nuclei were stained with DAPI (blue). Dotted lines indicate the dermal–epidermal border. Scale bars = 20 µm. (B) Quantitative PCR analysis of Abi1 mRNA in primary mouse keratinocytes transduced with scrambled (Scr) shRNA or one of two Abi1-specific shRNAs (2082 and 488). Data are the mean ± SD of four preparations. *, P = 10−4 (Scr vs. Abi1-2082); *, P = 10−4 (Scr vs. Abi1-488) by unpaired t test. (C) Western blot analysis of primary mouse keratinocytes transduced with Scr, Abi1-2082, or Abi1-488 shRNAs. Blots were probed with antibodies to ABI1 and GAPDH (loading control). (D and E) Sagittal views of 10-µm sections of dorsal skin from E16.5 CD1 embryos injected on E9 with an Abi1-2082;H2B-GFP lentivirus. Left panels show H2B-GFP fluorescence, and right panels show immunostaining for Wave2 (D) or Arp3 (E). White boxes indicate the location of transduced GFP+ cells in mosaic tissues. Nuclei were stained with DAPI. Dotted lines indicate the dermal–epidermal border. Scale bars = 20 µm. (F) Western blot analysis of primary mouse keratinocytes transduced with Scr, Abi1-2082, or Abi1-488 shRNAs. Blots were probed with antibodies to Wave2, Arp3, and GAPDH (loading control). (G) Sagittal views of 10-µm sections of dorsal skin from E16.5 CD1 embryos injected on E9 with shScr;H2B-GFP (control, Ctrl) or shAbi1-2082;H2B-GFP lentiviruses. Sections were stained with fluorescent phalloidin (white) to visualize F-actin. White boxes and insets indicate the location of transduced GFP+ cells in the mosaic tissue. Dotted lines indicate the dermal–epidermal border. Nuclei were stained with DAPI (blue). Scale bar = 20 µm. (H) Quantification of F-actin staining intensity shown in G. Bars represent the mean phalloidin intensity ratio between infected (GFP+) and uninfected (GFP) cells. Data are the mean ± SD from four control and four shAbi1 KD embryos. *, P = 10−4 by unpaired t test. (I) Stereomicroscopic images of E16.5 embryos infected on E9 with shScr;H2B-GFP (Ctrl) or shAbi1-2082;H2B-GFP lentiviruses. Arrow indicates an open eye.
Figure 2.
Figure 2.
Depletion of Abi1 induces basal layer expansion and disruption of the epidermal architecture. (A–C) Sagittal views of 10-µm sections of dorsal skin from control and shAbi1-2082 KD E16.5 embryos. Sections were immunostained for the basal layer marker keratin 14 (A), the spinous layer and differentiation marker keratin 10 (B), and the granular layer marker filaggrin (C). Nuclei were stained with DAPI. Arrows indicate abnormal epidermal organization, dotted lines indicate the dermal–epidermal border, and insets show the transduced cells (H2BGFP+). Scale bars = 50 µm.
Figure 3.
Figure 3.
Depletion of Abi1 induces hyperproliferation and defects in BM organization and spindle orientation. (A and B) Sagittal views of 10-µm sections of dorsal skin from control and Abi1-2082 KD E16.5 embryos. Sections were immunostained for the cell proliferation markers Ki67 (A) and pHH3 (B). (C) Embryos were treated as described for A and B and pulsed for 2 h with BrdU on E16.5. In A–C, arrows indicate suprabasal mitotic cells. (D) Quantification of BrdU+ cells in the basal and suprabasal sections of C. Data are the mean ± SD from four control and four shAbi1 KD embryos. *, P = 0.0082 (basal cells); *, P = 0.015 (suprabasal cells) by unpaired t test. (E and F) Dorsal skin sections from embryos treated as in A and B. Sections were immunostained for nidogen (E) or β4 integrin (F). Arrows denote abnormal organization of BM. (G) Dorsal skin sections from embryos treated as in A and B and immunostained for the cleavage furrow marker survivin. White circles indicate survivin-positive, late-mitotic cells. Quantification of spindle orientation is presented to the right of each image. In A–C and G, dotted lines indicate the dermal–epidermal border. In A–C and E–G, insets show the transduced cells (H2BGFP+). Nuclei were stained with DAPI (blue). Scale bars = 50 µm (A and B) and 20 µm (C and E–G).
Figure 4.
Figure 4.
Depletion of Abi1 affects hair follicle development and distribution of the hair-follicle transcription factor SOX9. (A) Whole-mount immunofluorescence of control and Abi1-2082 KD E16.5 embryo immunostained for the hair follicle marker P-cadherin. (B and C) Quantification of data shown in A. Data are the means ± SD from four embryos per condition. *, P = 5 × 10⁻³ (germs); *, P = 7 × 10⁻⁵ (pegs) for control versus Abi1-2082 KD cells by unpaired t test. (D–F) Sagittal views of 10-µm sections of dorsal skin from control and Abi1-2082 KD E16.5 embryos. Sections were immunostained for P-cadherin and SOX9. Arrows indicate abnormal distribution of SOX9. (G) Quantification of basal layer SOX9 staining shown in E and in sections from embryos injected in the same manner with shWasf2-493;H2B-GFP lentivirus. Data are the mean ± SD from four control, four Abi1, and three Wasf2 embryos. *, P = 0.0017 (Ctrl vs. Abi1-2082); *, P = 0.024 (Ctrl vs. Wasf2-493) by unpaired t test. (H) Whole-mount immunofluorescence of control and Abi1-2082 KD E16.5 embryos immunostained for SOX9. In the images, insets show the transduced cells (H2BGFP+), and dotted lines indicate the dermal–epidermal border. Nuclei were stained with DAPI (blue). Scale bars = 100 µm (A), 20 µm (D and F), and 50 µm (E and H). FOV, field of view.
Figure 5.
Figure 5.
SOX9 overexpression induces hyperproliferation and defects in BM organization and spindle orientation. (A and B) Sagittal views of dorsal skin from control and embryos injected on E9 with Sox9-expressing lentivirus. Sections were immunostained for SOX9. (B) Embryos treated as described for A were pulsed for 2 h with EdU on E16.5 and then imaged. Inset shows transduced cells (GFP for control and immunostained for SOX9). (C) Quantification of EdU+ cells in the basal and suprabasal layers in B. Data are the mean ± SD from four embryos per condition. *, P = 0.01 (basal cells); *, P = 0.02 (suprabasal cells) by unpaired t test. (D) Sections of dorsal skin from E16.5 embryos treated as in A and B were immunostained for nidogen. Arrows indicate diffuse staining. Inset shows transduced cells (GFP for control and immunostained for SOX9). (E) Sections of dorsal skin from E16.5 embryos treated as in A and B. White circles indicate late-mitotic cells, and dotted lines indicate the dermal–epidermal border. Quantification of spindle orientation is presented to the right of each image. Inset shows transduced cells (GFP for control and immunostained for SOX9). Scale bars = 50 µm (A and B) and 20 µm (D and E).
Figure 6.
Figure 6.
Abi1-depleted epidermis exhibits defects in β-catenin localization and Wnt signaling. (A and B) Sagittal views of 10-µm dorsal skin sections from control and Abi1-2082 KD E16.5 dorsal skin immunostained for β-catenin (A) or nonphosphorylated (N.P. Ser45) β-catenin (B). Lower panels show digital magnifications (3×) of the red boxes in the upper panels. Insets show transduced cells (GFP+). Green asterisks in A indicate developing HFs. Green arrows in A indicate nuclear β-catenin in the IFE. (C) Quantification of nonphosphorylated β-catenin intensity from the images shown in B. Data are the mean ± SD of four embryos per condition. *, P = 0.0023 by unpaired t test. (D) Sagittal views of 10-µm dorsal skin sections from control and Abi1-2082 KD E16.5 dorsal skin coimmunostained for LEF1 and P-cadherin. Arrows denote suprabasal LEF1. (E–G) Sagittal views of 10-µm sections of dorsal skin from E16.5 CD1 embryos injected on E9 with lentiviruses expressing Wnt reporter-RFP plus shScr;H2B-GFP (E), Wnt reporter-RFP plus shAbi1-2082;H2B-GFP (F), and Wnt reporter-RFP plus shWasf2-493;H2B-GFP (G). (H) Primary mouse keratinocytes were transduced with shScr, shAbi1-2082, or shAbi1-488 shRNAs. Cells were left untreated or treated with 5 µM XAV939 for 24 h, pulsed for 3 h with EdU, and analyzed. Data are the mean ± SD of four experiments. *, P = 0.002 (Ctrl vs. Abi1-2082); *, P = 0.004 (Ctrl vs. Abi1-488), by unpaired t test. (I) Western blot analysis of primary mouse keratinocytes transduced with Scr, Abi1-2082, or Wasf2-493 shRNAs. Blots were probed with antibodies to β-catenin, nonphosphorylated (Ser45) β-catenin, nonphosphorylated (Ser37/Thr41) β-catenin, and GAPDH (loading control). (J) Western blot analysis of primary mouse keratinocytes transduced with Scr, Abi1-2082, or Wasf2-493 shRNAs. Blots were probed with antibodies to GSK3β, phosphorylated GSK3β, and GAPDH (loading control). (K) Quantitative PCR analysis of Wnt target genes in primary mouse keratinocytes transduced with shScr or shAbi1-2082 shRNAs and treated with 10 ng Wnt3a for 12 h. Data are the mean ± SD of four preparations. *, P < 0.05. Insets in B and D–G show transduced cells (H2BGFP+). N.P. β-catenin indicates nonphosphorylated β-catenin. Dotted lines indicate the dermal–epidermal border. Nuclei were stained with DAPI (blue). Scale bars = 20 µm (A, B, and D) and 50 µm (G).
Figure 7.
Figure 7.
The actin cytoskeleton regulates β-catenin localization and Wnt signaling. (A) Wild-type keratinocytes were treated with DMSO (control), 250 nM jasplakinolide, or 125 nM latrunculin for 30 min, fixed, and labeled for β-catenin or nonphosphorylated (Ser45) β-catenin. (B) Quantification of β-catenin and nonphosphorylated (Ser45) β-catenin nuclear fluorescence intensity from the images shown in A. Data are the mean ± SD of 2,200 cells from three independent experiments. *, P = 0.013 for total β-catenin; *, P = 0.0073 for nonphosphorylated β-catenin, by unpaired t test. (C) Sagittal views of 10-µm sections of dorsal skin from E16.5 CD1 embryos injected on E9 with lentiviruses expressing Wnt reporter-RFP plus shActb-289;H2B-GFP. Nuclei were stained with DAPI (blue). Scale bars = 20 µm (A) and 50 µm (B).

Similar articles

Cited by

References

    1. Ahtiainen L., Lefebvre S., Lindfors P.H., Renvoisé E., Shirokova V., Vartiainen M.K., Thesleff I., and Mikkola M.L.. 2014. Directional cell migration, but not proliferation, drives hair placode morphogenesis. Dev. Cell. 28:588–602. 10.1016/j.devcel.2014.02.003 - DOI - PubMed
    1. Alekhina O., Burstein E., and Billadeau D.D.. 2017. Cellular functions of WASP family proteins at a glance. J. Cell Sci. 130:2235–2241. 10.1242/jcs.199570 - DOI - PMC - PubMed
    1. Amin E., Dubey B.N., Zhang S.C., Gremer L., Dvorsky R., Moll J.M., Taha M.S., Nagel-Steger L., Piekorz R.P., Somlyo A.V., and Ahmadian M.R.. 2013. Rho-kinase: regulation, (dys)function, and inhibition. Biol. Chem. 394:1399–1410. 10.1515/hsz-2013-0181 - DOI - PMC - PubMed
    1. Amit S., Hatzubai A., Birman Y., Andersen J.S., Ben-Shushan E., Mann M., Ben-Neriah Y., and Alkalay I.. 2002. Axin-mediated CKI phosphorylation of beta-catenin at Ser 45: a molecular switch for the Wnt pathway. Genes Dev. 16:1066–1076. 10.1101/gad.230302 - DOI - PMC - PubMed
    1. Benitah S.A., Frye M., Glogauer M., and Watt F.M.. 2005. Stem cell depletion through epidermal deletion of Rac1. Science. 309:933–935. 10.1126/science.1113579 - DOI - PubMed

Publication types

MeSH terms