. 2019 Apr;30(4):564-576.
doi: 10.1681/ASN.2018090914. Epub 2019 Mar 13.

The RNA-Protein Interactome of Differentiated Kidney Tubular Epithelial Cells

Affiliations

The RNA-Protein Interactome of Differentiated Kidney Tubular Epithelial Cells

Michael Ignarski et al. J Am Soc Nephrol. 2019 Apr.

Erratum in

  • Correction: The RNA-Protein Interactome of Differentiated Kidney Tubular Epithelial Cells.
    Ignarski M, Rill C, Kaiser RWJ, Kaldirim M, Neuhaus R, Esmaillie R, Li X, Klein C, Bohl K, Petersen M, Frese CK, Höhne M, Atanassov I, Rinschen MM, Höpker K, Schermer B, Benzing T, Dieterich C, Fabretti F, Müller RU. Ignarski M, et al. J Am Soc Nephrol. 2025 Apr 11;36(7):1456. doi: 10.1681/ASN.0000000737. J Am Soc Nephrol. 2025. PMID: 40215110 Free PMC article. No abstract available.

Abstract

Background: RNA-binding proteins (RBPs) are fundamental regulators of cellular biology that affect all steps in the generation and processing of RNA molecules. Recent evidence suggests that regulation of RBPs that modulate both RNA stability and translation may have a profound effect on the proteome. However, regulation of RBPs in clinically relevant experimental conditions has not been studied systematically.

Methods: We used RNA interactome capture, a method for the global identification of RBPs to characterize the global RNA-binding proteome (RBPome) associated with polyA-tailed RNA species in murine ciliated epithelial cells of the inner medullary collecting duct. To study regulation of RBPs in a clinically relevant condition, we analyzed hypoxia-associated changes of the RBPome.

Results: We identified >1000 RBPs that had been previously found using other systems. In addition, we found a number of novel RBPs not identified by previous screens using mouse or human cells, suggesting that these proteins may be specific RBPs in differentiated kidney epithelial cells. We also found quantitative differences in RBP-binding to mRNA that were associated with hypoxia versus normoxia.

Conclusions: These findings demonstrate the regulation of RBPs through environmental stimuli and provide insight into the biology of hypoxia-response signaling in epithelial cells in the kidney. A repository of the RBPome and proteome in kidney tubular epithelial cells, derived from our findings, is freely accessible online, and may contribute to a better understanding of the role of RNA-protein interactions in kidney tubular epithelial cells, including the response of these cells to hypoxia.

Keywords: HIF; RBP; RNA-binding protein; cilia; hypoxia; tubule cells.


Figures

None
Graphical abstract
Figure 1.
Figure 1.
RNA-interactome capture reveals hundreds of RNA-associated proteins in differentiated inner medullary collecting duct cells. (A) Culturing scheme depicting the treatment of mIMCD-3 cells and schematic representation of the RIC procedure. mIMCD-3 cells were grown to 70% confluency and starved by serum deprivation to induce differentiation. After 12 hours, the cell culture medium was supplemented with 4-SU. 4-SU labeling and starvation were continued for 12 hours before 20 of 40 dishes were transferred to hypoxic conditions (1% O2, blue) for 6 hours, whereas the other 20 dishes were kept under normoxic conditions (21% O2, pink). After this treatment ten dishes of each condition were UVA crosslinked (UVA+), whereas the other ten dishes remained noncrosslinked (UVA−). Aliquots of the collected cell lysates were used for proteome analysis and the rest were submitted to RIC. RIC: after crosslinking and cell lysis, polyadenylated transcripts were captured with oligo-dT beads. The captured RNA-protein complexes were RNase treated and putative RBPs were identified using quantitative label-free proteomics. (B) Analysis of protein enrichment after oligo (dT) capture and RNase treatment by silver staining. The enrichment of a complex protein pattern is only detectable in the lanes with UVA-irradiated samples (+CL) and is absent in the lanes with nonirradiated samples (−CL). Lanes with samples after hypoxic or normoxic treatment are indicated by N or H, respectively. M, molecular weight marker. (C) RNA-bound proteome (RBPome) data of mIMCD-3 cell samples. Principal component analysis of RIC (on the basis of iBAQ intensities) for crosslinked (+CL/red) and noncrosslinked (−CL/black) samples showing a clear separation of the two groups. Open circles represent samples with hypoxia treatment; filled circles represent samples kept under normoxic conditions. (D) Scatter plot of the t test comparison of protein abundance in the crosslinked and noncrosslinked samples. The x axis is the mean log2 difference in abundance of crosslinked versus noncrosslinked samples; presented on the y axis are the corresponding −log10 P values. The cutoff for significance is an FDR<0.1. RBPs significantly enriched according to our cutoff are represented by large circles. RBPs not reaching significance are represented by small circles. Red, mouse RBPs and mouse orthologs of human RBPs previously described (summarized in Hentze et al. [2018]); black, novel RBPs; gray, others. FC, fold change; Hyp, hypoxia; Norm, normoxia; vs, versus.
Figure 2.
Figure 2.
RNA-interactome capture in mIMCD-3 cells clearly enriches for proteins with RNA-binding capacity. (A) Venn diagram depicting the number of RBPs identified in the mIMCD-3 RBPome (white) and the overlap with previously identified mouse (light gray) and human (dark gray) RBPs. Of 1058 RBPs identified in mIMCD-3 cells, 1033 were previously described in mouse (964) or human (858) samples (Hentze et al. [2018]). Twenty-five RBPs were not previously identified in mouse or human. (B) The fraction of known mouse RBPs contained in the mIMCD-3 proteome in comparison with the mIMCD-3 RBPome. Of 6033 proteins measured in the mIMCD-3 proteome, 1695 have been previously identified as mouse RBPs (28.1%). For the 510 class I RBPs, 464 have been previously observed (91%) and, among the combined class I and class II RBPs, 964 of 1058 (91.1%) have been previously identified. We calculate a 3.2-fold enrichment of class I and class I plus class II RBPs in the RBPome over the proteome. Gray, proteins previously identified as RBPs; white, not known to be RBPs (other). (C) Comparison of mIMCD-3 RBPome (gray) and mIMCD-3 proteome (white) for GO terms: “RNA-binding” and “DNA-binding.” (D) Pfam and Smart protein domains with significant enrichment in the mIMCD-3 RBPome. Statistical significance was determined with the Fisher exact test (Perseus software; FDR<0.05). (E) mIMCD-3 RBPome gene ontology enrichment analysis. Here, the ten most significantly overrepresented (black) and underrepresented (gray) GO terms for “molecular function” and “biological process (slim)” are depicted. Statistical significance was determined using the Fisher exact test (Perseus software; FDR<0.05). BP slim, biological process; GO, gene ontology; MF, molecular function.
Figure 3.
Figure 3.
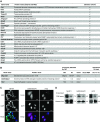
RNA-interactome capture identifies novel RNA binders in mIMCD-3 cells. (A) Table of novel, mIMCD-3–specific RBPs, previously not identified as mouse or human mRNA-interacting proteins. Depicted are the gene names, protein names according to Uniprot and MGI, and the selection criteria. The top 19 proteins (#) were significant in the performed t test (Perseus software). The bottom six proteins (*) were measured at least four times in the crosslinked samples (+CL) and not more than once in the noncrosslinked samples (−CL). (B) List of proteins selected for biochemical confirmation of RNA-binding capacity. The table contains information on gene name, protein name, presence in previous RIC studies as summarized for mouse (Mm) and human (Hs) datasets in the Hentze compendium, classification in the mIMCD-3 RBPome (class), and t test significance. (C) Cellular localization pattern of MFAP1, GADD45GIP1, and HIC2. MFAP1: HEK293T cells expressing an integrated, single copy of the human MFAP1 CDS fused to eGFP, using the TALEN approach, were subjected to fluorescent imaging. GADD45GIP1 and HIC2: HEK293T cells transiently expressing the human CDS of GADD45GIP1 or HIC2 fused to triple FLAG were subjected to immunofluorescent imaging. DAPI was used as a nuclear counterstain. Scale bar, 20 µm. (D) Biochemical validation of Mfap1a/b, Hic2, and Gadd45Gip1 as RBPs. Briefly, the human CDS of MFAP1, HIC2, and GADD45GIP1 were cloned into the 3xFLAG-pcDNA6 and transiently expressed in HEK293T cell. FLAG-tagged proteins were immunoprecipitated from crosslinked (+) and noncrosslinked (−) samples and the associated RNA was labeled by T4 PNK with 32P. The protein-RNA complexes were separated on PAA-gels and blotted onto nitrocellulose membranes. PNK-assay: autoradiograph of the membrane containing the indicated protein with the associated RNA labeled with 32P. Western blot: visualization of FLAG-tagged protein by western blotting with the anti-FLAG antibody. Hs, homo sapiens; Mm, mus musculus; n.d., not detected.
Figure 4.
Figure 4.
Cilia-associated proteins show RNA-binding capacity. (A) Immunofluorescence imaging of ciliated mIMCD-3 cells. The cells were serum starved for 30 hours to induce ciliogenesis, fixed, and stained with antibodies specific for actylated tubulin (green) and pericentrin (magenta). DAPI (blue) was used as a nuclear counterstain. Scale bar, 20 µm. (B) Comparison of known mouse RBPs and mIMCD-3 RBPs with cilia-associated proteins as described by Boldt et al. (2016) (SYSCILIA) and Kohli et al. (2017) (APEX). The compendium of known mouse RBPs (n=1914) contains 93 ciliary proteins as determined by APEX (red) and 20 ciliary proteins characterized by the SYSCILIA consortium (blue). The mIMCD-3 RBPome (n=1058) shares 62 and ten ciliary proteins with the APEX and the SYSCILIA datasets, respectively. (C) Identity of ciliary proteins in the mIMCD-3 RBPome. Depicted in red are proteins overlapping with the APEX dataset and/or the SYSCILIA dataset. For proteins significantly enriched in the mIMCD-3 RBPome the protein name is indicated. Gray, mIMCD-3 proteins without correspondence to APEX and SYSCILIA datasets. For details of the scatter plot refer to Figure 1D. (D) Scatter plot illustrating mIMCD-3 RBPs (never identified in mammalian RIC experiments before) associated with a known ciliary function. A PubMed-based literature search was performed for the 25 mIMCD-3 RBPs (black) shown in Figure 3A. Protein names are indicated for RBPs associated with the search term “cilia.” For details regarding the scatter plot refer to Figure 1D. +CL, crosslinked; −CL, not crosslinked; FC, fold change; vs, versus.
Figure 5.
Figure 5.
The RBPome is modulated by oxygen tension. (A) Volcano plot illustrating differentially abundant proteins between the proteomes of hypoxia-treated and normoxic mIMCD-3 cells. The −log10 P value is plotted against the log2 fold change (hypoxia versus normoxia). Significantly regulated proteins are above the cutoff line and are indicated by name (Perseus software, t test, FDR<0.1, s0=0.1). In total, 4883 proteins were plotted. Red, known Hif1a targets,,; blue, Kdm3a, manually curated from the literature as an Hif1a target. Average fold change of total number of proteins (n=4883) 0.015; average fold change of Hif1a targets (n=94) 0.45. (B) Venn diagram depicting the comparison of RBPomes of mIMCD-3 cells grown in hypoxic and normoxic conditions. Of the 289 (normoxia) and 206 (hypoxia) RBPs reaching the threshold of class I RBPs, six and six proteins are exclusively associated with normoxia or hypoxia, respectively. Gray, normoxia-associated RBPs (class I RBPs reaching statistical significance when comparing three +CL versus three −CL samples in normoxia); blue, hypoxia-associated RBPs (class I RBPs reaching statistical significance when comparing three +CL versus three −CL samples in hypoxia); red, six +CL versus six −CL samples (455 class I RBPs reaching statistical significance in the comparison of the total dataset comprising six +CL and six −CL samples). (C) Scatter plot showing the correlation of hypoxia log2 fold changes (+CL versus −CL) on the x axis versus the log2 fold change values of normoxia (+CL versus −CL) on the y axis. The linear regression was calculated with R (black line, lm () method, formula: y=0.3170+0.7069*x). RBPs beyond the calculated 95% prediction interval (outside the gray lines) show a significantly different FC in the two conditions, sometimes going in opposite directions (from positive to negative), suggesting a regulation of the binding to target RNAs in normoxia or hypoxia. Red, class I and II RBPs (with names for proteins above and below the calculated prediction interval); big circles, significant in t test (FDR<0.1); small circles, NS in t test (FDR≥0.1); black, seven RBPs below and above the calculated prediction interval matching the 12 differentially bound RBPs in Figure 5B; gray, others. (D) Volcano plot illustrating the abundance of differentially bound RBPs (Figure 5B) between the proteomes of hypoxia-treated and normoxic mIMCD-3 cells. Red, differentially bound RBPs significant in normoxia; blue, differentially bound RBPs significant in hypoxia. Two proteins (Dhx57and Secisbp2l) were not quantified in the proteome. For details regarding the volcano plot refer to Figure 5A. (E) List of high-confidence RBPs associated with either hypoxia or normoxia. This table shows the seven of 12 differentially bound RBPs that were measured in hypoxia- or normoxia-treated cells, respectively, and in addition were beyond the calculated 95% prediction interval. Given are gene and protein names, significance in t test (+CL versus −CL, in hypoxia or normoxia), information on the presence in previous RIC studies as summarized for mouse (Mm) and human (Hs) datasets in the Hentze compendium, classification in the mIMCD-3 RBPome (class), and classification as to whether the protein is a novel RBP. +CL, crosslinked; −CL, not crosslinked; FC, fold change; vs, versus.

Similar articles

Cited by

References

    1. Hentze MW, Castello A, Schwarzl T, Preiss T: A brave new world of RNA-binding proteins. Nat Rev Mol Cell Biol 19: 327–341, 2018 - PubMed
    1. Liao Y, Castello A, Fischer B, Leicht S, Föehr S, Frese CK, et al.: The cardiomyocyte RNA-binding proteome: Links to intermediary metabolism and heart disease. Cell Reports 16: 1456–1469, 2016 - PMC - PubMed
    1. Beckmann BM, Horos R, Fischer B, Castello A, Eichelbaum K, Alleaume A-M, et al.: The RNA-binding proteomes from yeast to man harbour conserved enigmRBPs. Nat Commun 6: 10127, 2015 - PMC - PubMed
    1. Dutertre M, Vagner S: DNA-Damage Response RNA-Binding Proteins (DDRBPs): Perspectives from a new class of proteins and their RNA targets. J Mol Biol 429: 3139–3145, 2017 - PubMed
    1. Milek M, Landthaler M: Systematic detection of poly(A)+ RNA-interacting proteins and their differential binding. Methods Mol Biol 1649: 405–417, 2018 - PubMed

Publication types