. 2019 May 29;39(22):4268-4281.
doi: 10.1523/JNEUROSCI.2816-18.2019. Epub 2019 Mar 13.

Chronic Nicotine Exposure Alters the Neurophysiology of Habenulo-Interpeduncular Circuitry

Affiliations

Chronic Nicotine Exposure Alters the Neurophysiology of Habenulo-Interpeduncular Circuitry

Matthew C Arvin et al. J Neurosci. .

Abstract

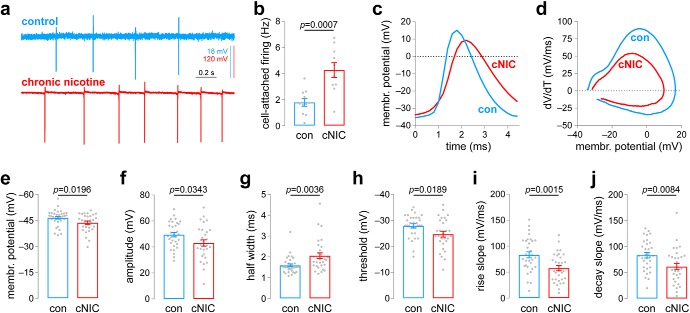
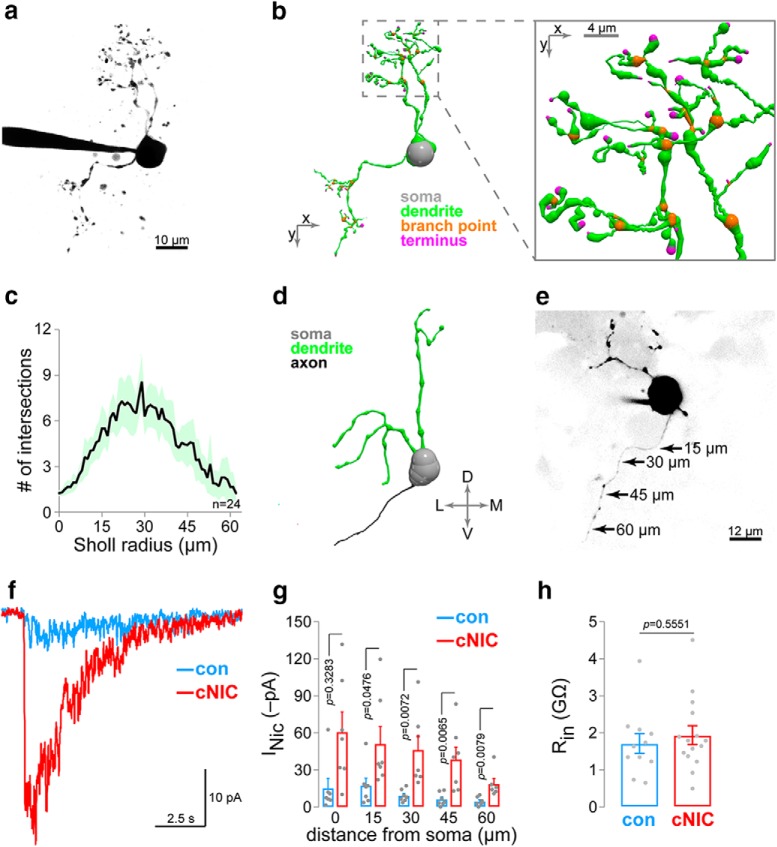
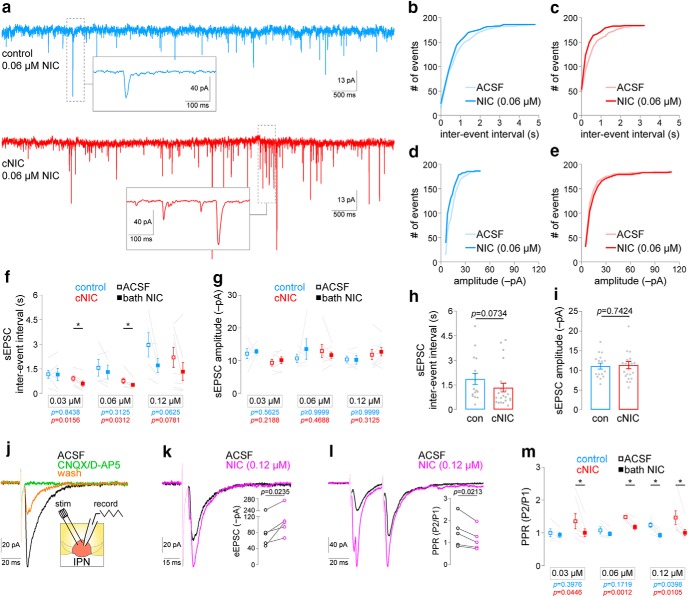
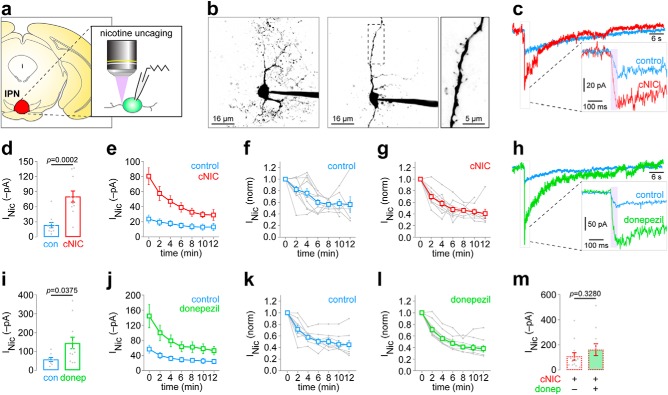
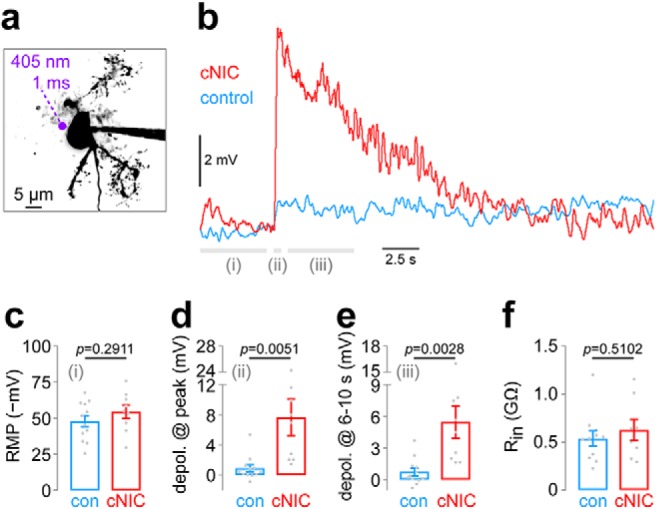
Antagonism of nicotinic acetylcholine receptors (nAChRs) in the medial habenula (MHb) or interpeduncular nucleus (IPN) triggers withdrawal-like behaviors in mice chronically exposed to nicotine, implying that nicotine dependence involves the sensitization of nicotinic signaling. Identification of receptor and/or neurophysiological mechanisms underlying this sensitization is important, as it could promote novel therapeutic strategies to reduce tobacco use. Using an approach involving photoactivatable nicotine, we previously demonstrated that chronic nicotine (cNIC) potently enhances nAChR function in dendrites of MHb neurons. However, whether cNIC modulates downstream components of the habenulo-interpeduncular (Hb-IP) circuit is unknown. In this study, cNIC-mediated changes to Hb-IP nAChR function were examined in mouse (male and female) brain slices using molecular, electrophysiological, and optical techniques. cNIC enhanced action potential firing and modified spike waveform characteristics in MHb neurons. Nicotine uncaging revealed nAChR functional enhancement by cNIC on proximal axonal membranes. Similarly, nAChR-driven glutamate release from MHb axons was enhanced by cNIC. In IPN, the target structure of MHb axons, neuronal morphology, and nAChR expression is complex, with stronger nAChR function in the rostral subnucleus [rostral IPN (IPR)]. As in MHb, cNIC induced strong upregulation of nAChR function in IPN neurons. This, coupled with cNIC-enhanced nicotine-stimulated glutamate release, was associated with stronger depolarization responses to brief (1 ms) nicotine uncaging adjacent to IPR neurons. Together, these results indicate that chronic exposure to nicotine dramatically alters nicotinic cholinergic signaling and cell excitability in Hb-IP circuits, a key pathway involved in nicotine dependence.SIGNIFICANCE STATEMENT This study uncovers several neuropharmacological alterations following chronic exposure to nicotine in a key brain circuit involved in nicotine dependence. These results suggest that smokers or regular users of electronic nicotine delivery systems (i.e., "e-cigarettes") likely undergo sensitization of cholinergic circuitry in the Hb-IP system. Reducing the activity of Hb-IP nAChRs, either volitionally during smoking cessation or inadvertently via receptor desensitization during nicotine intake, may be a key trigger of withdrawal in nicotine dependence. Escalation of nicotine intake in smokers, or tolerance, may involve stimulation of these sensitized cholinergic pathways. Smoking cessation therapeutics are only marginally effective, and by identifying cellular/receptor mechanisms of nicotine dependence, our results take a step toward improved therapeutic approaches for this disorder.

Keywords: 2-photon; acetylcholine; electrophysiology; glutamate; nicotine; nicotinic.


Figures

Figure 1.
Figure 1.
Chronic nicotine exposure alters spontaneous action potential firing in MHb neurons. a, Representative cell-attached firing traces for MHb neurons from control and cNIC-treated mice. b, Summary data (control: n = 11 cells, n = 3 male mice; cNIC-treated: n = 10 cells, n = 4 male mice) of cell-attached firing in MHb neurons for control and cNIC-treated mice. c, Representative spontaneous action potentials for whole-cell patch-clamped MHb neurons for control and cNIC-treated mice, illustrating features quantified in subsequent panels. d, Representative spontaneous action potential phase plots for MHb neurons from control and cNIC-treated mice. e, Summary resting membrane potential data (control: n = 34 cells, n = 5 male mice; cNIC-treated: n = 31 cells, n = 7 male mice; the same mice were used for data in fj) for MHb neurons from control and cNIC-treated mice. f, Summary action potential amplitude data (control: n = 32 cells; cNIC-treated: n = 30 cells) for MHb neurons from control and cNIC-treated mice. g, Summary action half-width data (control: n = 32 cells; cNIC-treated: n = 30 cells) for MHb neurons from control and cNIC-treated mice. h, Summary action potential threshold data (control: n = 32 cells; cNIC-treated: n = 29 cells) for MHb neurons from control and cNIC-treated mice. i, Summary action potential maximum rise slope data (control: n = 32 cells; cNIC-treated: n = 31 cells) for MHb neurons from control and cNIC-treated mice. j, Summary action potential maximum decay slope data (control: n = 32 cells; nicotine-treated: n = 31 cells) for MHb neurons from control and cNIC-treated mice.
Figure 2.
Figure 2.
nAChR functional upregulation in axons of MHb neurons. a, Representative 2PLSM image of a patch-clamped MHb neuron. b, 3D reconstruction of the neuron shown in a. Inset shows exploded view of reconstructed dendritic arbor. c, Sholl analysis for MHb neurons. For n = 24 MHb neurons (n = 17 mice [16 male/1 female]), morphology was reconstructed in 3D, and the number of Sholl intersections is plotted at each Sholl radius (1 μm step size). Shading indicates the 95% confidence interval. d, 3D reconstruction of a different MHb neuron with an intact axon. e, Nicotine uncaging along MHb neuron axons. A representative 2PLSM image of an MHb neuron with intact axon is shown, including approximate positions where PA-Nic (50 μm) laser flash photolysis was executed adjacent to the axonal membrane. f, Representative nAChR currents following nicotine uncaging along the axon of an MHb neuron from a control/cNIC-treated mouse. g, Summary nicotine uncaging-evoked current amplitudes for MHb neurons at the indicated distance from the soma along the axon (control: n = 7 cells, n = 4 mice [9 male/0 female]; cNIC-treated: n = 7 cells, n = 5 mice [5 male/0 female]). h, Input resistance in control and cNIC-treated MHb neurons (control: n = 11 cells, n = 4 mice [2 male/2 female]; cNIC-treated: n = 15 cells, n = 4 mice [4 male/0 female]).
Figure 3.
Figure 3.
Chronic nicotine enhances nicotine-stimulated glutamate release in IPN. a, Representative IPN neuron voltage-clamp recordings from mice treated with control or chronic nicotine. Recordings show Spontaneous excitatory postsynaptic current (sEPSCs) during superfusion of the slice with 0.06 μm nicotine. Insets show exploded view of example sEPSCs. b, sEPSC interevent interval cumulative distribution for a representative neuron from a control mouse before and after nicotine (0.06 μm) superfusion. c, sEPSC interevent interval cumulative distribution for a representative neuron from a cNIC-treated mouse before and after nicotine (0.06 μm) superfusion. d, sEPSC amplitude cumulative distribution for a representative neuron from a control mouse before and after nicotine (0.06 μm) superfusion. e, sEPSC amplitude cumulative distribution for a representative neuron from a cNIC-treated mouse before and after nicotine (0.06 μm) superfusion. f, Summary plots of sEPSC interevent interval for IPN neurons from control [0.03 μm, n = 6 cells; 0.06 μm, n = 5 cells; 0.12 μm, n = 5 cells; n = 7 mice (6 male/1 female)] and cNIC-treated [0.03 μm, n = 7 cells; 0.06 μm, n = 7 cells; 0.12 μm, n = 8 cells; n = 9 mice (5 male/4 female)] mice before and after superfusion of the slice with the indicated nicotine concentration. p Values (Wilcoxon matched-pairs signed rank tests) are shown for each group (blue, control mice; red, cNIC mice). The cells/mice used were also used to derive data in g, h, and i. g, Summary plots of sEPSC amplitude for IPN neurons from control and cNIC-treated mice before and after superfusion of the slice with the indicated nicotine concentration. p Values (Wilcoxon matched-pairs signed rank tests) are shown for each group (blue, control mice; red, cNIC mice). h, Summary baseline (no nicotine superfusion) sEPSC interevent interval data for all IPN recordings from control and cNIC-treated mice. p Value, Mann–Whitney test. i, Summary baseline (no nicotine superfusion) sEPSC amplitude data for all IPN recordings from control and cNIC-treated mice. p Value, Mann–Whitney test. j, Electrically eEPSCs in a voltage-clamped IPN neuron are sensitive to synaptic blockers (10 μm NBQX, 50 μm d-AP5). Inset, Recording configuration is shown for data in j through m. k, Superfusion of 0.12 μm nicotine enhances evoked glutamatergic transmission in IPN neurons. Inset, Summary plots of eEPSC amplitude before/after nicotine superfusion [n = 5 cells; n = 3 mice (2 male/1 female)]. p Value, Paired t test. l, Superfusion of 0.12 μm nicotine modifies paired-pulse facilitation in IPN neurons. Inset, Summary plots of paired-pulse eEPSC amplitude ratio (i.e., PPR) before/after nicotine superfusion [n = 5 cells; n = 4 mice (2 male/2 female)]. p Value, Paired t test. m, Selective modulation of paired-pulse facilitation by low nicotine concentrations in IPN neurons from cNIC-treated mice. Summary plots are shown for PPR measurements in IPN neurons of control [0.03 μm, n = 5 cells; 0.06 μm, n = 5 cells; 0.12 μm, n = 6 cells; n = 8 mice (5 male/3 female)] or cNIC-treated [0.03 μm, n = 7 cells; 0.06 μm, n = 6 cells; 0.12 μm, n = 7 cells; n = 9 mice (6 male/3 female)] mice before and after superfusion of the slice with the indicated nicotine concentration. *p < 0.05 (paired t test).
Figure 4.
Figure 4.
Nicotine uncaging reveals nAChR functional upregulation in IPN neurons following chronic nicotine. a, PA-Nic was used to uncage nicotine with laser flash photolysis adjacent to IPN neurons in coronal brain slices of control and cNIC-treated mice. b, Variable IPN neuron morphology. Representative 2PLSM images of IPN neurons with complex (left image) and sparse (middle image) dendritic arbors are shown. Some neurons (middle image, boxed area exploded view in right image) have clear dendritic spines. c, Representative nicotine uncaging (50 ms, 2 mW, perisomatic stimulus) responses in an IPN neuron of a control and cNIC-treated mouse. Inset shows exploded view of the initial uncaging event. d, Summary data for all initial/first nicotine uncaging responses in IPN neurons of control [n = 11 cells; n = 3 mice (1 male/2 female)] and cNIC-treated [n = 11 cells; n = 4 mice (1 male/3 female)] mice. Cells/mice used were also used to derive data in c, e, f, and g. p Value, Unpaired t test. e, Summary time-series data for repeated (2 min interstimulus interval) nicotine uncaging responses in IPN neurons of control and cNIC-treated mice. Data at 0 min are the same data as in d but are replotted for clarity. Summary data from e for control (f) and cNIC-treated (g) mice are replotted on a normalized scale with individual cells shown in gray. h, Representative nicotine uncaging (50 ms, 2 mW; perisomatic stimulus) responses in IPN neurons from naive mice are shown for slices acutely treated with control ACSF or donepezil (1 μm; superfusion). Inset shows exploded view of the initial uncaging event. i, Summary data for all initial/first nicotine uncaging responses in control [n = 8 cells, 3 mice (2 male/1 female)] and donepezil-treated [n = 12 cells, 5 mice (3 male/2 female)] IPN neurons. p Value, Unpaired t test. j, Summary time-series data for repeated (2 min interstimulus interval) nicotine uncaging responses in control and donepezil-treated IPN neurons. Data at 0 min are the same data as in i but are replotted for clarity. k, l, Summary data from j for control (k) and donepezil-treated (l) slices are replotted on a normalized scale with individual cells shown in gray. m, Summary data for all initial/first nicotine uncaging responses in IPN neurons from cNIC-treated mice, where slices were either exposed to ACSF [control; n = 13 cells, 2 mice (1 male/1 female)] or donepezil [1 μm, superfusion; n = 11 cells, 2 mice (1 male/1 female)]. p Value, Unpaired t test.
Figure 5.
Figure 5.
Prolonged inward currents in IPN neurons are specific to nicotine. a, Nicotine (100 μm) or ACh (300 μm) was applied to naive IPN neurons in slices via pressure ejection application. Repeated application at 2 or 10 min interstimulus intervals was used. b, Representative nicotine-evoked currents [2 min interstimulus interval; time points shown (min), 0, 6, 12). c, Summary time-series data for nicotine pressure ejection (2 min interstimulus interval). Individual cell responses [n = 10 cells; n = 4 mice (2 male/2 female)] are shown in gray. d, Summary time-series data for nicotine pressure ejection (10 min interstimulus interval). Individual cell responses [n = 8 cells; n = 3 mice (1 male/2 female)] are shown in gray. e, Representative ACh-evoked currents [2 min interstimulus interval; time points shown (min), 0, 6, 12]. f, Summary time-series data for ACh pressure ejection (2 min interstimulus interval). Individual cell responses [n = 12 cells; n = 4 mice (3 male/1 female)] are shown in gray. g, Representative ACh- and nicotine-evoked inward currents in IPN neurons are plotted on the same time scale. h, Summary rise time data comparing ACh [n = 12 cells; n = 4 mice (3 male/1 female)] and nicotine [n = 12 cells; n = 4 mice (2 male/2 female)] pressure ejection application. p Value, Unpaired t test. ACh data are replotted at right on a different scale. i, Summary decay time data comparing ACh [n = 12 cells; n = 4 mice (3 male/1 female)] and nicotine [n = 11 cells; n = 4 mice (2 male/2 female)] pressure ejection application. p Value, Unpaired t test.
Figure 6.
Figure 6.
Cholinergic components in rostral IPN subnucleus. a, A Dodt contrast image of the IPN is shown with patch-clamp electrode tip in the IPR. b, Representative traces and summary data for ACh-evoked currents in IPR and IPC neurons [IPR, n = 12 cells; IPC, n = 5 cells; n = 4 mice (3 male/1 female)]. c, Representative triple-label FISH images in IPN probing for Chrna5, Chrnb4, and Gad2. d, Example image of Chrna5, Chrnb4, and Gad2 FISH signals in individual IPR neurons. Exploded view of numbered/boxed cells are shown at bottom right. e, Scatterplot of Chrna5 (abscissa) vs Chrnb4 (ordinate) “% coverage” for all nuclei in IPR FISH images (n = 3 male mice). Gad2 % coverage for each nucleus is represented via the indicated dot color. f, Left, Pie graph of Chrna5+ nuclei showing fraction of Chrnb4+ and Chrnb4 nuclei. Right, Pie graph of Chrnb4+ nuclei showing fraction of Chrna5+ and Chrna5 nuclei. g, Scatterplot of Chrna5 (abscissa) vs Chrnb2 (ordinate) % coverage for all nuclei in IPR FISH images [n = 3 mice (2 male/1 female)]. Inset, Pie graph of Chrna5+ nuclei showing fraction of Chrnb2+ and Chrnb2 nuclei. h, Scatterplot of Chrna5 (abscissa) vs Chrna2 (ordinate) % coverage for all nuclei in IPR FISH images [n = 3 mice (2 male/1 female)]. Inset, Pie graph of Chrna5+ nuclei showing fraction of Chrnb2+ and Chrna2 nuclei. i, Scatterplot of Chrna5 (abscissa) vs Nacho (ordinate) % coverage for all nuclei in IPR FISH images [n = 3 mice (2 male/1 female)]. Inset, Pie graph of Chrna5+ nuclei showing fraction of Nacho+ and Nacho nuclei. j, Scatterplot of Chrna5 (abscissa) vs Chrm3 (ordinate) % coverage for all nuclei in IPR FISH images [n = 3 mice (2 male/1 female)]. Inset, Pie graph of Chrna5+ nuclei showing fraction of Chrm3+ and Chrm3 nuclei. k, Scatterplot of Chrna5 (abscissa) vs Chrm5 (ordinate) % coverage for all nuclei in IPR FISH images [n = 3 mice (2 male/1 female)]. Inset, Pie graph of Chrna5+ nuclei showing fraction of Chrm5+ and Chrm5 nuclei. See Table 1 for full summary of FISH results.
Figure 7.
Figure 7.
nAChR expression in rostral IPN neurons. a, Representative FISH image of Chrna5 and Gad2 FISH signals in IPR. b, Scatterplot of Gad2 (abscissa) vs Chrna5 (ordinate) % coverage for all nuclei in IPR FISH images (these data are from the same experiment shown in Fig. 6e). c, Pie graph of Gad2+ and Gad2 nuclei showing fraction of Chrna5+ and Chrna5 nuclei. d, Representative FISH image of Chrna5 and SstFISH signals in IPR. e, Scatterplot of Sst (abscissa) vs Chrna5 (ordinate) % coverage for all nuclei in IPR FISH images (n = 3 male mice). f, Pie graph of Sst+ and Sst nuclei showing fraction of Chrna5+ and Chrna5 nuclei. g, Representative FISH image of Chrna5 and Pvalb FISH signals in IPR. h, Scatterplot of Pvalb (abscissa) vs Chrna5 (ordinate) % coverage for all nuclei in IPR FISH images (n = 3 male mice). i, Pie graph of Pvalb+ and Pvalb nuclei showing fraction of Chrna5+ and Chrna5 nuclei. j, Representative FISH image of Chrna5 and Slc17a6 FISH signals in IPR. k, Scatterplot of Slc17a6 (abscissa) vs Chrna5 (ordinate) % coverage for all nuclei in IPR FISH images (n = 3 male mice). l, Pie graph of Slc17a6+ and Slc17a6 nuclei showing fraction of Chrna5+ and Chrna5 nuclei.
Figure 8.
Figure 8.
Functional nAChRs in IPR neurons. a, Representative ACh (300 μm)-evoked currents in Gad2+ and adjacent Gad2 IPR neurons. Inset, Plot of ACh-evoked current amplitude in all tested Gad2+ and Gad2 IPR neurons (Gad2+, n = 9 cells; Gad2, n = 10 cells; n = 2 male mice). b, Example 2PLSM images of Gad2+ IPR neurons. c, Representative ACh (300 μm)-evoked currents in Sst+ and adjacent Sst IPR neurons. Inset, Plot of ACh-evoked current amplitude in all tested Sst+ and Sst IPR neurons [Sst+, n = 10 cells; Sst, n = 9 cells; n = 3 mice (1 male/2 female)]. d, Example 2PLSM images of Sst+ IPR neurons. e, Representative ACh (300 μm)-evoked currents in Pvalb+ and adjacent Pvalb IPR neurons. Inset, Plot of ACh-evoked current amplitude in all tested Pvalb+ and Pvalb IPR neurons (Pvalb+, n = 9 cells; Pvalb, n = 11 cells; n = 2 male mice). f, Example 2PLSM images of Pvalb+ IPR neurons. g, Representative ACh (300 μm)-evoked currents in vGluT2+ and adjacent vGluT2 IPR neurons. Inset, Plot of ACh-evoked current amplitude in all tested vGluT2+ and vGluT2 IPR neurons (vGluT2+, n = 7 cells; vGluT2, n = 8 cells; n = 3 male mice). h, Example 2PLSM images of vGluT2+ IPR neurons.
Figure 9.
Figure 9.
Chronic nicotine enhances IPR neuron excitability. a, Representative IPR neuron and perisomatic photolysis spot location. b, An averaged [control: n = 12 cells, n = 4 mice (2 male/2 female); cNIC: n = 9 cells, n = 6 mice (3 male/3 female)] current-clamp recording trace is shown in IPR neurons from control and cNIC-treated mice. PA-Nic (100 μm) was superfused, and photolysis (1 ms flash, 405 nm, 2 mW) was executed at a perisomatic location. Data from time periods i, ii, and iii are shown in c, d, and e, respectively. c, Summary plot of mean resting membrane potential during time period i (from −5 to −0.5 s before flash onset; see b) is shown for control and cNIC-treated neurons (see b for cell/mouse numbers). p Value, Unpaired t test. d, Summary plot showing the mean membrane potential change during time period ii (from 0.0 to +0.5 s after flash onset; see b) for control and cNIC-treated neurons. p Value, Unpaired t test. e, Summary plot showing the mean membrane potential change during time period iii (from +1.0 to +5.0 s after flash onset; see b) for control and cNIC-treated neurons. p Value, Unpaired t test. f, Summary plot showing input resistance for control and cNIC-treated IPR neurons. See b for cell/mouse numbers. p Value, Unpaired t test.

References

    1. Ables JL, Görlich A, Antolin-Fontes B, Wang C, Lipford SM, Riad MH, Ren J, Hu F, Luo M, Kenny PJ, Heintz N, Ibañez-Tallon I (2017) Retrograde inhibition by a specific subset of interpeduncular α5 nicotinic neurons regulates nicotine preference. Proc Natl Acad Sci U S A 114:13012–13017. 10.1073/pnas.1717506114 - DOI - PMC - PubMed
    1. Arvin MC, Wokosin DL, Banala S, Lavis LD, Drenan RM (2019) Probing nicotinic acetylcholine receptor function in mouse brain slices via laser flash photolysis of photoactivatable nicotine. J Vis Exp. Advance online publication. Retrieved January 25 2019. doi: 10.3791/58873. 10.3791/58873 - DOI - PMC - PubMed
    1. Banala S, Arvin MC, Bannon NM, Jin XT, Macklin JJ, Wang Y, Peng C, Zhao G, Marshall JJ, Gee KR, Wokosin DL, Kim VJ, McIntosh JM, Contractor A, Lester HA, Kozorovitskiy Y, Drenan RM, Lavis LD (2018) Photoactivatable drugs for nicotinic optopharmacology. Nat Methods 15:347–350. 10.1038/nmeth.4637 - DOI - PMC - PubMed
    1. Benowitz NL. (2008) Neurobiology of nicotine addiction: implications for smoking cessation treatment. Am J Med 121 [4 Suppl 1]:S3–S10. 10.1016/j.amjmed.2008.01.015 - DOI - PubMed
    1. Benowitz NL. (2009) Pharmacology of nicotine: addiction, smoking-induced disease, and therapeutics. Annu Rev Pharmacol Toxicol 49:57–71. 10.1146/annurev.pharmtox.48.113006.094742 - DOI - PMC - PubMed

Publication types

LinkOut - more resources