. 2019 Mar 26;116(13):6172-6180.
doi: 10.1073/pnas.1822176116. Epub 2019 Mar 13.

RBFox2-miR-34a-Jph2 axis contributes to cardiac decompensation during heart failure

Affiliations

RBFox2-miR-34a-Jph2 axis contributes to cardiac decompensation during heart failure

Jing Hu et al. Proc Natl Acad Sci U S A. .

Abstract

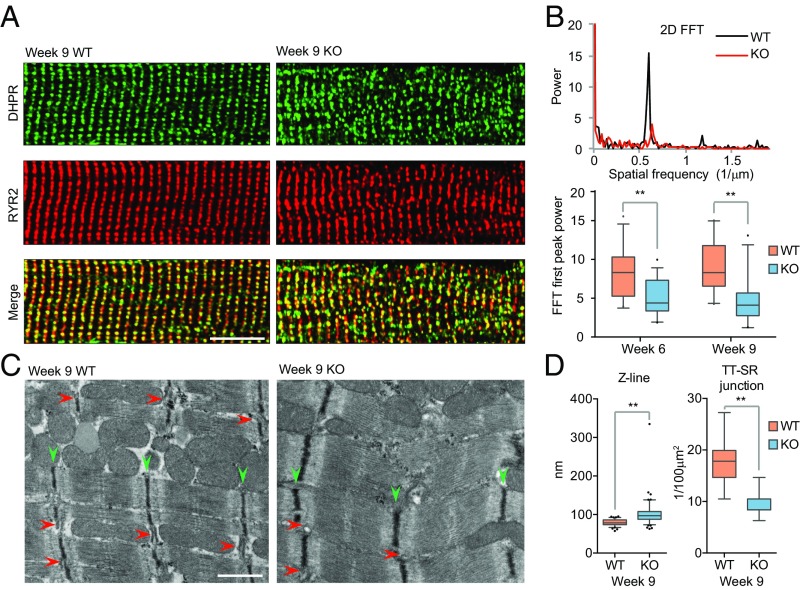
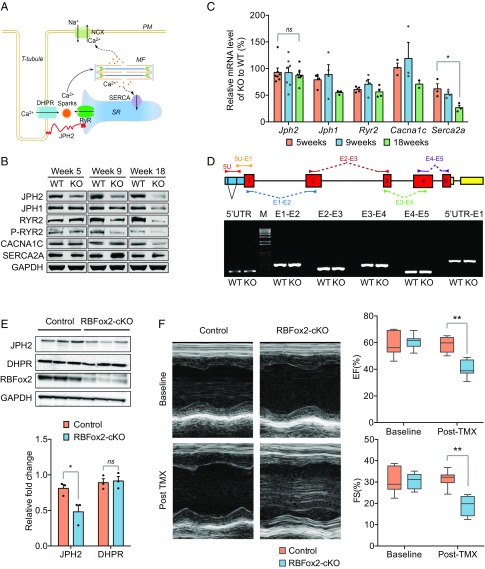
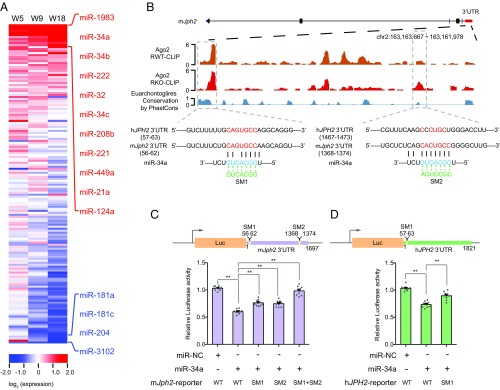
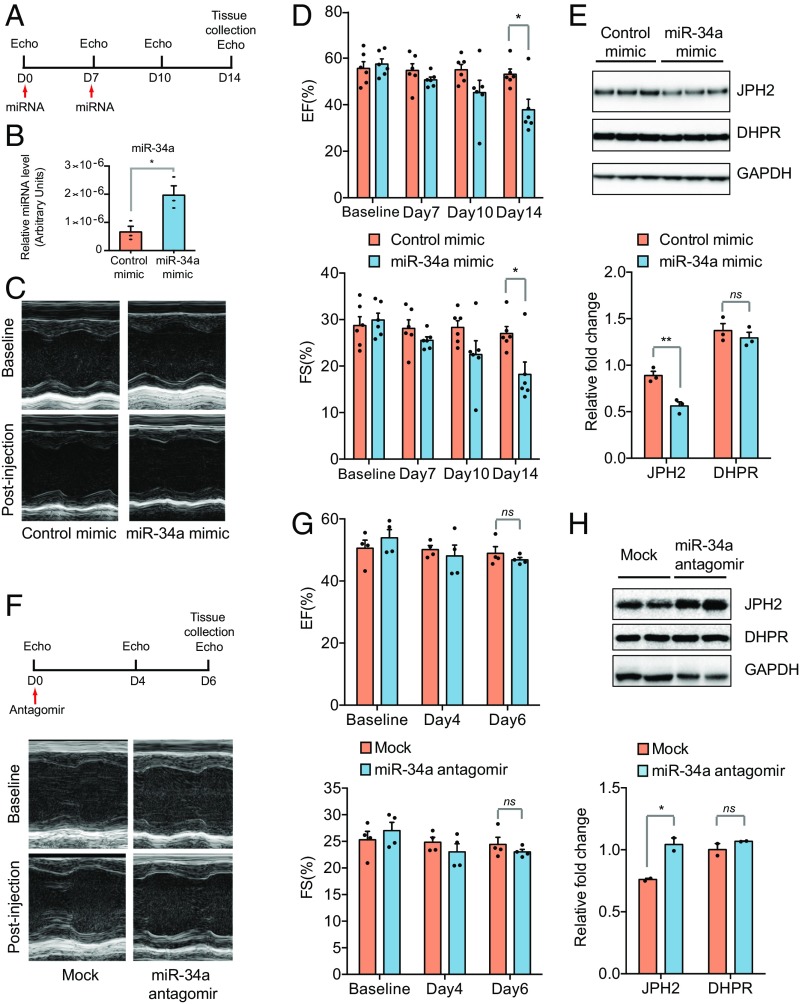
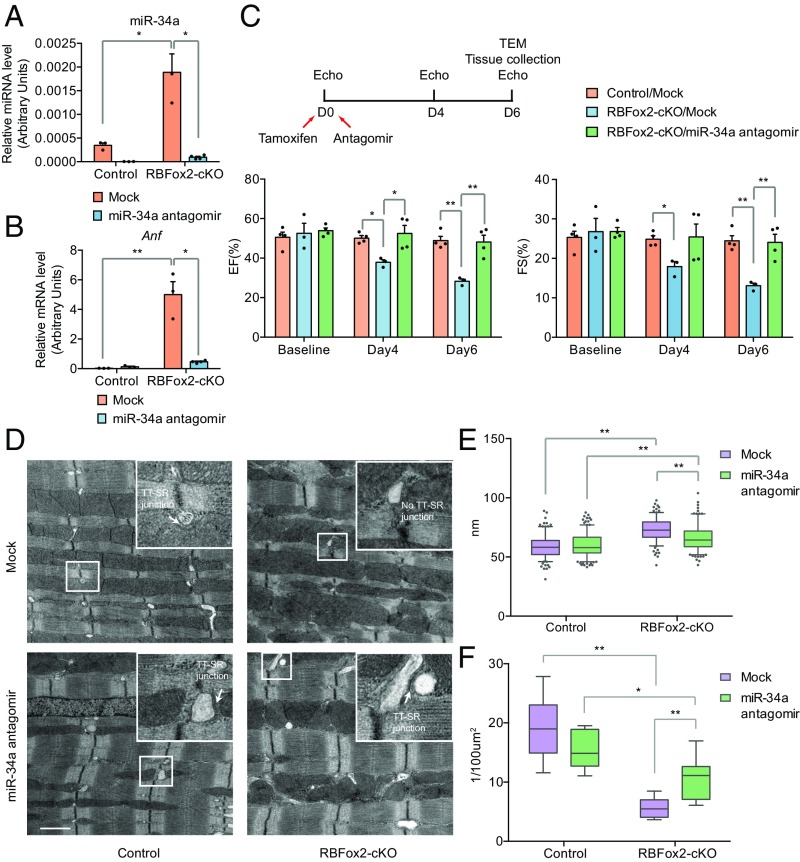
Heart performance relies on highly coordinated excitation-contraction (EC) coupling, and defects in this critical process may be exacerbated by additional genetic defects and/or environmental insults to cause eventual heart failure. Here we report a regulatory pathway consisting of the RNA binding protein RBFox2, a stress-induced microRNA miR-34a, and the essential EC coupler JPH2. In this pathway, initial cardiac defects diminish RBFox2 expression, which induces transcriptional repression of miR-34a, and elevated miR-34a targets Jph2 to impair EC coupling, which further manifests heart dysfunction, leading to progressive heart failure. The key contribution of miR-34a to this process is further established by administrating its mimic, which is sufficient to induce cardiac defects, and by using its antagomir to alleviate RBFox2 depletion-induced heart dysfunction. These findings elucidate a potential feed-forward mechanism to account for a critical transition to cardiac decompensation and suggest a potential therapeutic avenue against heart failure.

Keywords: EC coupling; Jph2; RBFox2; heart failure; miR-34a.


Conflict of interest statement

The authors declare no conflict of interest.

Figures

Fig. 1.
Fig. 1.
T-tubules and SR (TT-SR) disorganization in RBFox2 KO mice. (A) Double staining for DHPR (green) and RYR2 (red) on isolated wild-type (WT) and RBFox2−/− (KO) cardiomyocytes from 9 wk-old mice. (Scale bar, 10 μM.) (B) Power spectrum (Top) retrieved from two-dimensional fast Fourier transformation (FFT) of images in A. The first peak at the spatial frequency of ∼0.6 μm−1 corresponds to the ∼2 μm interval of the T-tubule in WT cardiomyocytes. The second and third harmonic peaks observable in WT were absent in KO mice. Statistics of the FFT first peak power (Bottom) at two different postnatal ages; n = 27 for WT at week 6; n = 30 for KO at week 6; n = 21 for WT at week 9; n = 22 for KO at week 9, **P < 0.01. (C) Disrupted ultrastructure of the contractile apparatus in WT and RBFox2−/− cardiomyocytes detected by TEM. Green arrowheads, Z line; red arrowheads, TT-SR junctions. (Scale bar, 200 nM.) (D) Statistics of the Z-line width (Left) and the number of TT-SR junctions (Right) were quantified from randomly selected TEM images; n = 81 from 3 WT hearts, n = 109 from 3 KO hearts, **P < 0.01.
Fig. 2.
Fig. 2.
Contraction defects linked to JPH2 down-regulation in both global and conditional RBFox2 KO mice. (A) Diagram of a T-tubule, highlighting JPH2 in connecting TT-SR. NCX, a Na+/Ca2+ exchange channel on the plasma membrane (PM); MF, myofilaments; SERCA, a Ca2+ pump on the surface of SR; RyR2, Ryanodine receptor 2 for Ca2+ release from the SR; DHPR, a voltage-dependent L-type calcium channel at the T-tubule. (B) Western blotting analysis of key proteins involved in EC coupling at three different postnatal ages and comparison between WT and global RBFox2 KO cardiomyocytes. (C) Statistics of RT-qPCR analysis of gene expression of the genes described in B; for Jph2 mRNA, n = 7 at each time point, ns, not significant; for Serca2a mRNA, n = 3 at each time point, *P < 0.05. (D) Semiquantitative RT-PCR analysis of Jph2 splicing in WT and global RBFox2 KO cardiomyocytes from 9 wk-old mice. The gene structure and the locations of primer pairs are indicated on top of the agarose gel. 5U, 5′UTR; M, 1 kb DNA ladder marker; E1, exon 1; E2, exon 2; E3, exon 3; E4, exon 4; E5, exon 5. (E) Western blotting analysis of JPH2 expression in control and tamoxifen (TMX)-induced RBFox2 KO hearts (Top). GAPDH served as loading control. Relative fold changes in JPH2 protein levels (Bottom) were normalized to GAPDH and quantified; n = 3 hearts for each group, *P < 0.05, ns, not significant. (F) Left ventricle M-mode echocardiodiagram imaging (Left) and quantification of EF (Right Top) and FS (Right Bottom) at the baseline or 2 wk after TMX induction; n = 11 for each group, **P < 0.01.
Fig. 3.
Fig. 3.
JPH2 down-regulation by induced miR-34a. (A) Heat map of the relative expression of 160 miRNAs determined by RT-qPCR in global RBFox2 KO cardiomyocytes relative to WT at week 5, 9, and 18. The data were sorted based on the mean value of miRNA levels at three different ages with those that showed >1.75-fold changes as highlighted on the right (red for increased expression; blue for decreased expression). (B) Ago2 binding events in the 3′UTR of mouse Jph2. The predicted miR-34a target regions are highlighted in the dashed boxes. The Bottom shows the predicted base pairing in the seed region between miR-34a and its target site and the mutations introduced in the seed regions. The first predicted miR-34a targeting site near the 5′ end is conversed between mouse and human JPH2 genes, but the second near the 3′ end is unique to mouse Jph2. (C and D) The luciferase assays of the reporters containing the full-length mouse Jph2 3′UTR (C) or human JPH2 3′UTR (D) in response to miR-34a overexpression with or without mutations in the miR-34a seed target regions; n = 9 for each group, *P < 0.05, **P < 0.01.
Fig. 4.
Fig. 4.
Contraction defects in miR-34a mimic-transduced WT mice. (A) Scheme for miR-34a mimic administration and echocardiographic analysis at different day points. (B) Quantitative analysis of miR-34 expression in control and miR-34 mimic-transduced mice; n = 3 for each group, *P < 0.05. (C and D) Representative M-mode echocardiograph (C) and quantification (D) of EF (Top) and FS (Bottom) at the baseline, day 7, 10, and 14 after miR-34a mimic administration; n = 6 in each group, *P < 0.05. (E) Western blotting analysis of JPH2 (Top) in the control and miR-34a mimic administrated WT hearts. Relative fold changes in JPH2 protein levels (Bottom) were normalized to loading control GAPDH and quantified; n = 3 hearts, **P < 0.01, ns, not significant. (F and G) Representative M-mode echocardiograph (F) and quantification (G) of EF (Top) and FS (Bottom) at the baseline, day 4 and 6 after the control or miR-34a antagomir administration in WT mice; n = 4 in each group, ns, not significant. (H) Western blotting analysis of JPH2 expression in the heart (Top) in the control and miR-34a antagomir administrated WT mice. Shown is one of two independent experiments. Relative fold changes in JPH2 protein levels (Top) were normalized to loading control GAPDH and quantified (Bottom); n = 4 for each sample, *P < 0.01, ns, not significant.
Fig. 5.
Fig. 5.
Functional rescue of RBFox2 ablation-induced heart failure with miR-34a antagomir. (A and B) RT-qPCR analysis of miR-34a expression (A), and the expression of the heart failure marker Anf (B) in the control and miR-34a antagomir administrated groups in the WT control or RBFox2-cKO hearts; n = 3 for each group except n = 4 for RBFox2-cKO/miR-34a antagomir, *P < 0.05, **P < 0.01. (C) Scheme for miR-34a antagomir administration and echocardiographic analysis (Top) and quantification of EF and FS at the baseline, day 4 and 6 postantagormir administration in control or RBFox2-cKO mice (Bottom); n = 4 for the control/mock; n = 3 for RBFox2-cKO/mock; n = 4 for RBFox2-cKO/miR-34a antagomir, *P < 0.05, **P < 0.01. (D) TEM images of WT or RBFox2-cKO cardiomyocytes treated with the control (Top) or the miR34a antagomir (Bottom). The enlarged white box highlights the TT-SR junction. (Scale bar, 1 μM.) (E and F) Statistics of Z-line width (E) and number of TT-SR junctions (F) were quantified from TEM images captured randomly for each specimen; for the Z line, n = 216 for the control/mock; n = 240 for the control/miR-34a antagomir; n = 181 for the RBFox2-cKO/mock; n = 206 for RBFox2-cKO/miR-34a antagomir; for the TT-SR junction, n = 12 for the control/mock; n = 10 for the control/miR-34a antagomir; n = 8 for the RBFox2-cKO/mock; n = 8 for the RBFox2-cKO/miR-34a antagomir, *P < 0.05, **P < 0.01.

References

    1. Lakatta EG. Age-associated cardiovascular changes in health: Impact on cardiovascular disease in older persons. Heart Fail Rev. 2002;7:29–49. - PubMed
    1. Burchfield JS, Xie M, Hill JA. Pathological ventricular remodeling: Mechanisms: Part 1 of 2. Circulation. 2013;128:388–400. - PMC - PubMed
    1. Diwan A, Dorn GW., 2nd Decompensation of cardiac hypertrophy: Cellular mechanisms and novel therapeutic targets. Physiology (Bethesda) 2007;22:56–64. - PubMed
    1. Small EM, Olson EN. Pervasive roles of microRNAs in cardiovascular biology. Nature. 2011;469:336–342. - PMC - PubMed
    1. de Lucia C, et al. microRNA in cardiovascular aging and age-related cardiovascular diseases. Front Med (Lausanne) 2017;4:74. - PMC - PubMed

Publication types