Thermostability of the Foot-and-Mouth Disease Virus Capsid Is Modulated by Lethal and Viability-Restoring Compensatory Amino Acid Substitutions
- PMID: 30867300
- PMCID: PMC6498042
- DOI: 10.1128/JVI.02293-18
Thermostability of the Foot-and-Mouth Disease Virus Capsid Is Modulated by Lethal and Viability-Restoring Compensatory Amino Acid Substitutions
Abstract
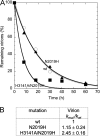
Infection by viruses depends on a balance between capsid stability and dynamics. This study investigated biologically and biotechnologically relevant aspects of the relationship in foot-and-mouth disease virus (FMDV) between capsid structure and thermostability and between thermostability and infectivity. In the FMDV capsid, a substantial number of amino acid side chains at the interfaces between pentameric subunits are charged at neutral pH. Here a mutational analysis revealed that the essential role for virus infection of most of the 8 tested charged groups is not related to substantial changes in capsid protein expression or processing or in capsid assembly or stability against a thermally induced dissociation into pentamers. However, the positively charged side chains of R2018 and H3141, located at the interpentamer interfaces close to the capsid 2-fold symmetry axes, were found to be critical both for virus infectivity and for keeping the capsid in a state of weak thermostability. A charge-restoring substitution (N2019H) that was repeatedly fixed during amplification of viral genomes carrying deleterious mutations reverted both the lethal and capsid-stabilizing effects of the substitution H3141A, leading to a double mutant virus with close to normal infectivity and thermolability. H3141A and other thermostabilizing substitutions had no detectable effect on capsid resistance to acid-induced dissociation into pentamers. The results suggest that FMDV infectivity requires limited local stability around the 2-fold axes at the interpentamer interfaces of the capsid. The implications for the mechanism of genome uncoating in FMDV and the development of thermostabilized vaccines against foot-and-mouth disease are discussed.IMPORTANCE This study provides novel insights into the little-known structural determinants of the balance between thermal stability and instability in the capsid of foot-and-mouth disease virus and into the relationship between capsid stability and virus infectivity. The results provide new guidelines for the development of thermostabilized empty capsid-based recombinant vaccines against foot-and-mouth disease, one of the economically most important animal diseases worldwide.
Keywords: capsid; foot-and-mouth disease virus; protein engineering; thermal stability; vaccine.
Copyright © 2019 American Society for Microbiology.
Figures




Similar articles
-
The pH Stability of Foot-and-Mouth Disease Virus Particles Is Modulated by Residues Located at the Pentameric Interface and in the N Terminus of VP1.J Virol. 2015 May;89(10):5633-42. doi: 10.1128/JVI.03358-14. Epub 2015 Mar 11. J Virol. 2015. PMID: 25762735 Free PMC article.
-
The pH stability of foot-and-mouth disease virus.Virol J. 2017 Nov 28;14(1):233. doi: 10.1186/s12985-017-0897-z. Virol J. 2017. PMID: 29183342 Free PMC article. Review.
-
Different functional sensitivity to mutation at intersubunit interfaces involved in consecutive stages of foot-and-mouth disease virus assembly.J Gen Virol. 2015 Sep;96(9):2595-2606. doi: 10.1099/vir.0.000187. Epub 2015 May 15. J Gen Virol. 2015. PMID: 25979732
-
A single amino acid substitution in the capsid of foot-and-mouth disease virus can increase acid lability and confer resistance to acid-dependent uncoating inhibition.J Virol. 2010 Mar;84(6):2902-12. doi: 10.1128/JVI.02311-09. Epub 2010 Jan 6. J Virol. 2010. PMID: 20053737 Free PMC article.
-
Cell Culture Adaptive Amino Acid Substitutions in FMDV Structural Proteins: A Key Mechanism for Altered Receptor Tropism.Viruses. 2024 Mar 27;16(4):512. doi: 10.3390/v16040512. Viruses. 2024. PMID: 38675855 Free PMC article. Review.
Cited by
-
Virulence and Immune Evasion Strategies of FMDV: Implications for Vaccine Design.Vaccines (Basel). 2024 Sep 19;12(9):1071. doi: 10.3390/vaccines12091071. Vaccines (Basel). 2024. PMID: 39340101 Free PMC article. Review.
-
Development of a Potent Stabilizer for Long-Term Storage of Foot-and-Mouth Disease Vaccine Antigens.Vaccines (Basel). 2021 Mar 12;9(3):252. doi: 10.3390/vaccines9030252. Vaccines (Basel). 2021. PMID: 33809252 Free PMC article.
-
Calcium Chloride as a Novel Stabilizer for Foot-and-Mouth Disease Virus and Its Application in the Vaccine Formulation.Vaccines (Basel). 2024 Mar 29;12(4):367. doi: 10.3390/vaccines12040367. Vaccines (Basel). 2024. PMID: 38675749 Free PMC article.
-
A Heat-Induced Mutation on VP1 of Foot-and-Mouth Disease Virus Serotype O Enhanced Capsid Stability and Immunogenicity.J Virol. 2021 Jul 26;95(16):e0017721. doi: 10.1128/JVI.00177-21. Epub 2021 Jul 26. J Virol. 2021. PMID: 34011545 Free PMC article.
-
Possible Action of Transition Divalent Metal Ions at the Inter-Pentameric Interface of Inactivated Foot-and-Mouth Disease Virus Provide A Simple but Effective Approach to Enhance Stability.J Virol. 2021 Mar 10;95(7):e02431-20. doi: 10.1128/JVI.02431-20. Epub 2021 Jan 13. J Virol. 2021. PMID: 33441340 Free PMC article.
References
-
- Bothner B, Hilmer JK. 2011. Probing viral capsids in solution, p 41–61. In Agbandje-McKenna M, McKenna R(ed), Structural virology. RSC Publishing, Cambridge, United Kingdom.
-
- Mateu MG. 2017. The foot-and-mouth disease virion: structure and function, p 61–105. In Sobrino F, Domingo E(ed), Foot-and-mouth disease virus. Caister Academic Press, Norfolk, United Kingdom.

