. 2019 May 15;93(11):e00354-19.
doi: 10.1128/JVI.00354-19. Print 2019 Jun 1.

Sequencing Framework for the Sensitive Detection and Precise Mapping of Defective Interfering Particle-Associated Deletions across Influenza A and B Viruses

Affiliations

Sequencing Framework for the Sensitive Detection and Precise Mapping of Defective Interfering Particle-Associated Deletions across Influenza A and B Viruses

Fadi G Alnaji et al. J Virol. .

Abstract

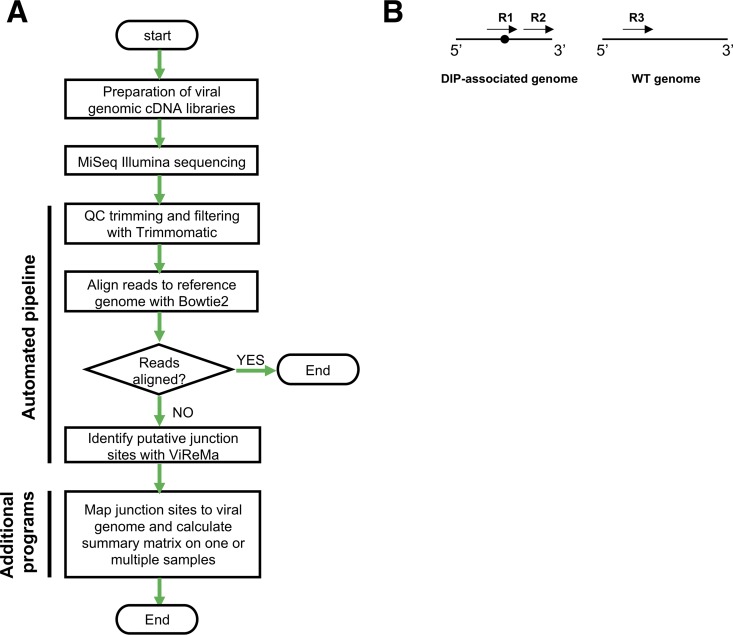
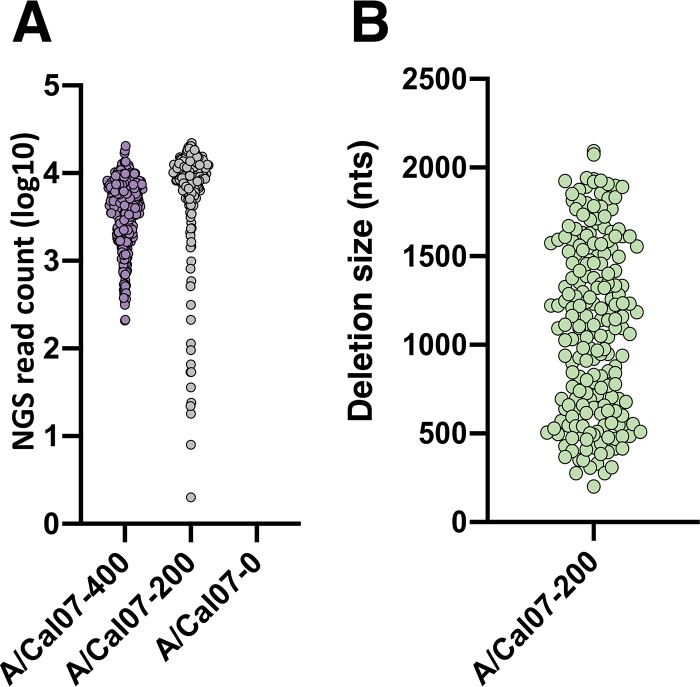
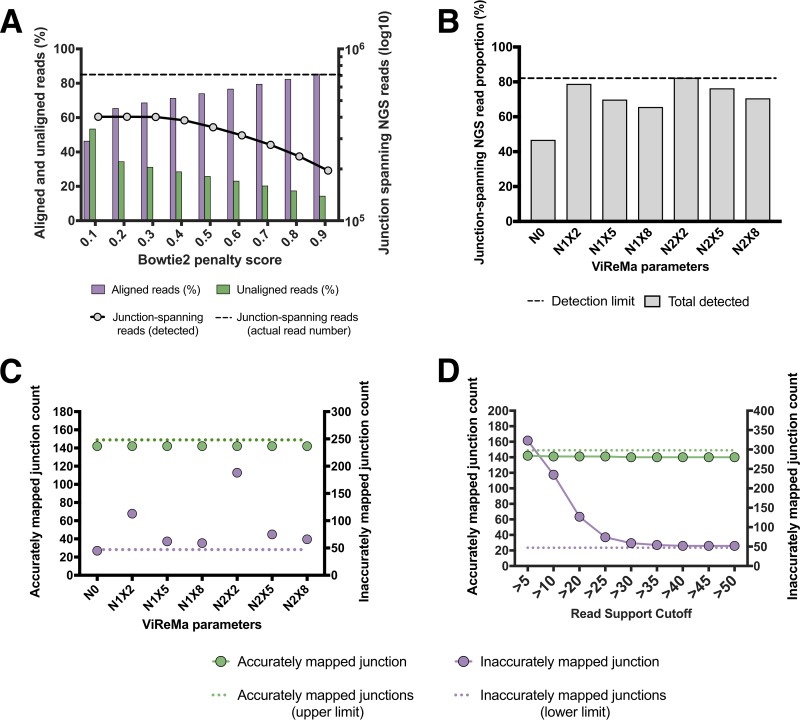
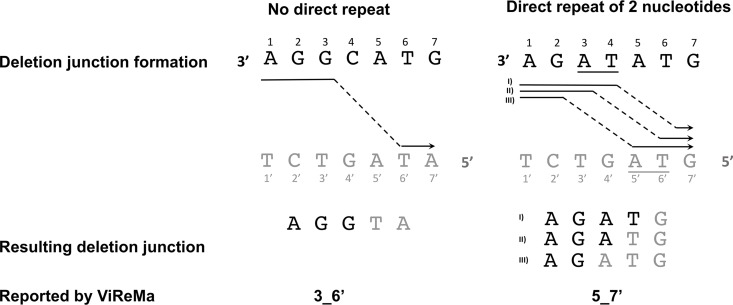
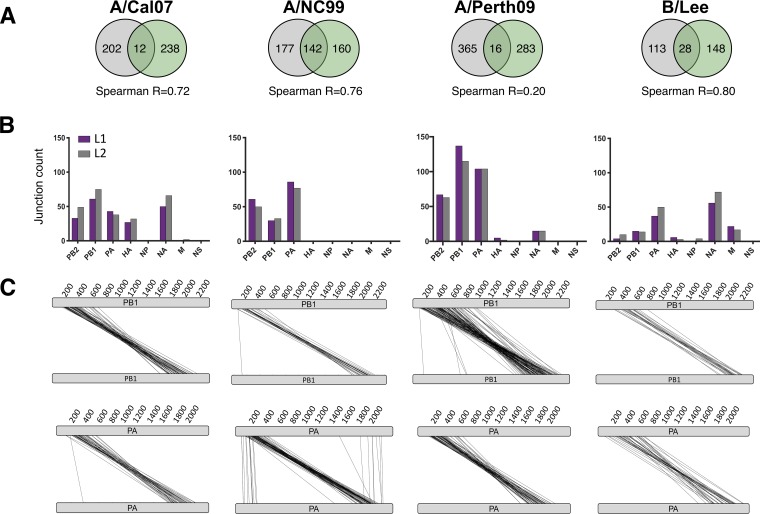
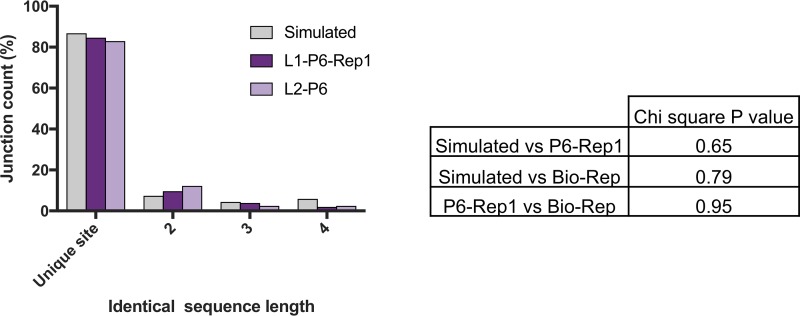
The mechanisms and consequences of defective interfering particle (DIP) formation during influenza virus infection remain poorly understood. The development of next-generation sequencing (NGS) technologies has made it possible to identify large numbers of DIP-associated sequences, providing a powerful tool to better understand their biological relevance. However, NGS approaches pose numerous technical challenges, including the precise identification and mapping of deletion junctions in the presence of frequent mutation and base-calling errors, and the potential for numerous experimental and computational artifacts. Here, we detail an Illumina-based sequencing framework and bioinformatics pipeline capable of generating highly accurate and reproducible profiles of DIP-associated junction sequences. We use a combination of simulated and experimental control data sets to optimize pipeline performance and demonstrate the absence of significant artifacts. Finally, we use this optimized pipeline to reveal how the patterns of DIP-associated junction formation differ between different strains and subtypes of influenza A and B viruses and to demonstrate how these data can provide insight into mechanisms of DIP formation. Overall, this work provides a detailed roadmap for high-resolution profiling and analysis of DIP-associated sequences within influenza virus populations.IMPORTANCE Influenza virus defective interfering particles (DIPs) that harbor internal deletions within their genomes occur naturally during infection in humans and during cell culture. They have been hypothesized to influence the pathogenicity of the virus; however, their specific function remains elusive. The accurate detection of DIP-associated deletion junctions is crucial for understanding DIP biology but is complicated by an array of technical issues that can bias or confound results. Here, we demonstrate a combined experimental and computational framework for detecting DIP-associated deletion junctions using next-generation sequencing (NGS). We detail how to validate pipeline performance and provide the bioinformatics pipeline for groups interested in using it. Using this optimized pipeline, we detect hundreds of distinct deletion junctions generated during infection with a diverse panel of influenza viruses and use these data to test a long-standing hypothesis concerning the molecular details of DIP formation.

Keywords: defective interfering particles; influenza; next-generation sequencing.


Figures

FIG 1
FIG 1
Overview of sequencing/bioinformatics framework. (A) Flowchart outlining the steps of the sequencing pipeline. QC, quality control. (B) Simple depiction of the possible types of NGS reads in relation to a deletion junction within a sample. Arrows represent individual NGS reads, and the black circle denotes the location of a deletion junction. R1, reads derived from a deletion-containing sequence that span the deletion junction; R2, reads derived from a deletion-containing sequence that do not span the deletion junction; R3, reads derived from sequences that do not contain deletions.
FIG 2
FIG 2
Simulated data set features. (A) Read support numbers for the individual deletion junctions in the indicated data sets. (B) The deletion sizes of all junctions in the A/Cal07-200 data set. In A and B, each dot represents a unique junction.
FIG 3
FIG 3
Optimization of bioinformatics pipeline using simulated data. (A) Quantification of the effects of various Bowtie 2 penalty scores on the number of junction spanning reads detected by ViReMa in the A/Cal07-400 simulated data set (dashed line represents the actual number of junction-spanning reads present in the data set). The percentages of reads that aligned to reference genome (purple) and failed to align (green) are also shown for each penalty score. (B) The effects of ViReMa –X and –N parameters on the percentage of junction-spanning reads present in the simulated data set that were successfully detected. The dashed line shows the maximum theoretical sensitivity (∼81.5%) based on the ViReMa seed length of 25 nt. (C) The effects of ViReMa –X and –N parameters on the number of accurately (green) and inaccurately mapped (purple) deletion junctions reported by the pipeline using the A/Cal07-200 simulated data set. The maximum possible number of accurate junctions and the minimum number of inaccurate junctions (resulting from junctions adjacent to direct repeat sequences) are shown for comparison. (D) Effects of various minimum read support cutoffs (RSCs) on junction detection. Analysis performed on the A/Cal07-200 simulated data set using N1X8 ViReMa values.
FIG 4
FIG 4
Illustration of a “fuzzy” junction caused by an adjacent direct repeat. The black letters represent the sequence where the polymerase detaches (donor site), and the gray letters represent the sequence where polymerase reinitiates (acceptor site). The arrows represent the actual path of the polymerase, and the underlined letters denote the direct repeat sequence. The resulting DIP-associated sequences are represented by the black and gray letters to highlight the donor and acceptor sites, respectively. The junction sites reported by ViReMa are at the bottom and use the following nomenclature: DonorSite_AcceptorSite. Note that ViReMa was adjusted to push the junction site toward the 3′ site of the direct repeat. The left side illustrates a situation where no direct repeats are present and, as a result, ViReMa reports the correct junction. On the right, a situation where a direct repeat of 2 nucleotides is present, resulting in ambiguity. In this case, ViReMa pushes the junction toward the 3′ end of the repeat and incorrectly reports the junction as 5 to 7′ (5_7′). Shown are three possible paths for the polymerase that yield different junction locations with the same sequence. In all cases, the junction will be reported as 5_7′.
FIG 5
FIG 5
Reverse transcription is not a significant source of deletions. We performed two independent RNA extractions, RT reactions, PCR amplifications, and library preparations from a single recombinant A/Cal07 working stock grown at a low MOI (Par1 and Par2). Gray blocks represent deletions with nonzero read support that fell below our read support cutoff (RSC), and white blocks denote deletions that were not detected. (A) Comparison of deletion junctions detected in Par1 and Par2 samples. (B) Comparison of HA segment junctions detected in two libraries generated from independent RT reactions using two different RT enzymes, along with a library generated from in vitro T7-transcribed viral RNA.
FIG 6
FIG 6
Generation of DIP-rich populations through high-MOI passage. A/Cal07 was serially passaged 6 times (P1 to P6) in MDCK cells at a sustained high MOI. (A) PCR products from the indicated A/Cal07 populations following 8-segment whole-genome amplification, visualized on a 1% agarose gel. The accumulation of deletion junctions is reflected by the disappearance of the polymerase segments (∼2.3 kb) and the appearance of a smear below the NS segment (∼0.9 kb) ranging from ∼0.3 to 0.8 kb. (B) Coverage depth of aligned reads from the indicated passages for PB2 and NS genome segments. The coverage was normalized against the read coverage of the parental sample (Par1). (C) Fold increase in the number of deletion junctions (left y axis) and total read support for those junctions (right y axis) over the parental sample (Par1).
FIG 7
FIG 7
Determination of optimal read support cutoffs for experimental data. Plots showing the numbers of deletion junctions (left y axis) reported in the indicated genome segments for two technical replicates (L1-P6-Rep1 and L1-P6-Rep2) across various RSC values. Black dots represent the results of Spearman correlation tests between the replicates at each RSC condition (right y axis). Blue dots indicate the point with the highest degree of correlation and minimum decrease in junction count for each genome segment.
FIG 8
FIG 8
Effects of viral template input on the detection of DIP-associated junctions. We serially diluted RNA or cDNA generated from the L1-P6-Rep1 sample and compared sequencing results between libraries generated with these dilutions as the templates. (A) Serial dilutions (1:3 to 1:15) was carried out on either the RNA or cDNA of the L1-P6-Rep1 sample, and a correlation test between the detected DIP-associated junctions was performed. (B) For each dilution, the total number of detected junctions (purple) is shown, along with the number of specific junctions that were also detected in the undiluted sample (gray). The copy number of viral cDNA molecules included in downstream PCR and library preparation for each dilution was determined by RT-qPCR (green; right y axis). GE, gene equivalent. (C) Read support values for all deletion junctions common across the diluted (at the cDNA level) and undiluted samples were normalized to the total number of deletion junction-spanning reads for each sample and used to perform a Spearman correlation between all pairs of samples using the R cor function.
FIG 9
FIG 9
Identification of DIP-associated junctions in different influenza types, subtypes, and strains following high-MOI passage. Each virus was serially passaged in MDCK cells at a high MOI in two independent, parallel lineages (L1 and L2). The earliest passages that showed high accumulation of DIPs (based on gel analysis shown in Fig. S6A) were picked for NGS. (A) Venn diagrams showing the numbers of shared versus unique DIP-associated junctions between the two passage lineages for each virus. (B) The numbers of distinct junctions detected within each genome segment for both passage lineages of the indicated viruses. (C) Parallel coordinate diagrams showing the specific locations of deletion junctions found in the PB1 and PA segments of lineage 1 of the indicated viruses. Each individual junction is represented by a black line that connects the donor and acceptor sites of the breakpoint. Data in panels A to C are all placed below the relevant virus strain labels at the top of the figure.
FIG 10
FIG 10
Direct repeat sequences are not overrepresented at DIP-associated deletion junctions. The percentages of deletion junctions within the polymerase segments that occurred at unique sites or at sites with direct nucleotide repeats 2 to 4 nt in length were compared between L1-P6-Rep1, L2-P6 (passage 6 from two independent lineages), and the A/Cal07-200 simulated data set. The number of junctions was plotted and compared by chi square. The table shows the chi-square P values between every possible pair of the samples.

References

    1. Von Magnus P. 1954. Incomplete forms of influenza virus. Adv Virus Res 2:59–79. doi:10.1016/S0065-3527(08)60529-1. - DOI - PubMed
    1. von Magnus P. 1951. Propagation of the PR8 strain of influenza A virus in chick embryos. II. The formation of incomplete virus following inoculation of large doses of seed virus. Acta Pathol Microbiol Scand 28:278–293. - PubMed
    1. Rezelj VV, Levi LI, Vignuzzi M. 2018. The defective component of viral populations. Curr Opin Virol 33:74–80. doi:10.1016/j.coviro.2018.07.014. - DOI - PubMed
    1. Baum A, Sachidanandam R, García-Sastre A. 2010. Preference of RIG-I for short viral RNA molecules in infected cells revealed by next-generation sequencing. Proc Natl Acad Sci U S A 107:16303–16308. doi:10.1073/pnas.1005077107. - DOI - PMC - PubMed
    1. Nayak DP, Chambers TM, Akkina RK. 1985. Defective-interfering (DI) RNAs of influenza viruses: origin, structure, expression, and interference. Curr Top Microbiol Immunol 114:103–151. - PubMed

Publication types

MeSH terms

LinkOut - more resources