. 2019 May 15;93(11):e00015-19.
doi: 10.1128/JVI.00015-19. Print 2019 Jun 1.

The Infectious Bronchitis Coronavirus Envelope Protein Alters Golgi pH To Protect the Spike Protein and Promote the Release of Infectious Virus

Affiliations

The Infectious Bronchitis Coronavirus Envelope Protein Alters Golgi pH To Protect the Spike Protein and Promote the Release of Infectious Virus

Jason W Westerbeck et al. J Virol. .

Abstract

Coronaviruses (CoVs) assemble by budding into the lumen of the early Golgi complex prior to exocytosis. The small CoV envelope (E) protein plays roles in assembly, virion release, and pathogenesis. CoV E has a single hydrophobic domain (HD), is targeted to Golgi membranes, and has cation channel activity in vitro The E protein from avian infectious bronchitis virus (IBV) has dramatic effects on the secretory system, which require residues in the HD. Mutation of the HD of IBV E in a recombinant virus background results in impaired growth kinetics, impaired release of infectious virions, accumulation of IBV spike (S) protein on the plasma membrane compared to wild-type (WT) IBV-infected cells, and aberrant cleavage of IBV S on virions. We previously reported the formation of two distinct oligomeric pools of IBV E in transfected and infected cells. Disruption of the secretory pathway by IBV E correlates with a form that is likely monomeric, suggesting that the effects on the secretory pathway are independent of E ion channel activity. Here, we present evidence suggesting that the monomeric form of IBV E correlates with an increased Golgi luminal pH. Infection with IBV or expression of IBV E induces neutralization of Golgi pH, promoting a model in which IBV E alters the secretory pathway through interaction with host cell factors, protecting IBV S from premature cleavage and leading to the efficient release of infectious virus from the cells. This is the first demonstration of a coronavirus-induced alteration in the microenvironment of the secretory pathway.IMPORTANCE Coronaviruses are important human pathogens with significant zoonotic potential. Progress has been made toward identifying potential vaccine candidates for highly pathogenic human CoVs, including the use of attenuated viruses that lack the CoV E protein or express E mutants. However, no approved vaccines or antiviral therapeutics exist. Understanding the role of the CoV E protein in virus assembly and release is thus an important prerequisite for potential vaccines as well as in identifying novel antiviral therapeutics.

Keywords: E protein; Golgi; coronavirus; oligomers; pH; viroporin.


Figures

FIG 1
FIG 1
The IBV S protein is aberrantly processed in virions from IBV EG3-infected cells. (A) Cartoon of IBV Beaudette S showing the cleavage sites. The signal sequence (ss), fusion peptide (FP), and transmembrane domain (TMD) are indicated. (B) Representative blot of virions purified from the supernatants of WT IBV- or IBV EG3-infected Vero cells by concentration through a sucrose cushion. Pellets were electrophoresed on NuPAGE 4-to-12% gradient gels and after transfer to PVDF membranes were probed with mouse anti-S1 and rabbit anti-S2, followed by IRDye 800CW donkey anti-mouse IgG and IRDye 680CW donkey anti-rabbit IgG. The left panel is a merge of the 800-nm and 680-nm wavelengths of the Li-Cor image showing that S1 and S2 essentially comigrate on these gradient gels. The middle and right panels show the signal for the S1-specific mouse monoclonal 3C7B8 and the rabbit anti-S C terminus antibodies (Ab), respectively. The cleavage products are indicated, as are the positions of the molecular weight markers (in kilodaltons). (C) Quantification showing the fraction of total S for each S1 fragment (top graph) or S2 fragment (bottom graph). Error bars indicate standard deviations (SD) (n = 4 [S2 antibody] or 3 [S1 antibody]). A paired t test was performed in GraphPad Prism, with a P value of <0.05 (*) where indicated. All other pairs were not statistically significant.
FIG 2
FIG 2
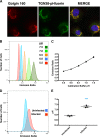
IBV infection alters Golgi pH. (A) Vero cells stably expressing pHluorin-TGN38 were evaluated by indirect immunofluorescence microscopy. Cells were labeled with rabbit anti-golgin-160 and mouse anti-GFP, followed by Alexa 546-conjugated anti-rabbit IgG and Alexa 488-conjugated anti-mouse IgG. (B) Vero cells stably expressing pHluorin-TGN38 were used to assess the pH of the trans-Golgi network by determining the ratio of the pH-sensitive dual-emission spectrum by flow cytometry. The cells were in buffers of known pH and contained ionophores to equilibrate the extracellular and luminal pH of the Golgi membrane. Data from a representative flow cytometry experiment are graphed. (C) Calibration curves were generated from data like those illustrated in panel B, in order to calculate the pH of cells infected with IBV or uninfected cells. The calibration curve pictured was derived from data from 3 independent experiments (∼10,000 cells each). Error bars indicate standard errors of the means (SEM). (D) Cell emission ratios for Vero cells infected or mock infected with IBV and stably expressing pHluorin-TGN38 from a representative experiment. (E) Average calculated pH values from 3 independent experiments (∼10,000 cells each). Unpaired t tests were performed in Prism at 99% confidence, with an assumption of equal variance. ***, P < 0.001. Error bars indicate SEM.
FIG 3
FIG 3
Overexpression of IBV E alters Golgi pH. (A) The trans-Golgi pH in HeLa cells transiently expressing pHluorin-TGN38 was assessed by determining the ratio of the pH-sensitive dual-emission spectrum by flow cytometry. The cells were in buffers of known pH and contained ionophores to equilibrate the extracellular and luminal pH of the Golgi membrane. Data from a representative flow cytometry experiment are graphed. (B) Calibration curves were generated from data like those illustrated in panel A, in order to calculate the pH of cells expressing pHluorin-TGN38 alone or in combination with IBV E or E mutants. The calibration curve pictured was derived from data from 7 independent experiments (∼5,000 cells each). Error bars indicate SEM. (C) Cell emission ratios for HeLa cells expressing pHluorin-TGN38 alone and with IBV E or IBV M (control) from a representative experiment. (D) Average calculated pH values from 3 independent experiments (∼5,000 cells each). Unpaired t tests were performed in Prism at 99% confidence, with an assumption of equal variance. *, P < 0.05; ***, P < 0.001. Error bars indicate SEM.
FIG 4
FIG 4
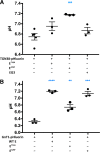
Change in Golgi pH correlates with the LMW HD mutant of IBV E. (A) HeLa cells transiently expressing pHluorin-TGN38 alone or with IBV E or HD mutants were evaluated by flow cytometry, and the average calculated pH values from 3 independent experiments are graphed (∼5,000 cells each). (B) HeLa cells transiently expressing medial-Golgi-tagged pHluorin, GnT1-pHluorin, with IBV E or HD mutants were evaluated by flow cytometry, and the average calculated pH values from 3 independent experiments are graphed (∼5,000 cells each). Unpaired t tests were performed in Prism at 99% confidence, with an assumption of equal variance. **, P < 0.01; ***, P < 0.001; ****, P < 0.0001. Error bars indicate SEM.
FIG 5
FIG 5
Influenza A virus M2 alters Golgi pH and reduces IBV S at the surface of EG3-expressing cells. (A) Vero cells expressing pHluorin-TGN38 and M2 were evaluated by indirect immunofluorescence microscopy. Cells were labeled with rabbit anti-GFP and mouse anti-M2, followed by Alexa 488-conjugated anti-rabbit IgG and Alexa 546-conjugated anti-mouse IgG, and Hoechst stain. Some M2 is present in the Golgi region. (B) Vero cells transiently expressing pHluorin-TGN38 with or without transient expression of IAV M2 and with or without treatment with amantadine (5 μM) were evaluated by flow cytometry. The calculated pH values from a single independent experiment are graphed (∼5,000 cells each). (C) Representative blot from Vero cells expressing IBV S with either WT IBV E or EG3, along with either the empty vector or IAV M2, after surface biotinylation. Biotinylated proteins were isolated with streptavidin-agarose beads from lysates. Both the input (IN) (10%) and surface fractions (100%) were subjected to Western blot analysis with rabbit anti-IBV SCT followed by IRDye 680CW donkey anti-rabbit IgG. The positions of the IBV S2 species are indicated, as are the molecular weight markers in kilodaltons. (D) Quantification of the total IBV S at the cell surface from 3 experiments. The low percentage of surface S is likely due to inefficient biotinylation. One-way analysis of variance (ANOVA) was performed with GraphPad Prism. *, P < 0.05 compared to WT E plus the vector. Error bars indicate SD.
FIG 6
FIG 6
Expression of IAV M2 corrects aberrant processing of IBV S. (A) Representative blot from Vero cells expressing IBV S with either WT IBV E or EG3, along with either the empty vector or IAV M2, showing the S2-containing fragments and the positions of the molecular weight markers (in kilodaltons). Expression levels of E and EG3 were similar by blotting, as were those of M2 in the relevant samples (not shown). (B) Quantification of data from 7 experiments indicating the fraction of each S2 form. Error bars indicate SD. (C) Representative blot from Vero cells expressing IBV S alone or with WT IBV E, IBV ET16A, or IBV EA26F, along with either the empty vector or IAV M2, showing the S2-containing fragments and the positions of the molecular weight markers (in kilodaltons). The far-right lane is a sample from cells transfected with the vector alone to indicate the background with the anti-SCT antibody. (D) Quantification of data from 3 experiments indicating the fraction of each S2 form. For both graphs, unpaired t tests were performed with GraphPad Prism between the empty vector and IAV M2-expressing samples for each set (NS, not significant; *, P < 0.05; **, P < 0.01; ***, P < 0.005), with colors representing the relevant P value.

Similar articles

Cited by

References

    1. Menachery VD, Graham RL, Baric RS. 2017. Jumping species—a mechanism for coronavirus persistence and survival. Curr Opin Virol 23:1–7. doi:10.1016/j.coviro.2017.01.002. - DOI - PMC - PubMed
    1. Channappanavar R, Zhao J, Perlman S. 2014. T cell-mediated immune response to respiratory coronaviruses. Immunol Res 59:118–128. doi:10.1007/s12026-014-8534-z. - DOI - PMC - PubMed
    1. Hogue BG, Machamer CE. 2008. Coronavirus structural proteins and virus assembly, p 179–200. In Perlman S, Gallagher T, Snijder EJ(ed), Nidoviruses. ASM Press, Washington, DC.
    1. Weisz OA. 2003. Acidification and protein traffic. Int Rev Cytol 226:259–319. doi:10.1016/S0074-7696(03)01005-2. - DOI - PubMed
    1. Sakaguchi T, Leser GP, Lamb RA. 1996. The ion channel activity of the influenza virus M2 protein affects transport through the Golgi apparatus. J Cell Biol 133:733–747. doi:10.1083/jcb.133.4.733. - DOI - PMC - PubMed

Publication types

MeSH terms

Substances

LinkOut - more resources