Review
. 2019 Mar 13;11(483):eaau6753.
doi: 10.1126/scitranslmed.aau6753.

"Inactive" ingredients in oral medications

Affiliations
Review

"Inactive" ingredients in oral medications

Daniel Reker et al. Sci Transl Med. .

Abstract

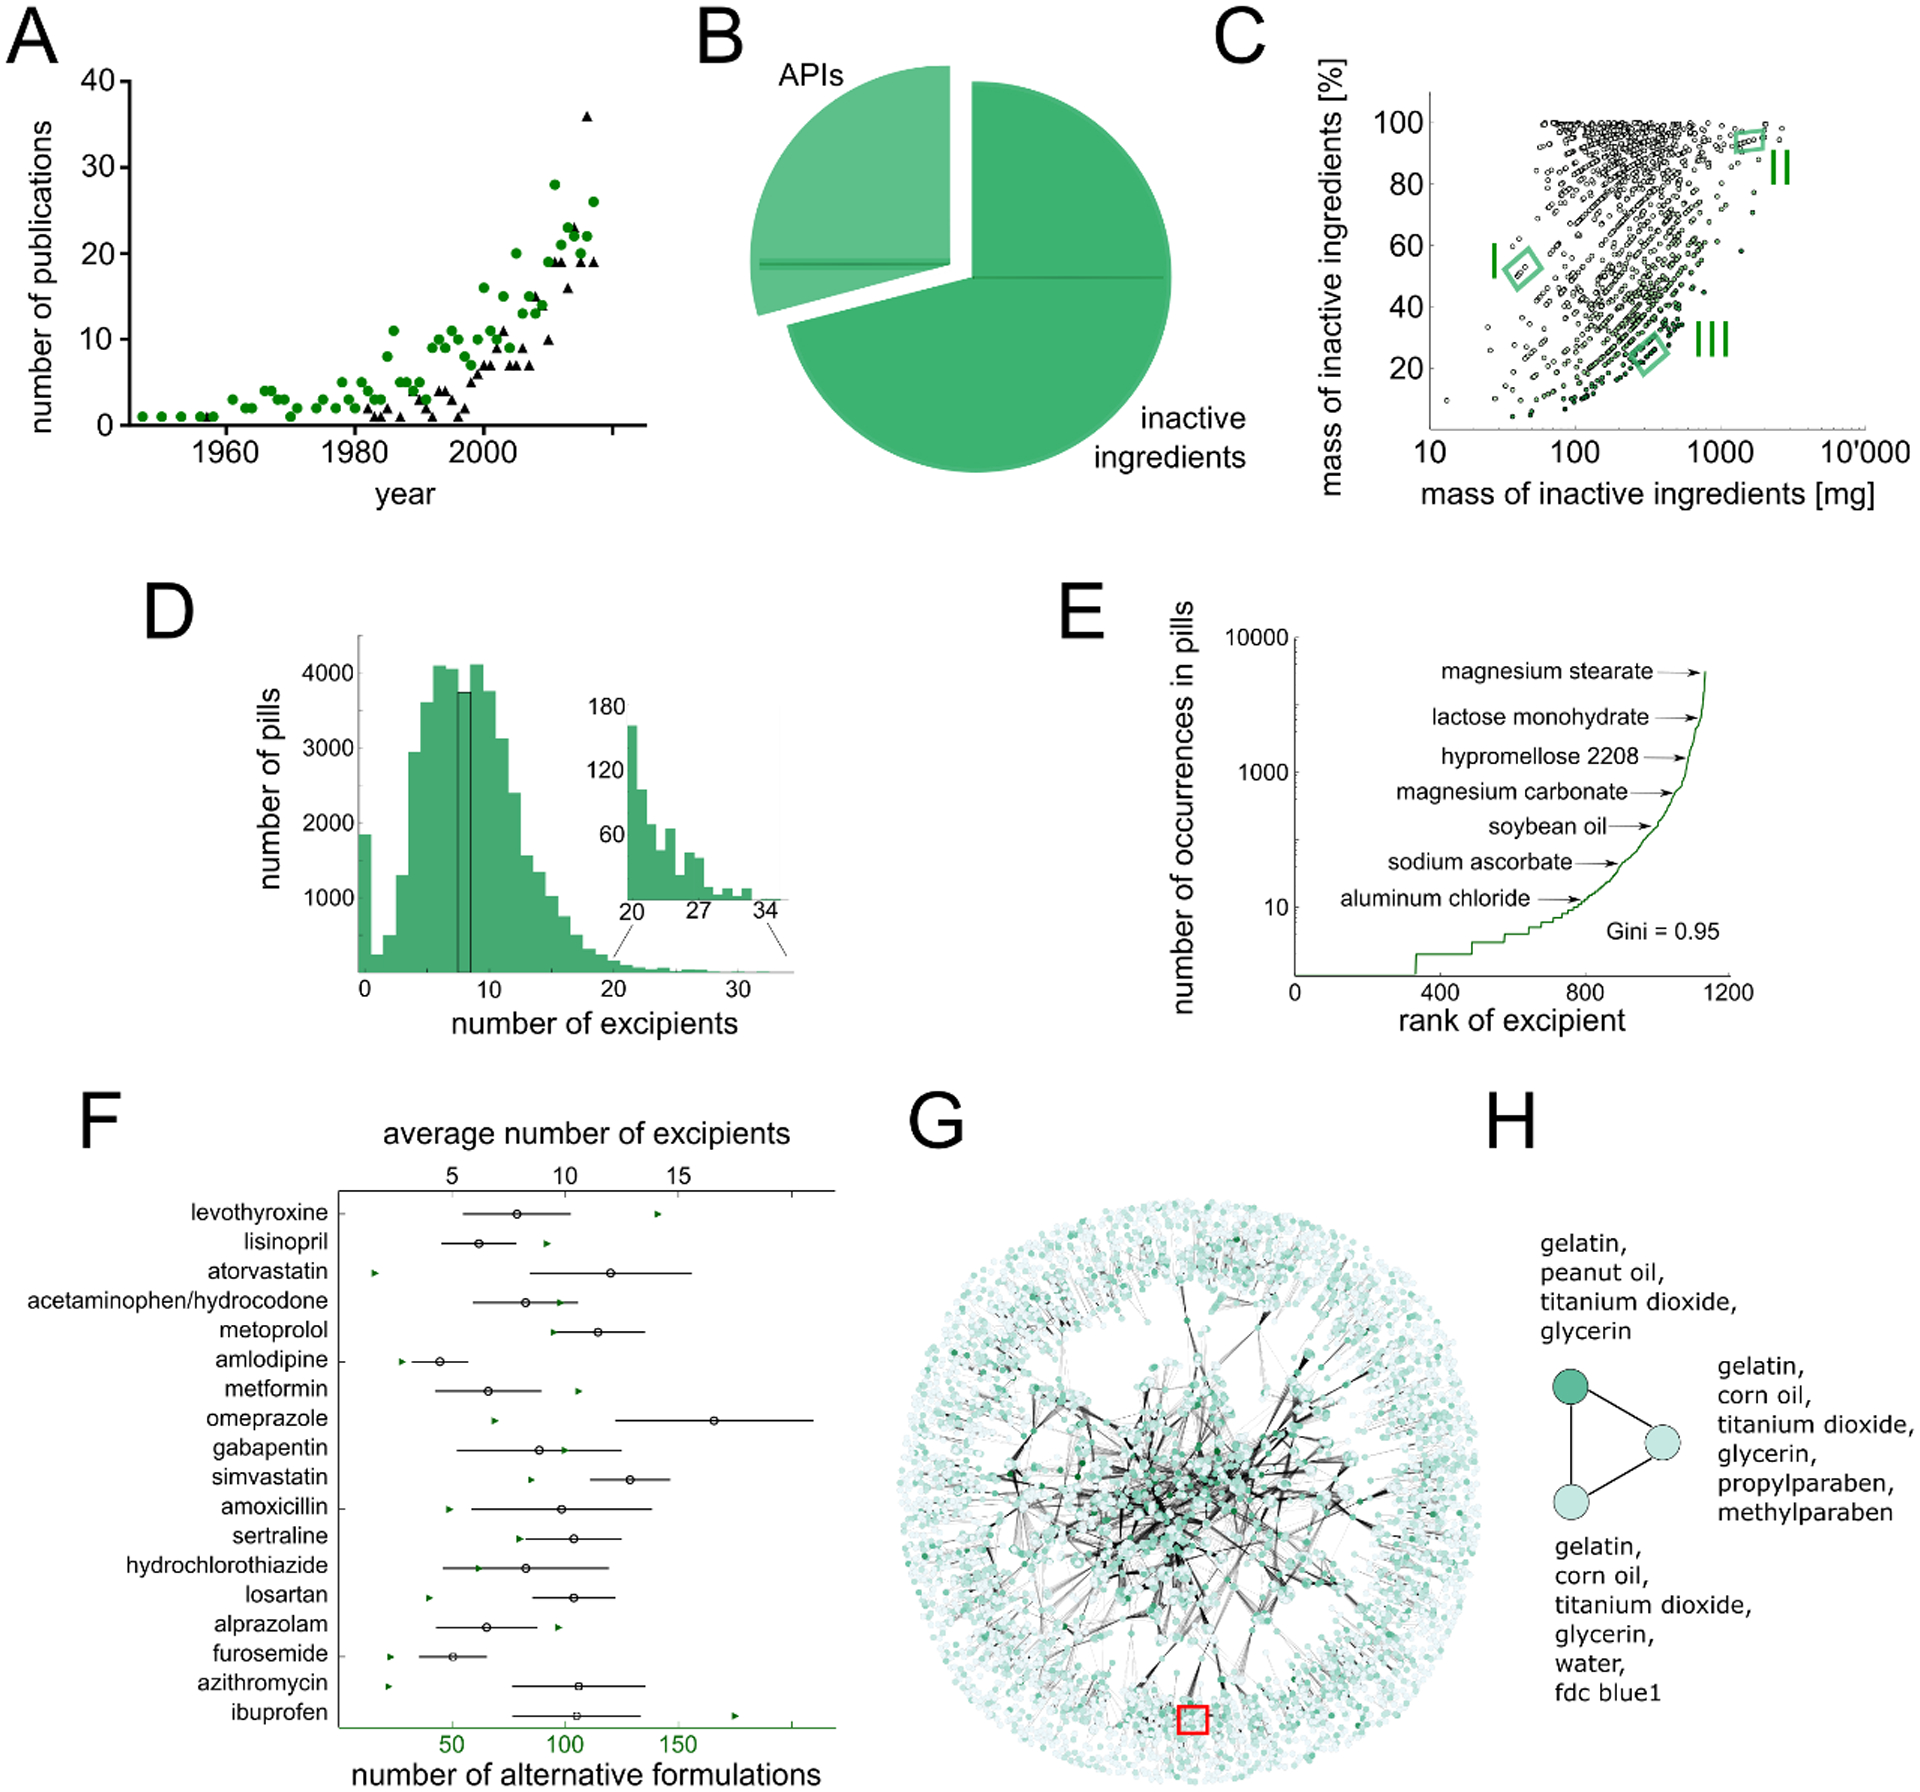
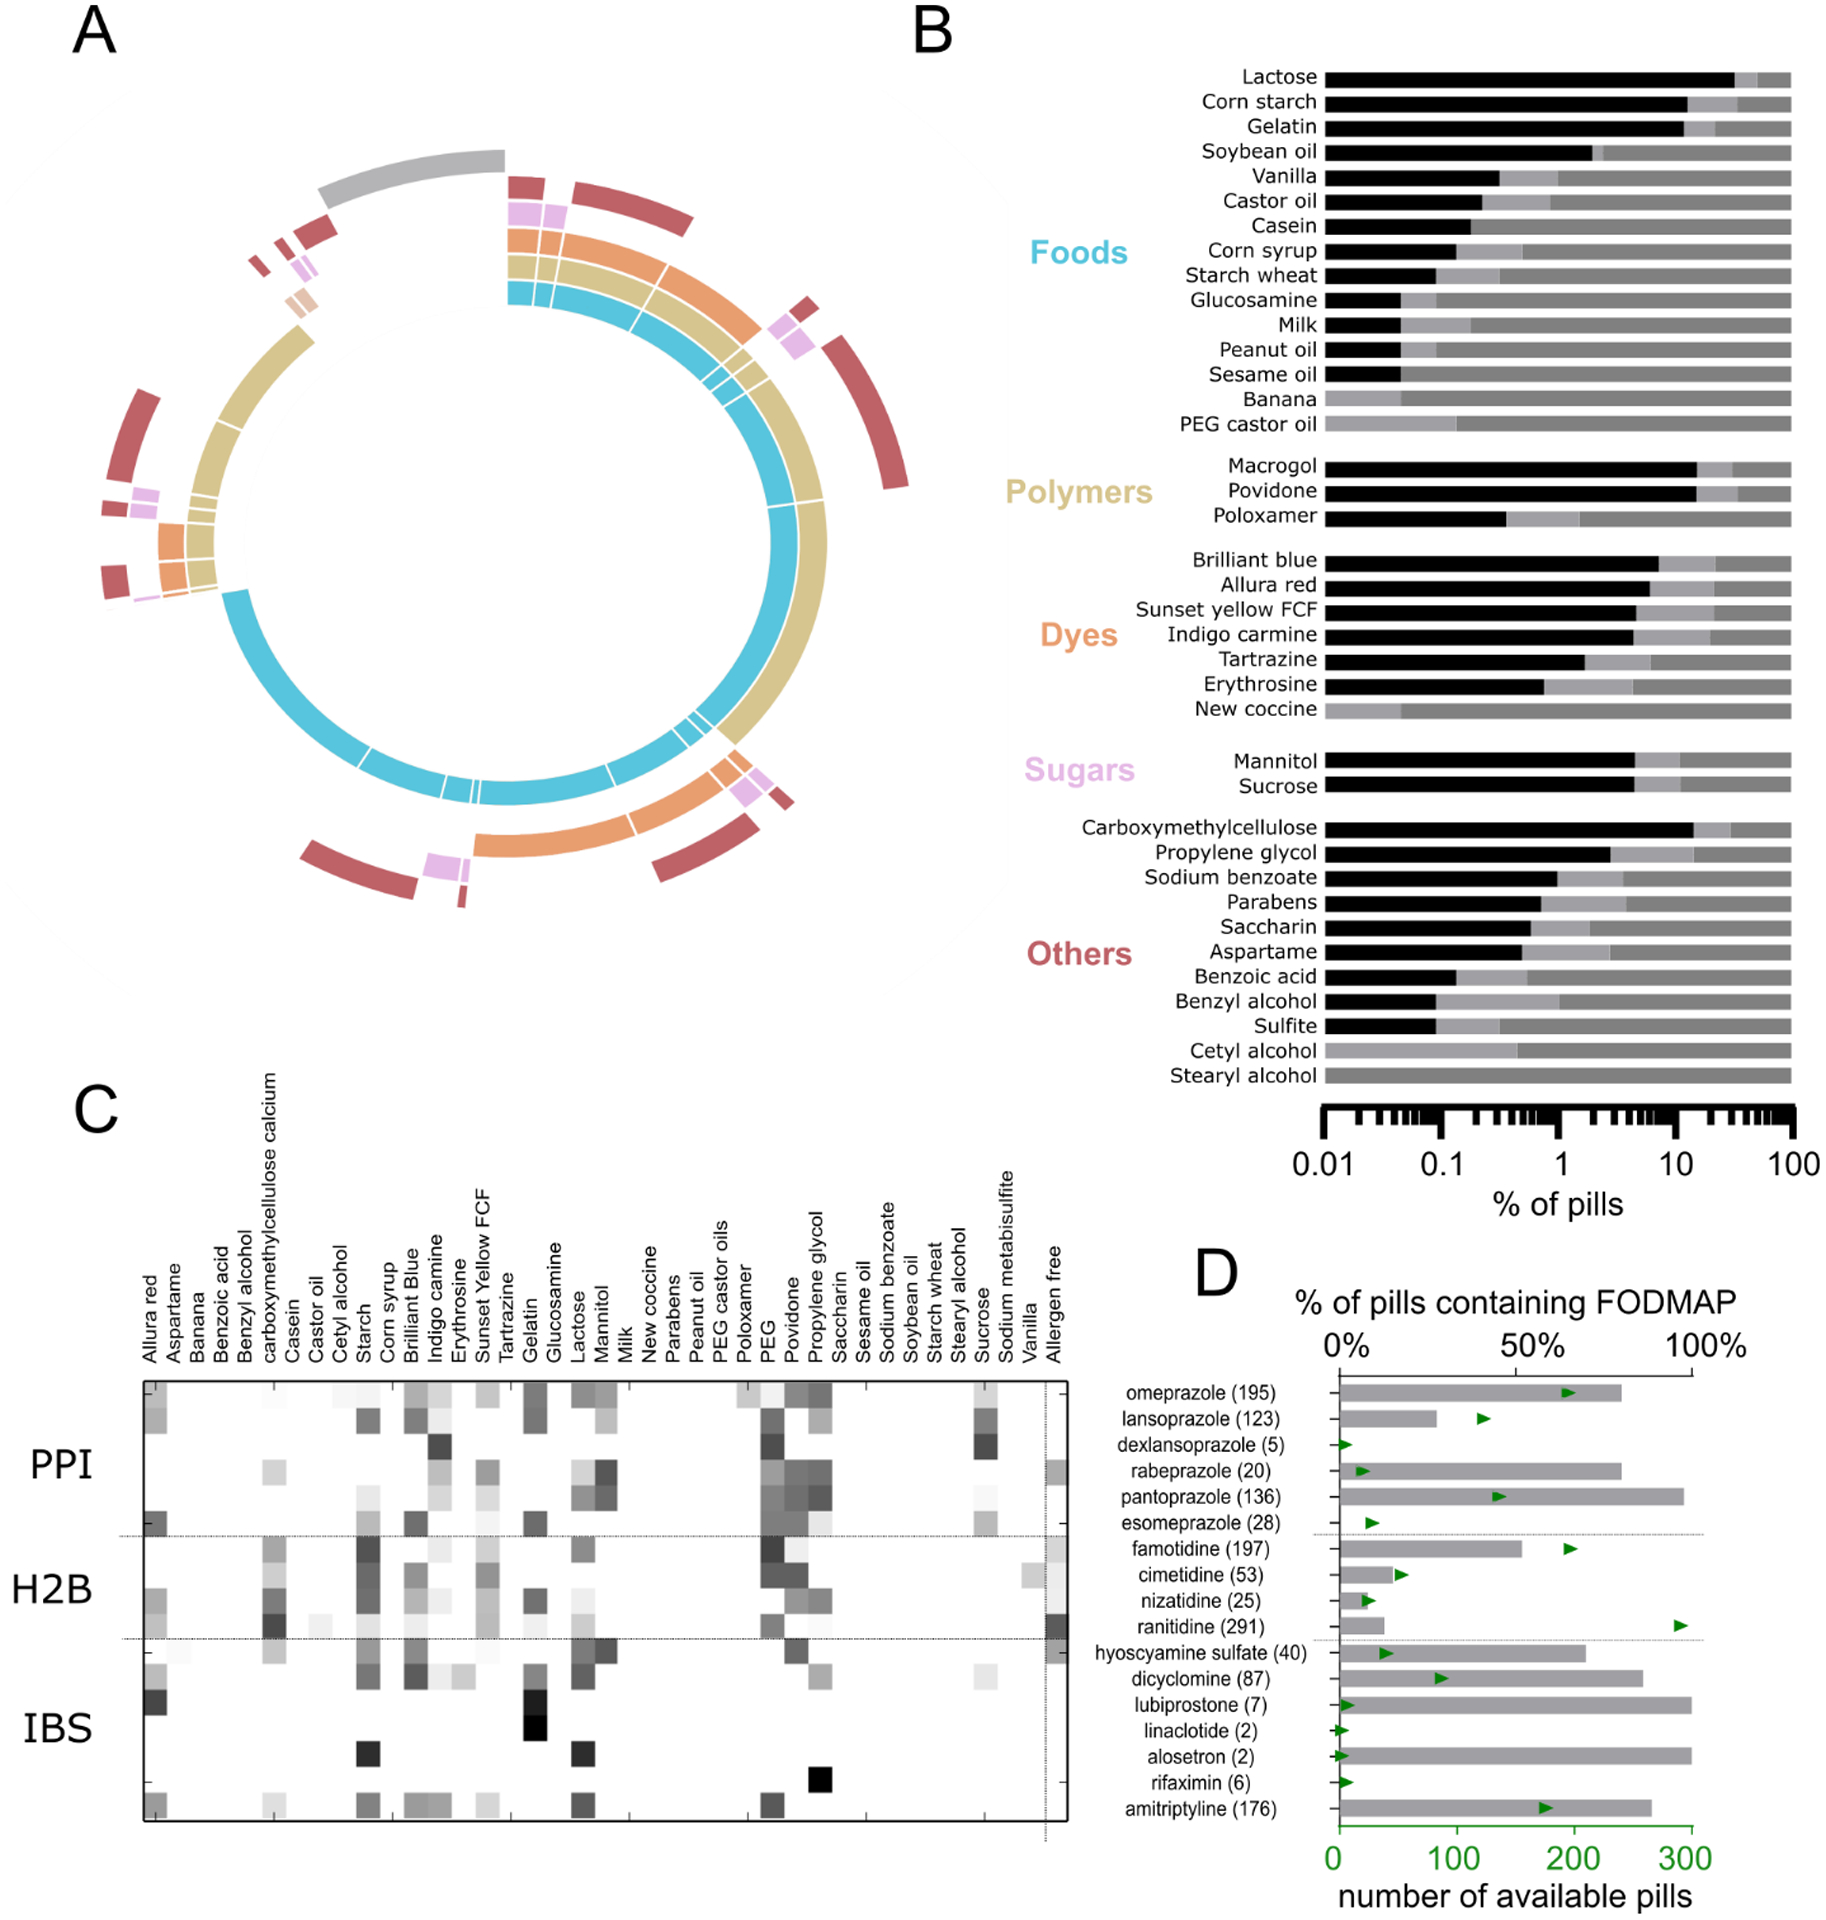
Oral forms of medications contain "inactive" ingredients to enhance their physical properties. Using data analytics, we characterized the abundance and complexity of inactive ingredients in approved medications. A majority of medications contain ingredients that could cause adverse reactions, underscoring the need to maximize the tolerability and safety of medications and their inactive ingredients.


Conflict of interest statement

Competing interests: Complete details of all relationships for profit and not for profit for G.T. can be found at the following link: https://www.dropbox.com/sh/szi7vnr4a2ajb56/AABs5N5i0q9AfT1IqIJAE-T5a?dl=0. SB has a consulting relationship with Two River Consulting and is an equity holder in Kronos Bio, Inc.. D.R., S.B., G.T. are co-inventors on a provisional patent application 62/811,502 describing systems to quantify the burden of inactive ingredients in medications.

Figures

Fig. 1.
Fig. 1.. Active versus inactive ingredients and complexity of formulations.
(A) Number of publications in PubMed containing the search terms “excipient allergy” (green circles) or “excipient irritation” (black triangles) per year. (B) Percentage of the mass of a medication corresponding to inactive (dark green) versus active (light green) ingredients. (C) Correlation analysis between the mass and percentage of inactive ingredients in a given medication. Green shading denotes dose. Different formulations for the same API and dose are grouped together [e.g. valsartan 40 mg (I), cyclosporine 100 mg (II), and amoxicillin 1 g (III)]. (D) Distribution of inactive ingredients in oral solid dosage forms. The median (eight) is highlighted in black. Insert shows the distribution of 596 pills/capsules with 20 inactive ingredients or more. (E) Frequency of inactive ingredients. Gini coefficient = 0.95. (F) Formulation heterogeneity for the 18 most-prescribed single-agent oral medications during 2016 (14). Green triangles denote the number of different available formulations; the mean and standard deviation of the distribution of the number of inactive ingredients contained in these formulations are depicted by black circles and lines, respectively. (G) Formulation network highlighting complexity of formulation space. Each node corresponds to a specific combination of inactive ingredients; two nodes are connected when at least one API has been commercially formulated with each of these separate combinations of inactive ingredients. Node color corresponds to frequency of formulation usage, edge thickness corresponds to number of APIs that have been formulated with either of the two inactive ingredient combinations. Few clusters of inactive ingredients are exclusively applied to certain drugs (periphery), whereas other formulations are heavily applied to many different APIs and form a complex relationship (central region). The red box highlights region of valproic acid formulations. (H) Enlarged valproic acid region from (G). Network for three different combinations of inactive ingredients currently used to formulate valproic acid. Darker green indicates more frequent use.
Fig. 2.
Fig. 2.. ARAIIs in drugs.
(A) Pie chart depicting percentage of medications containing potential allergen classes (or excipients with the potential to be contaminated with allergens). Gray bar: % of medications without any potential allergens. Colors correspond with classes in (B). (B) Percentage of APIs with potential allergens. Black bar: all formulations of the API contain a specific allergy-associated inactive ingredient; dark gray: all formulations of the API are devoid of the allergen inactive ingredient; light gray: some formulations of the API contain the potential allergen. (C) Heatmap showing the ARAII content of different GI therapeutics, grouped by medication class. Numbers in parentheses indicate number of available formulations; PPI: proton pump inhibitor, H2B: Histamine 2 blockers, IBS: inflammatory bowel syndrome treatments.. (D) Analysis of FODMAP content in gastrointestinal therapeutics

Comment in

  • Hidden danger: maize starch excipient allergy.
    Lukose L, Seth S, Sud K, Nankivell B, Nicdao MA, Castelino RL. Lukose L, et al. Med J Aust. 2024 Mar 4;220(4):184-185. doi: 10.5694/mja2.52201. Epub 2024 Jan 5. Med J Aust. 2024. PMID: 38180266 No abstract available.

References

    1. Katdare A, Chaubal MV, Eds., Excipient Development for Pharmaceutical, Biotechnology, and Drug Delivery Systems (Informa Healthcare, 2006).
    1. Abrantes CG, Duarte D, Reis CP, An Overview of Pharmaceutical Excipients: Safe or Not Safe?, J. Pharm. Sci 105, 2019–2026 (2016). - PubMed
    1. Jensen MP, Karoly P, Handbook of Pharmaceutical Excipients – 7th Edition (The Pharmaceutical Press, 2013).
    1. Elder DP, Kuentz M, Pharmaceutical excipients — quality, regulatory and biopharmaceutical considerations, Eur. J. Pharm. Sci 87, 88–99 (2016). - PubMed
    1. Kelso JM, Potential food allergens in medications, J. Allergy Clin. Immunol 133, 1509–1520 (2014). - PubMed

Publication types