. 2019 May;180(1):435-452.
doi: 10.1104/pp.18.01322. Epub 2019 Mar 13.

Comparative Transcriptomic Analysis Provides Insight into the Domestication and Improvement of Pear (P. pyrifolia) Fruit

Affiliations

Comparative Transcriptomic Analysis Provides Insight into the Domestication and Improvement of Pear (P. pyrifolia) Fruit

Xiaolong Li et al. Plant Physiol. 2019 May.

Abstract

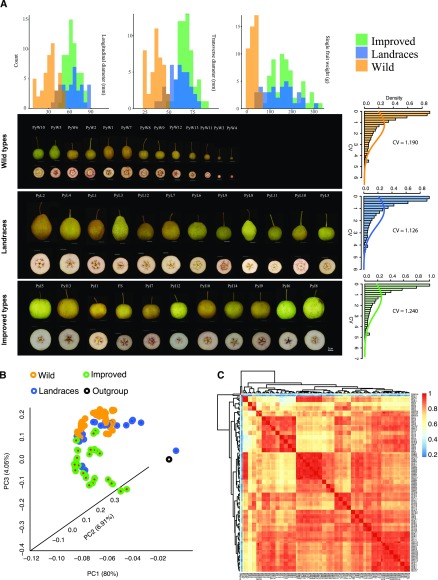
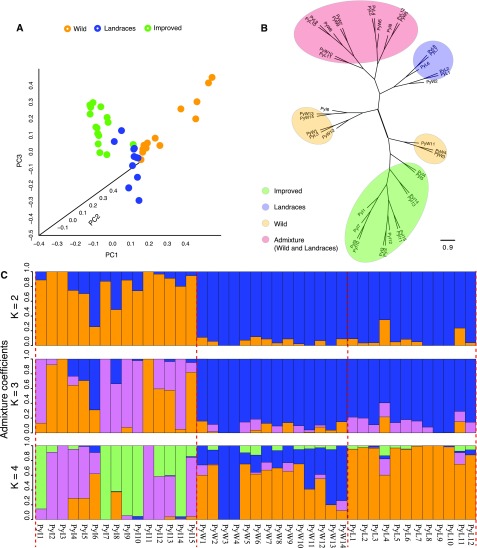
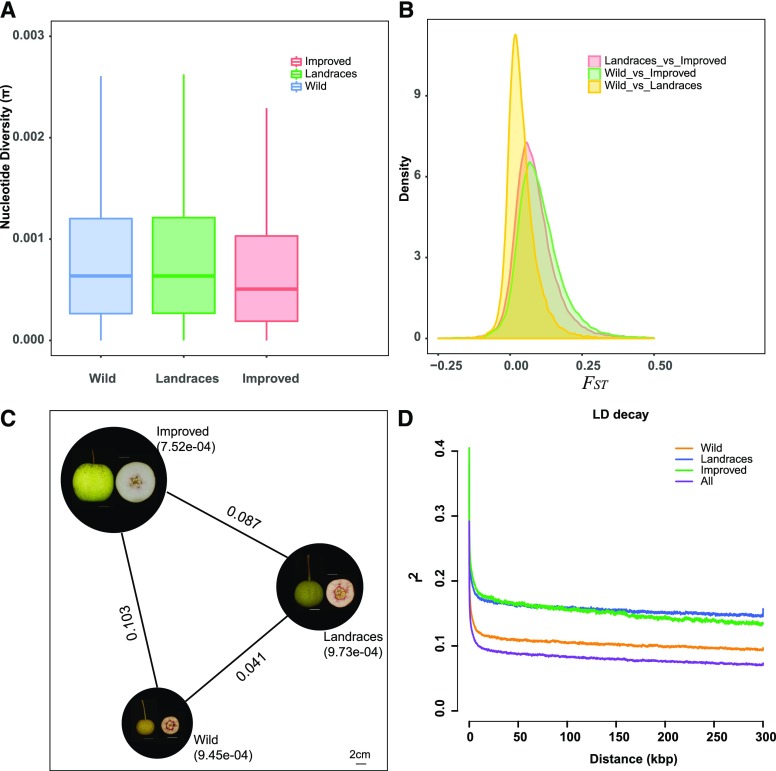
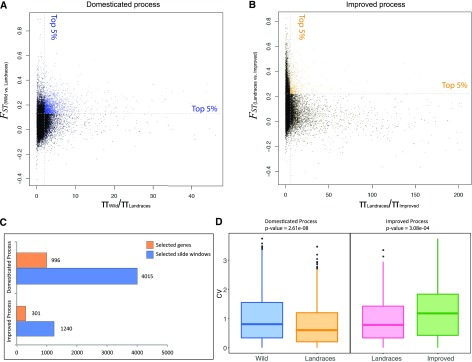
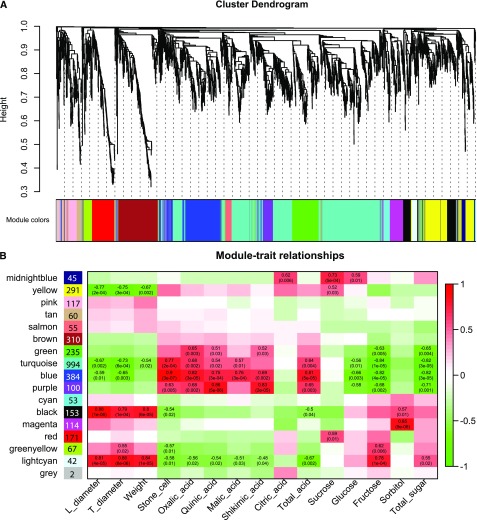
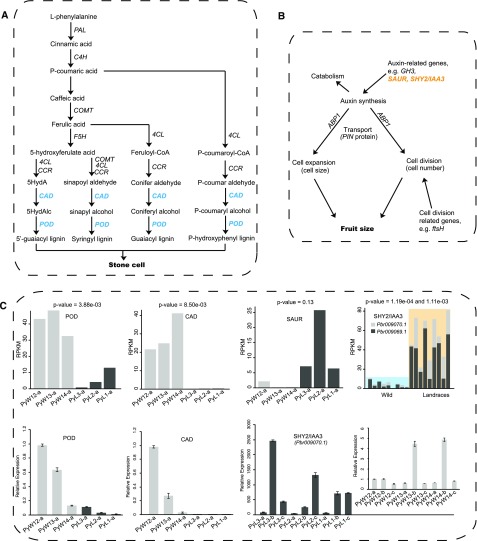
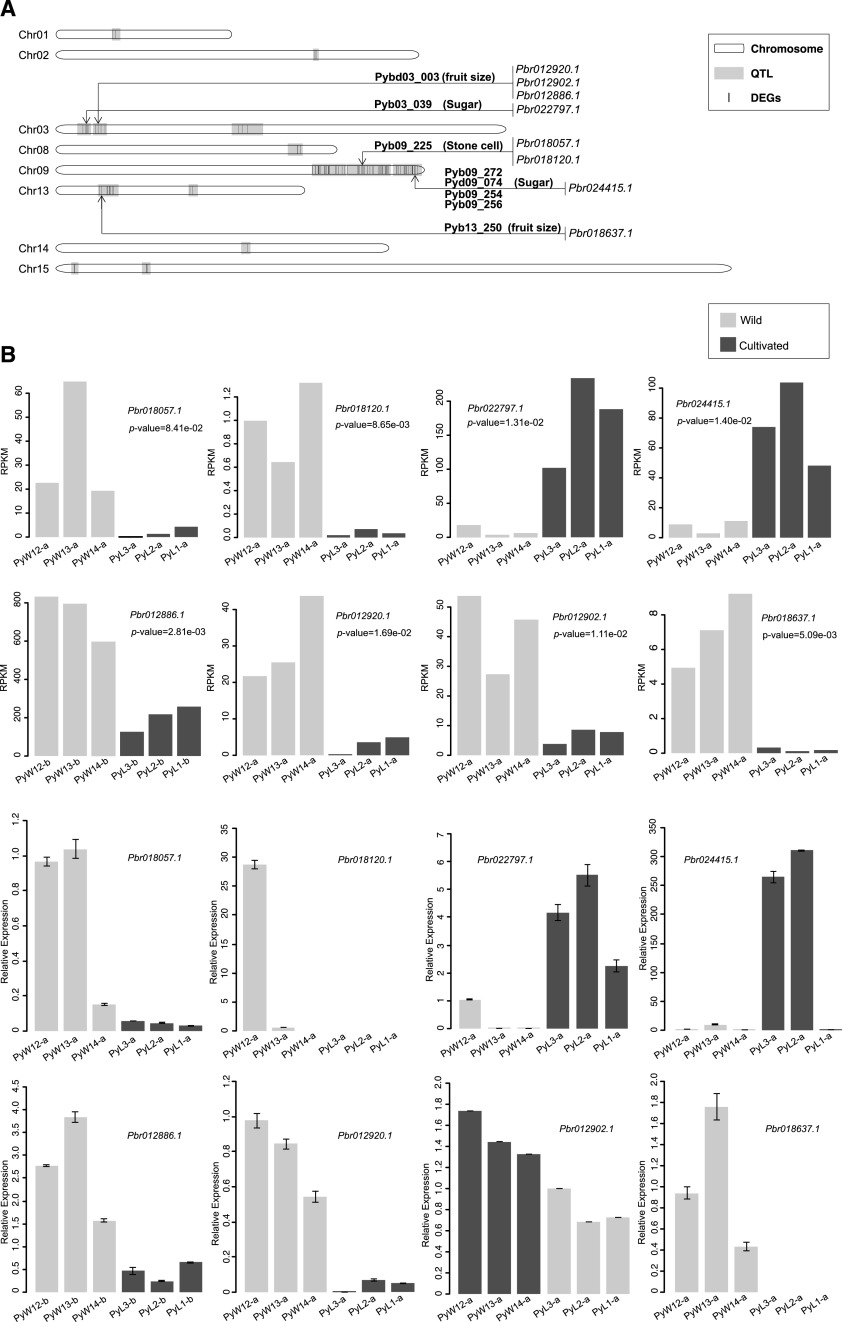
Knowledge of the genetic changes that occurred during the domestication and improvement of perennial trees at the RNA level is limited. Here, we used RNA sequencing analysis to compare representative sets of wild, landrace, and improved accessions of pear (Pyrus pyrifolia) to gain insight into the genetic changes associated with domestication and improvement. A close population relationship and similar nucleotide diversity was observed between the wild and landrace groups, whereas the improved group had substantially reduced nucleotide diversity. A total of 11.13 Mb of genome sequence was identified as bearing the signature of selective sweeps that occurred during pear domestication, whereas a distinct and smaller set of genomic regions (4.04 Mb) was identified as being associated with subsequent improvement efforts. The expression diversity of selected genes exhibited a 20.89% reduction from the wild group to the landrace group, but a 23.13% recovery was observed from the landrace to the improved group, showing a distinctly different pattern with variation of sequence diversity. Module-trait association analysis identified 16 distinct coexpression modules, six of which were highly associated with important fruit traits. The candidate trait-linked differentially expressed genes associated with stone cell formation, fruit size, and sugar content were identified in the selected regions, and many of these could also be mapped to the previously reported quantitative trait loci. Thus, our study reveals the specific pattern of domestication and improvement of perennial trees at the transcriptome level, and provides valuable genetic sources of fruit traits that could contribute to pear breeding and improvement.


Figures

Figure 1.
Figure 1.
The phenotype and expression pattern of all sequencing accessions. A, The phenotypic features of fruit and images of its transverse section with dyed stone cell from wild, landraces, and cultivated pear accessions. The fruits were digitally extracted for comparison. At top, the phenotypic distribution of longitudinal diameter, transverse diameter, and single fruit weight from three groups are presented. At right, the distribution of CV within each group is presented. B, The three-dimensional plot of PCA from all gene RPKMs of the 41 accessions. Orange points represent wild accessions; blue points represent landraces; green points represent improved accessions; black point represents the outgroup. C, The heatmap of PCCs from all 41 accessions. The color scale at the right represents PCC values. Red color represents the high correlation; blue represents the low correlation. The text on the right and bottom represent the sample names. Wild, wild type; PC, principal component.
Figure 2.
Figure 2.
The population relationship, clustering, and structure of 41 pear accessions from three groups inferred from SNPs. A, The three-dimensional plot of PCA using SNP data from all 41 pear accessions. Orange points represent wild accessions; blue points represent landraces; green points represent improved accessions. B, The phylogenetic tree based on SNP data. The light-green circle indicates the improved group; light blue indicates the landraces group; light yellow indicates the wild group; pink indicates the admixture of wild and landrace accessions. C, The population structure (K = 2–4) of all 41 pear accessions. Each bar represents an accession. PyW, PyL, and PyI indicate wild, landrace, and improved accessions, respectively. Wild, wild type; PC, principal component.
Figure 3.
Figure 3.
Nucleotide diversity, divergence, and LD within and between three groups. A, The boxplots of nucleotide diversity (π) within three groups. Blue indicates the wild group; green indicates the landraces group; red indicates the improved group. B, The distribution of divergence level measured using the FST value between the three groups. Yellow displays the distribution of FST between the wild and landrace group; red displays the distribution of FST between the landraces and improved group; green displays the distribution of FST between the wild and improved group. C, The average value of π and FST among the three pear groups. The fruits were digitally extracted for comparison. The values beside the line represent the average FST; the values in brackets represent the average π; three representative fruit phenotypes from wild, landraces, and improved groups are displayed in black circles. D, LD decay determined by correlation of allele frequencies (r2) against distance (kb) among polymorphic SNP sites in different pear groups, including wild (orange), landraces (blue), improved (green), and all 41 accessions (purple). Wild, wild type.
Figure 4.
Figure 4.
The identification of selective sweeps during pear domestication and improvement. A, The identification of selective sweeps during pear domestication. Each point represents a 10-kb slide window. Blue points represent the candidate selective sweeps. The x axis indicates the πWildLandraces ratio; y axis indicates the FST value. B, the identification of selective sweeps during pear improvement. Each point represents a 10-kb slide window. Orange points represent the candidate selective sweeps. The x axis indicates the πLandracesImproved ratio; y axis indicates the FST value. C, The number of selected slide window and genes during domestication and improvement. Blue bar represents the selected slide window; orange bar represents selected genes. D, the CV for selected genes in the domesticated and improved process. Wild, wild type.
Figure 5.
Figure 5.
WGCNA analyses. A, Clustering dendrogram of genes with dissimilarity based on topological overlap, with assigned module colors. Each tree branch constitutes a module, and each leaf in the branch is one gene. B, Module-trait associations. Each row corresponds to a module. The number of genes in each module is indicated on the left. Each column corresponds to a phenotypic trait, labeled below. Each cell at the row-column intersection contains the correlation coefficient (|r|<0.5 not shown) and the p-value (in brackets) between that module and that trait. A highly positive correlation between a specific module and a trait is indicated by dark red, and green indicates negative correlation. The gray module is reserved for genes outside of all modules.
Figure 6.
Figure 6.
The biosynthetic pathways of stone cell (A) and fruit size (B) and the expression patterns of genes related to these pathways (C) are shown. Blue text in (A) indicates genes down-regulated in cultivated pears relative to wild accessions at the small fruit stage. PAL, Phe ammonia lyase; C4H, transcinnamate 4-monooxygenase; COMT, caffeic acid 3-O-methyltransferase; F5H, ferulate-5-hydroxylase; 4CL, 4-coumarate-CoA ligase. Yellow text in (B) indicates genes up-regulated in cultivated pears at the small fruit stage or all developmental stages. ABP1, auxin binding protein 1; GH3, gretchen hagen 3; SAUR, small auxin up-regulated RNA. Top in (C) presents the RPKM values of the genes Pbr000691.1 (POD), Pbr041997.1 (CAD), Pbr023270.1 (SAUR), and Pbr009069.1 (SHY2/IAA3; black bar) and Pbr009070.1 (SHY2/IAA3; gray bar); bottom in (C) presents the relative expression levels of Pbr000691.1, Pbr041997.1, and Pbr009070.1. Data shown are the means ± sd from three replications. Wild, wild type.
Figure 7.
Figure 7.
Overlap mapping between DEGs and QTLs related to fruit traits in pear. A, The mapping of QTLs against DEGs. The light blue blocks indicate QTLs, and the inside black lines indicate DEGs. All chromosomes with QTLs are displayed. The arrows indicate the genes related to important traits; the text beside the horizontal line indicates the QTL name, and the text in the brackets indicates the trait controlled by that QTL. B, The expression levels of eight genes mapped to QTLs controlling stone cell content, sugar content, and fruit size between wild and cultivated pears at the small or enlarged fruit stage. The gray bar represents the wild pear accession, and the black bar represents the cultivated accession. Data shown are the means ± sd from three replications. Wild, wild type.

Similar articles

Cited by

References

    1. Andrews S. (2010) FastQC: A Quality Control Tool For High Throughput Sequence Data. http://www.bioinformatics.babraham.ac.uk/projects/fastqc/ (April 10, 2018)
    1. Audic S, Claverie J-M (1997) The significance of digital gene expression profiles. Genome Res 7: 986–995 - PubMed
    1. Bell RL, Quamme HA, Layne REC, Skirvin RM (1996) Pears. In Janick J and Moore JN, eds, Fruit breeding. John Wiley and Sons, New York, pp 441–514
    1. Bellucci E, Bitocchi E, Ferrarini A, Benazzo A, Biagetti E, Klie S, Minio A, Rau D, Rodriguez M, Panziera A, et al. (2014) Decreased nucleotide and expression diversity and modified coexpression patterns characterize domestication in the common bean. Plant Cell 26: 1901–1912 - PMC - PubMed
    1. Bitocchi E, Bellucci E, Giardini A, Rau D, Rodriguez M, Biagetti E, Santilocchi R, Spagnoletti Zeuli P, Gioia T, Logozzo G, et al. (2013) Molecular analysis of the parallel domestication of the common bean (Phaseolus vulgaris) in Mesoamerica and the Andes. New Phytol 197: 300–313 - PubMed

Publication types

LinkOut - more resources