. 2019 Mar 13;10(1):1200.
doi: 10.1038/s41467-019-09055-7.

Dietary fatty acids fine-tune Piezo1 mechanical response

Affiliations

Dietary fatty acids fine-tune Piezo1 mechanical response

Luis O Romero et al. Nat Commun. .

Abstract

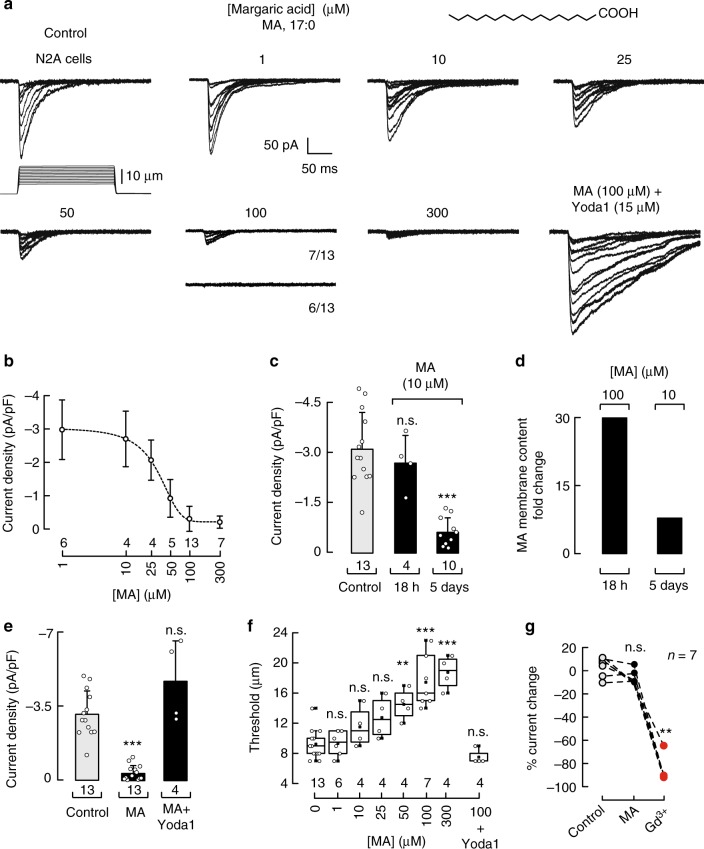
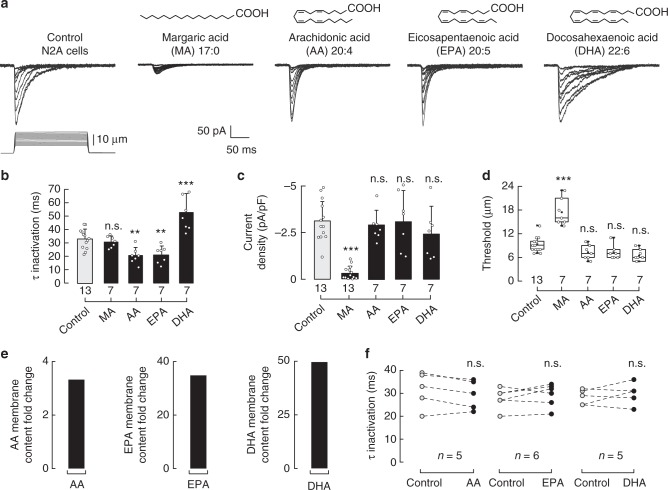
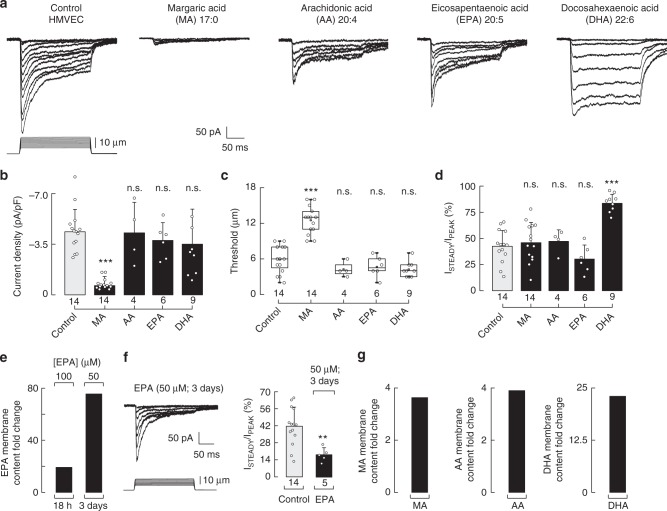
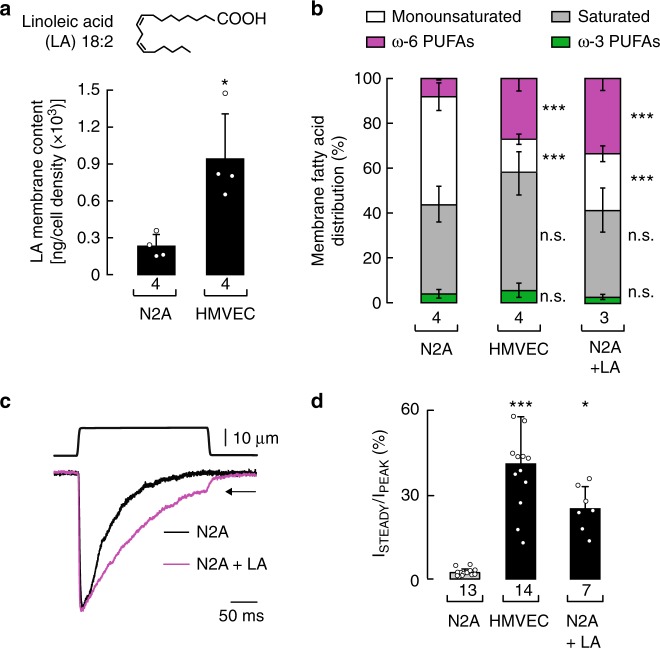
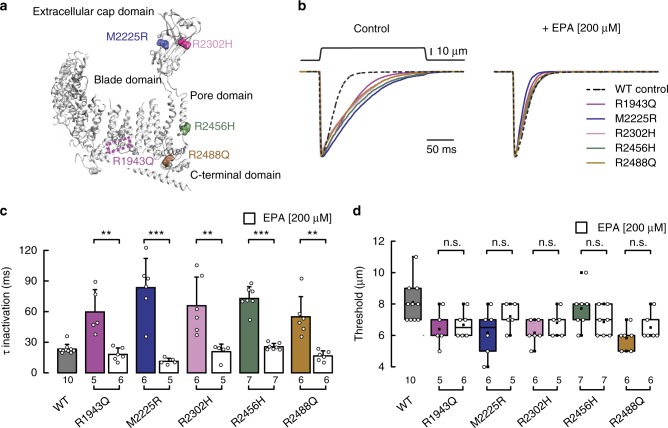
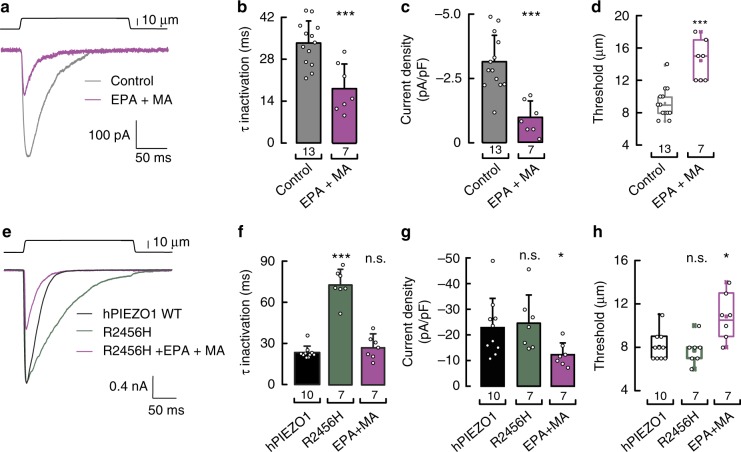
Mechanosensitive ion channels rely on membrane composition to transduce physical stimuli into electrical signals. The Piezo1 channel mediates mechanoelectrical transduction and regulates crucial physiological processes, including vascular architecture and remodeling, cell migration, and erythrocyte volume. The identity of the membrane components that modulate Piezo1 function remain largely unknown. Using lipid profiling analyses, we here identify dietary fatty acids that tune Piezo1 mechanical response. We find that margaric acid, a saturated fatty acid present in dairy products and fish, inhibits Piezo1 activation and polyunsaturated fatty acids (PUFAs), present in fish oils, modulate channel inactivation. Force measurements reveal that margaric acid increases membrane bending stiffness, whereas PUFAs decrease it. We use fatty acid supplementation to abrogate the phenotype of gain-of-function Piezo1 mutations causing human dehydrated hereditary stomatocytosis. Beyond Piezo1, our findings demonstrate that cell-intrinsic lipid profile and changes in the fatty acid metabolism can dictate the cell's response to mechanical cues.


Conflict of interest statement

The authors declare no competing interests.

Figures

Fig. 1
Fig. 1
Margaric acid inhibits Piezo1 currents in N2A cells. a Representative whole-cell patch-clamp recordings (at −60 mV) of control and margaric acid (MA) (1, 10, 25, 50, 100, and 300 µM)-treated N2A cells elicited by mechanical stimulation. Bottom right panel displays representative Piezo1 macroscopic currents of MA-treated N2A cells incubated with Yoda1 prior to mechanical stimulation. The structure of MA is displayed on top. b Piezo1 current densities elicited by maximum displacement of MA-treated N2A cells. A Boltzmann function, Eq. (2), was fitted to the data (IC50  = 28.3 ± 3.4 SEM). Circles are mean ± SD. n is denoted above the x-axis. c Piezo1 current densities elicited by maximum displacement of control and MA (10 µM; 18 h and 5 days)-treated N2A cells. n is denoted above the x-axis. Kruskal–Wallis and Dunn’s multiple comparisons test. d MA membrane content fold change in N2A cells treated with MA 100 µM for 18 h or 10 µM each day for 5 days, as determined by LC-MS. e Piezo1 current densities elicited by maximum displacement of control, MA (100 µM)-treated N2A cells, and MA (100 µM)-treated N2A cells incubated with 15 µM Yoda1 prior to mechanical stimulation. Bars are mean ± SD. n is denoted above the x-axis. Kruskal–Wallis and Dunn’s multiple comparisons test. f Boxplots show the mean, median, and the 75th to 25th percentiles of the displacement thresholds required to elicit Piezo1 currents of control and MA-treated N2A cells. n is denoted above the x-axis. One-way ANOVA and Bonferroni test. g Current changes elicited by maximum displacement of N2A cells perfused for 120 s with bath solution (control), MA (100 μM), and Gd3+ (30 μM) consecutively. Gd3+ was used as control for the perfusion. Data samples are paired. n is denoted above the plot. Friedman test. Asterisks indicate values significantly different from control (∗∗∗p < 0.001 and ∗∗p < 0.01) and n.s. indicates not significantly different from the control
Fig. 2
Fig. 2
Dietary fatty acids alter Piezo1 channel gating. a Representative whole-cell patch-clamp recordings (at −60 mV) of control, MA, AA, EPA, and DHA (100 µM)-treated N2A cells elicited by mechanical stimulation. The structures of MA, AA, EPA, and DHA are displayed above. b Piezo1 time constants of inactivation elicited by maximum displacement of control, MA, AA, EPA, and DHA (100 µM)-treated N2A cells. Bars are mean ± SD. One-way ANOVA and Bonferroni test. c Current densities elicited by maximum displacement of control, MA, AA, EPA, and DHA (100 µM)-treated N2A cells. Bars are mean ± SD. Kruskal–Wallis and Dunn’s multiple comparisons test. d Boxplots show the mean, median, and the 75th to 25th percentiles of the displacement threshold required to elicit Piezo1 currents of control, MA, AA, EPA, and DHA (100 µM)-treated N2A cells. One-way ANOVA and Bonferroni test. e AA, EPA, and DHA membrane content fold change in N2A cells treated with AA, EPA, and DHA 100 µM for 18 h, as determined by liquid chromatography-mass spectrometry (LC-MS). f Piezo1 time constants of inactivation elicited by maximum displacement of N2A cells perfused for 120 s with bath solution (control) and a PUFA (AA, EPA, and DHA; 100 μM). Data samples are paired. Paired t-test. Asterisks indicate values significantly different from control (∗∗∗p < 0.001 and ∗∗p < 0.01) and n.s. indicates not significantly different from the control. n is denoted above the x-axes
Fig. 3
Fig. 3
Dietary fatty acids alter membrane fluidity in N2A cells. a Representative thermotropic characterization of the DPPC/fatty acid systems using DSC: control (Tm = 41.68 °C), MA (43.08 °C), AA (41.04 °C), EPA (40.85 °C), and DHA (40.40 °C). b Effects of DPPC/fatty acids on melting temperatures (ΔTm) with respect to DPPC membranes. Experiments were performed from two independent preparations. c Estimation plot with all tether force data points presented as a swarmplot for control, pentadecanoic acid (PDA), MA, AA, EPA, and DHA (100 µM)-treated N2A cells. d Estimation plot with all tether force data points presented as a swarmplot for latrunculin A (1 µM; 1 h)-treated N2A control cells and supplemented with MA (100 μM) or EPA (100 μM). Bootstraps with 99.9% confidence interval and a comparison with the mean of the control group are displayed to the right and bottom of the raw data, respectively. Kruskal–Wallis and Dunn’s multiple comparisons test. Asterisks indicate values significantly different from control (∗∗∗p < 0.001, ∗∗p < 0.01, and p < 0.05) and n.s. indicates not significantly different from the control. n is denoted above the x-axes
Fig. 4
Fig. 4
Piezo1 channel mediates mechanically evoked currents in HMVEC. a Stacked bar chart illustrating the membrane fatty acid distribution in N2A cells and HMVEC, as determined by LC-MS. Bars are mean ± SD. n is denoted above the x-axis. Mann–Whitney test. b Representative whole-cell patch-clamp recordings (at ±60 mV) of HMVEC (top) elicited by mechanical stimulation (bottom). Red arrow highlights the steady-state currents. c Current–voltage relationship of HMVEC mechano-dependent currents as determined by whole-cell patch-clamp experiments. Circles are mean ± SD. n = 5. d Left: representative micrographs of HMVEC challenged with control buffer and 2 µM Yoda1 and analyzed for their responses using Ca2+ imaging (Fluo-4 AM); color bar indicates relative change in fluorescence intensity. White bar represents 50 µm. Middle: representative traces corresponding to intensity changes (ΔF/F) of individual cells shown in left panel. Right: mean fluorescence intensity values (ΔF/F) of HMVEC perfused with control solution (t = 30 s), Yoda1 (t = 250 s), and washed with control solution (t = 500 s). Bars are mean ± SD. n is denoted above the plot. Friedman test. e Left: representative HMVEC mechano-dependent current densities transfected with scrambled or Piezo1 siRNA elicited by mechanical stimulation at −60 mV under the whole-cell patch-clamp configuration. Right: boxplots show the mean, median, and the 75th to 25th percentiles of mechano-dependent currents densities obtained by whole-cell patch-clamp recordings of scrambled or Piezo1 siRNAs transfected HMVEC. n is denoted above the x-axis. Unpaired t-test. Asterisks indicate values significantly different from control (∗∗∗p < 0.001) and n.s. indicates not significantly different from the control
Fig. 5
Fig. 5
Dietary fatty acids alter Piezo1 channel gating in HMVEC. a Representative whole-cell patch-clamp recordings (at −60 mV) of control, MA, AA, EPA, and DHA (100 µM)-treated HMVEC elicited by mechanical stimulation. b Piezo1 current densities elicited by maximum displacement of control, MA, AA, EPA, and DHA (100 µM)-treated HMVEC. Bars are mean ± SD. Kruskal–Wallis and Dunn’s multiple comparisons test. c Boxplots show the mean, median, and the 75th to 25th percentiles of the displacement threshold required to elicit Piezo1 currents of control and MA, AA, EPA, and DHA (100 µM)-treated HMVEC. One-way ANOVA and Bonferroni test. d Ratio of the currents at the end of the displacement pulse to the peak current (ISTEADY/IPEAK) from macroscopic traces of control, MA, AA, EPA, and DHA (100 µM)-treated HMVEC. Bars are mean ± SD. One-way ANOVA and Bonferroni test. e EPA membrane content fold change of EPA-treated HMVEC supplemented with 100 µM for 18 h and 50 µM each day for 3 days, as determined by LC-MS. f Representative whole-cell patch-clamp recordings (at −60 mV) of EPA (50 µM each day for 3 days)-treated HMVEC elicited by mechanical stimulation; and ratio of the currents at the end of the displacement pulse to the peak current (ISTEADY/IPEAK) from macroscopic traces of control and EPA (50 µM each day for three days)-treated HMVEC. Bars are mean ± SD. Unpaired t-test. g MA, AA, and DHA membrane content fold change in MA, AA, and DHA (100 µM)-treated HMVEC as determined by LC-MS. Asterisks indicate values significantly different from control (∗∗∗p < 0.001 and ∗∗p < 0.01) and n.s. indicates not significantly different from the control. n is denoted above the x-axes
Fig. 6
Fig. 6
Changing the cellular fatty acid distribution profile modifies Piezo1 inactivation. a Linoleic acid (LA) membrane content in N2A cells and HMVEC, as determined by LC-MS. Bars are mean ± SD. Mann–Whitney test. b Stacked bar chart illustrating the membrane fatty acid distribution in N2A cells, HMVEC, and LA (100 µM)-treated N2A cells, as determined by LC-MS. Bars are mean ± SD. One-way ANOVA and Bonferroni test. c Representative whole-cell patch-clamp recordings (at −60 mV) of N2A cells and linoleic acid (LA, 100 µM)-treated N2A cells elicited by mechanical stimulation. Traces were normalized for comparison. d Ratio of the currents at the end of the displacement pulse to the peak current (ISTEADY/IPEAK) from macroscopic traces of N2A cells, LA (100 µM)-treated cells, and HMVEC. Bars are mean ± SD. Kruskal–Wallis and Dunn’s multiple comparisons test. Asterisks indicate values significantly different from control (∗∗∗p < 0.001 and p < 0.05) and n.s. indicates not significantly different from the control. n is denoted above the x-axis
Fig. 7
Fig. 7
EPA supplementation abrogates the phenotype of Piezo1 xerocytosis mutations. a Ribbon representation of Mus musculus (mm) Piezo1 monomer (PDB ID: 5Z10) highlighting equivalent residues that when mutated cause dehydrated hereditary stomatocytosis in humans. b Representative normalized macroscopic currents (at −60 mV) evoked by maximum displacement of N2A cells transfected with human Piezo1 dehydrated hereditary stomatocytosis mutants R1943Q, M2225R, R2302H, R2456, and R2488Q with and without EPA supplementation (left and right, respectively). Human Piezo1 wild type (WT) without supplementation is shown for comparison. c Piezo1 time constants of inactivation elicited by maximum displacement of dehydrated hereditary stomatocytosis mutants R1943Q, M2225R, R2302H, R2456H, and R2488Q with and without EPA supplementation. Human Piezo1 WT without supplementation is shown for comparison. Bars are mean ± SD. Unpaired t-test with Welch correction, except for R2302H in which Mann–Whitney test was used. d Boxplots show the mean, median, and the 75th to 25th percentiles of the displacement threshold required to elicit currents of Piezo1 dehydrated hereditary stomatocytosis mutants R1943Q, M2225R, R2302H, R2456H, and R2488Q with and without EPA supplementation. Human Piezo1 WT without supplementation is shown for comparison. Unpaired t-test, except for R2488Q in which Mann–Whitney test was used. Asterisks indicate values significantly different from control (∗∗∗p < 0.001 and ∗∗p < 0.01) and n.s. indicates not significantly different from the control. n is denoted above the x-axes
Fig. 8
Fig. 8
EPA and MA have distinct and synergistic effects on Piezo1 gating. a Representative macroscopic current (at −60 mV) evoked by maximum displacement of N2A cells treated with and without a mixture of EPA and MA (200 and 100 µM, respectively). b Piezo1 time constants of inactivation elicited by maximum displacement of N2A cells treated with and without a mixture of EPA and MA. Bars are mean ± SD. One-way ANOVA and Bonferroni test. c Current densities elicited by maximum displacement of N2A cells treated with and without a mixture of EPA and MA. Bars are mean ± SD. Unpaired t-test. d Boxplots show the mean, median, and the 75th to 25th percentiles of the displacement threshold required to elicit Piezo1 currents of N2A cells treated with and without a mixture of EPA and MA. Unpaired t-test. e Representative normalized macroscopic currents (at −60 mV) evoked by maximum displacement of N2A cells transfected with human Piezo1 wild type (WT) and R2456H, with and without a mixture of MA and EPA supplementation (200 and 100 µM, respectively). f Piezo1 time constants of inactivation elicited by maximum displacement of N2A cells transfected with human Piezo1 WT and R2456H, with and without a mixture of MA and EPA supplementation. Bars are mean ± SD. Kruskal–Wallis and Dunn’s multiple comparisons test. g Current densities elicited by maximum displacement of N2A cells transfected with human Piezo1 WT and R2456H, with and without a mixture of MA and EPA supplementation. Bars are mean ± SD. Kruskal–Wallis and Dunn’s multiple comparisons test. h Boxplots show the mean, median, and the 75th to 25th percentiles of the displacement threshold required to elicit Piezo1 currents of N2A cells transfected with human Piezo1 WT and R2456H, with and without a mixture of MA and EPA supplementation. Kruskal–Wallis and Dunn’s multiple comparisons test. Asterisks indicate values significantly different from control (∗∗∗p < 0.001 and p < 0.05) and n.s. indicates not significantly different from the control. n is denoted above the x-axes

Similar articles

Cited by

References

    1. Wang S, et al. Endothelial cation channel PIEZO1 controls blood pressure by mediating flow-induced ATP release. J. Clin. Invest. 2016;126:4527–4536. doi: 10.1172/JCI87343. - DOI - PMC - PubMed
    1. Rode B, et al. Piezo1 channels sense whole body physical activity to reset cardiovascular homeostasis and enhance performance. Nat. Commun. 2017;8:350. doi: 10.1038/s41467-017-00429-3. - DOI - PMC - PubMed
    1. Zeng WZ, et al. PIEZOs mediate neuronal sensing of blood pressure and the baroreceptor reflex. Science. 2018;362:464–467. doi: 10.1126/science.aau6324. - DOI - PMC - PubMed
    1. Ranade SS, et al. Piezo1, a mechanically activated ion channel, is required for vascular development in mice. Proc. Natl Acad. Sci. USA. 2014;111:10347–10352. doi: 10.1073/pnas.1409233111. - DOI - PMC - PubMed
    1. Li J, et al. Piezo1 integration of vascular architecture with physiological force. Nature. 2014;515:279–282. doi: 10.1038/nature13701. - DOI - PMC - PubMed

Publication types

MeSH terms

Supplementary concepts