Observational Study
. 2019 Mar 13;10(1):1204.
doi: 10.1038/s41467-019-09150-9.

Contractile forces in platelet aggregates under microfluidic shear gradients reflect platelet inhibition and bleeding risk

Affiliations
Observational Study

Contractile forces in platelet aggregates under microfluidic shear gradients reflect platelet inhibition and bleeding risk

Lucas H Ting et al. Nat Commun. .

Abstract

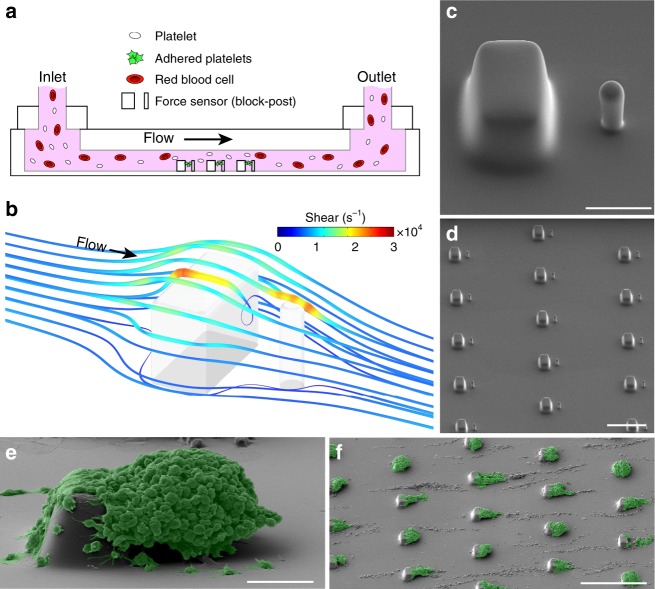
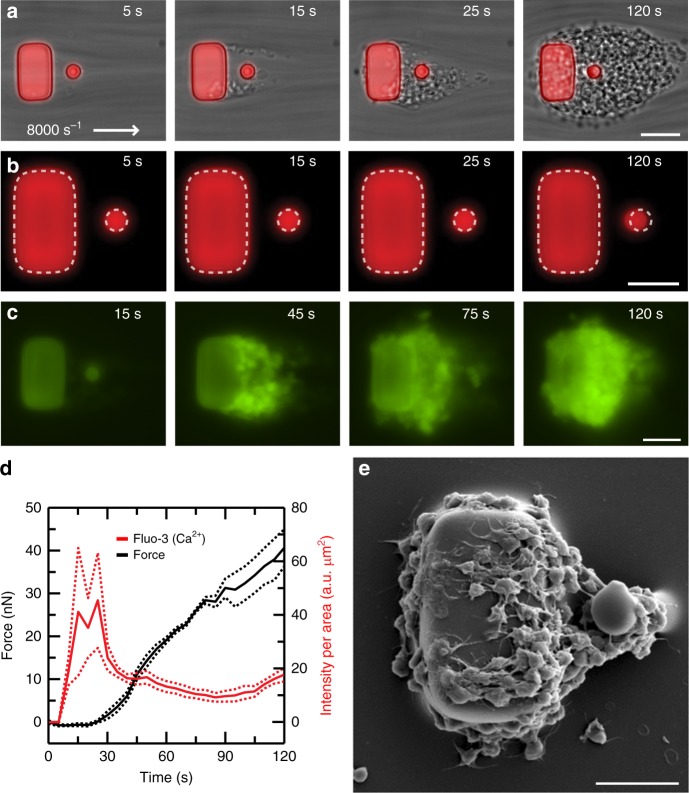
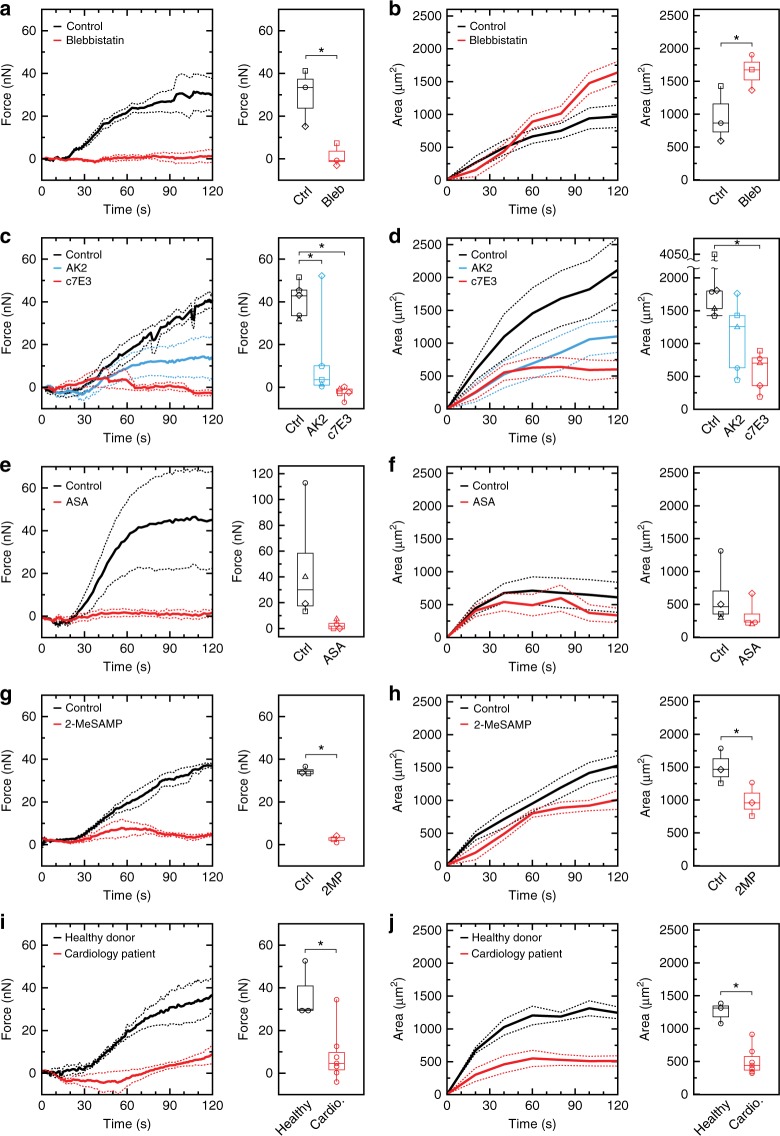
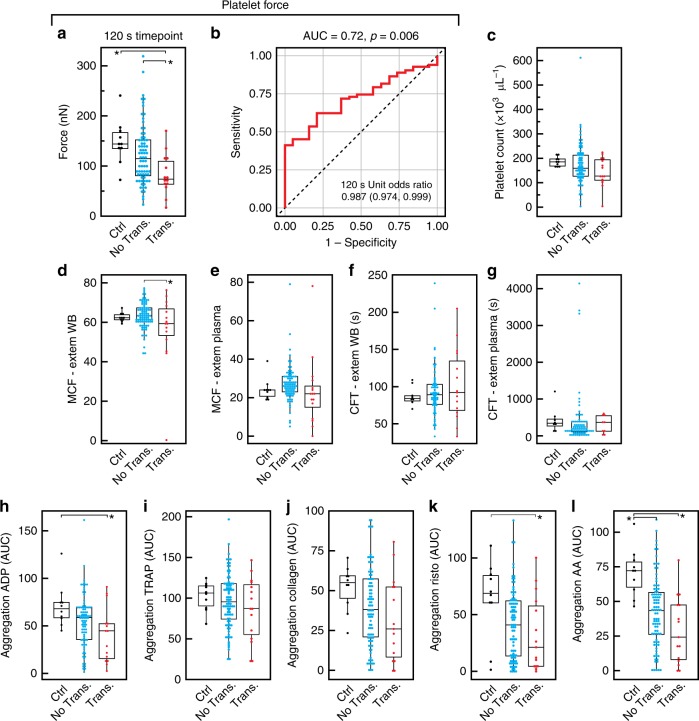
Platelets contract forcefully after their activation, contributing to the strength and stability of platelet aggregates and fibrin clots during blood coagulation. Viscoelastic approaches can be used to assess platelet-induced clot strengthening, but they require thrombin and fibrin generation and are unable to measure platelet forces directly. Here, we report a rapid, microfluidic approach for measuring the contractile force of platelet aggregates for the detection of platelet dysfunction. We find that platelet forces are significantly reduced when blood samples are treated with inhibitors of myosin, GPIb-IX-V, integrin αIIbβ3, P2Y12, or thromboxane generation. Clinically, we find that platelet forces are measurably lower in cardiology patients taking aspirin. We also find that measuring platelet forces can identify Emergency Department trauma patients who subsequently require blood transfusions. Together, these findings indicate that microfluidic quantification of platelet forces may be a rapid and useful approach for monitoring both antiplatelet therapy and traumatic bleeding risk.


Conflict of interest statement

N.J.S., N.J.W., L.H.T, A.K., A.O.S., S.F. and N.T. are shareholders, consultants, and/or employees of Stasys Medical Corp., a company created to develop the platelet force technology for clinical use. Two US patents have been filed covering the technology: US 9,213,024 B2 (Microfluidic devices for measuring platelet coagulation and associated systems and methods) and US 9,140,684 B2 (Device to expose cells to fluid shear forces and associated systems and methods). E.L., A.S.J., X.W. and T.R. declare no competing interests.

Figures

Fig. 1
Fig. 1
Microfluidic formation of platelet aggregates. a Schematic of microfluidic device in which whole blood is injected at the inlet and platelets aggregate onto arrays of microscale blocks and flexible posts for the measurement of platelet forces. b Computational fluid dynamics simulation at a wall shear rate of 8000 s−1 show local regions of high shear that platelets encounter as they follow the streamlines that transit over a block and post. c Scanning electron microscopy (SEM) micrograph of a block and post at the bottom of the microchannel. Scale bar, 10 μm. d SEM micrograph of an array of blocks and posts. Scale bar, 50 μm. Pseudo-colored SEM micrograph of platelet aggregates that formed on (e) a block and post (scale bar, 10 μm) and f on an array of blocks and posts (scale bar, 100 μm) after 70 s of blood flow in the device
Fig. 2
Fig. 2
Measurement of platelet forces coincide with platelet activation. a Representative time course of phase contrast and fluorescence microscopy images taken during platelet aggregation at 8000 s−1. Platelets clump initially at the trailing edges of the block and then connect to the post, eventually recruiting more passing platelets to attach to the aggregate. Scale bar, 15 μm. b The block and posts are fluorescently labeled (red, DiI), which allows platelet forces to be measured by analyzing the deflection of the post over time. Multiple aggregates are measured in the same field of view of the camera and averaged together over time to obtain a data trace. Scale bar, 10 μm. c Using a fluorescence indicator of Ca2+ (fluo-3) shows that platelets exhibit increased intracellular calcium upon adhesion to the block. Scale bar, 10 μm. d Representative data from a single donor shows that Ca2+ concentration (red) increases prior to platelet forces on the posts (black). Solid lines indicate the mean and dashed lines indicate standard error of the mean. e Scanning electron microscopy (SEM) micrograph of a platelet aggregate formed after 45 s at 8000 s−1. Platelets attached to the block and post have undergone shear-induced activation and shape change. Scale bar, 10 μm
Fig. 3
Fig. 3
Platelet forces are sensitive to platelet inhibition. Forces and projected areas are shown for measurements of aggregates in the microfluidic device. Myosin inhibition (5 μM blebbistatin) causes a lower forces and b less compacted aggregates as compared to the control. Data are from three donors. Inhibition of GPIb-IX-V (5 μg mL−1 antibody AK2) or integrin αIIbβ3 (20 μg mL−1 antibody c7E3) causes a reduction in c platelet forces and d aggregate size. Data are from five donors. Inhibition of thromboxane formation using 0.3 mM acetylsalicylic acid (ASA) reduces e platelet forces and f aggregate size. Data are from four donors. Inhibition of adenosine diphosphate (ADP) activation (10 μM 2-MeSAMP (2-methylthioadenosine 5’-monophosphate triethylammonium salt)) reduces g platelet forces and h aggregate size. Data are from three donors. Cardiology patients on aspirin therapy have significantly reduced i platelet forces and j aggregate size as compared to healthy donors. Data shown are from seven cardiology patients and three healthy donors. Solid lines indicate the mean and dashed lines indicate standard error of the mean. Body of the box plots represent first and third quartiles. Center lines denote the median. Whiskers extend from the quartiles to the last data point within 1.5× interquartile range, with outliers beyond. Each marker shape in (ah) represents control and inhibitor results for a blood sample from a single donor. Asterisks denote statistically significant differences (*p < 0.05) using paired two-way T-tests for (a, b, eh), one-way analysis of variance (ANOVA) followed by Tukey’s post-hoc test for (c, d), and two-way unpaired T-tests for (i, j)
Fig. 4
Fig. 4
Platelet forces are indicative of bleeding risk in trauma patients. In a prospective cross-sectional observational study of Emergency Department trauma patients at a regional trauma center (N = 110 patients), blood was sampled upon arrival to the Emergency Department. a Platelet forces differed among healthy controls and trauma patients when stratified by need for blood product transfusion within the first 24 h of hospital care. Mean force was significantly decreased for those requiring transfusion (red diamonds) compared to both healthy controls (black diamonds) and vs. trauma subjects who did not require transfusion (magenta diamonds). b Receiver operating characteristics revealed that platelet forces significantly predicted the need for transfusion. c Platelet count was in the normal range for all three groups and was not different between groups. d, e Rotational thromboelastometry (ROTEM) showed that maximum clot firmness (MCF) was decreased in whole blood for transfused vs. not transfused trauma groups, but was not different between groups when measured in plasma. f, g There were no differences in ROTEM clot formation time (CFT) between groups when measured in whole blood and in plasma. hl Platelet aggregation responses measured by the area under the aggregation curve (AUC) were significantly different when aggregation was activated by adenosine diphosphate (ADP), ristocetin, and arachidonic acid. There were no differences in aggregation between groups when activated by thrombin activating peptide (TRAP), or collagen. Platelet aggregation did not distinguish between transfused and non-transfused trauma patients. Body of the box plots represent first and third quartiles. Center lines denote the median. Whiskers extend from the quartiles to the last data point within 1.5× interquartile range, with outliers beyond. Data points represent results from a single subject. Asterisks denote statistically significant differences (*p < 0.05) using one-way analysis of variance (ANOVA) followed by Tukey’s post-hoc test

Similar articles

Cited by

References

    1. Jackson SP. Arterial thrombosis–insidious, unpredictable and deadly. Nat. Med. 2011;17:1423–1436. doi: 10.1038/nm.2515. - DOI - PubMed
    1. Tomaiuolo M, Brass LF, Stalker TJ. Regulation of platelet activation and coagulation and its role in vascular injury and arterial thrombosis. Interv. Cardiol. Clin. 2017;6:1–12. - PMC - PubMed
    1. McFadyen JD, Schaff M, Peter K. Current and future antiplatelet therapies: emphasis on preserving haemostasis. Nat. Rev. Cardiol. 2018;15:181–191. doi: 10.1038/nrcardio.2017.206. - DOI - PubMed
    1. Holcomb JB, et al. Increased platelet:RBC ratios are associated with improved survival after massive transfusion. J. Trauma. 2011;71:S318–S328. doi: 10.1097/TA.0b013e318227edbb. - DOI - PubMed
    1. Holcomb JB, et al. Transfusion of plasma, platelets, and red blood cells in a 1:1:1 vs a 1:1:2 ratio and mortality in patients with severe trauma: the PROPPR randomized clinical trial. JAMA. 2015;313:471–482. doi: 10.1001/jama.2015.12. - DOI - PMC - PubMed

Publication types

MeSH terms