. 2019 Mar 13;10(1):1139.
doi: 10.1038/s41467-019-08976-7.

Transcriptional profiling of human microglia reveals grey-white matter heterogeneity and multiple sclerosis-associated changes

Affiliations

Transcriptional profiling of human microglia reveals grey-white matter heterogeneity and multiple sclerosis-associated changes

Marlijn van der Poel et al. Nat Commun. .

Abstract

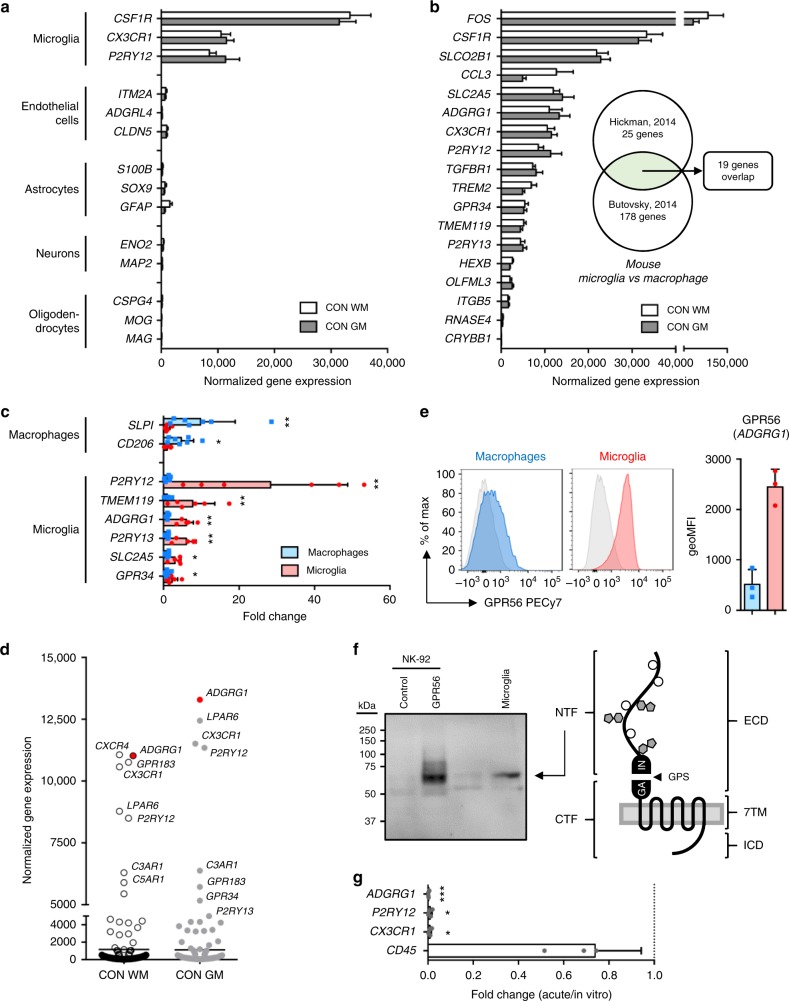
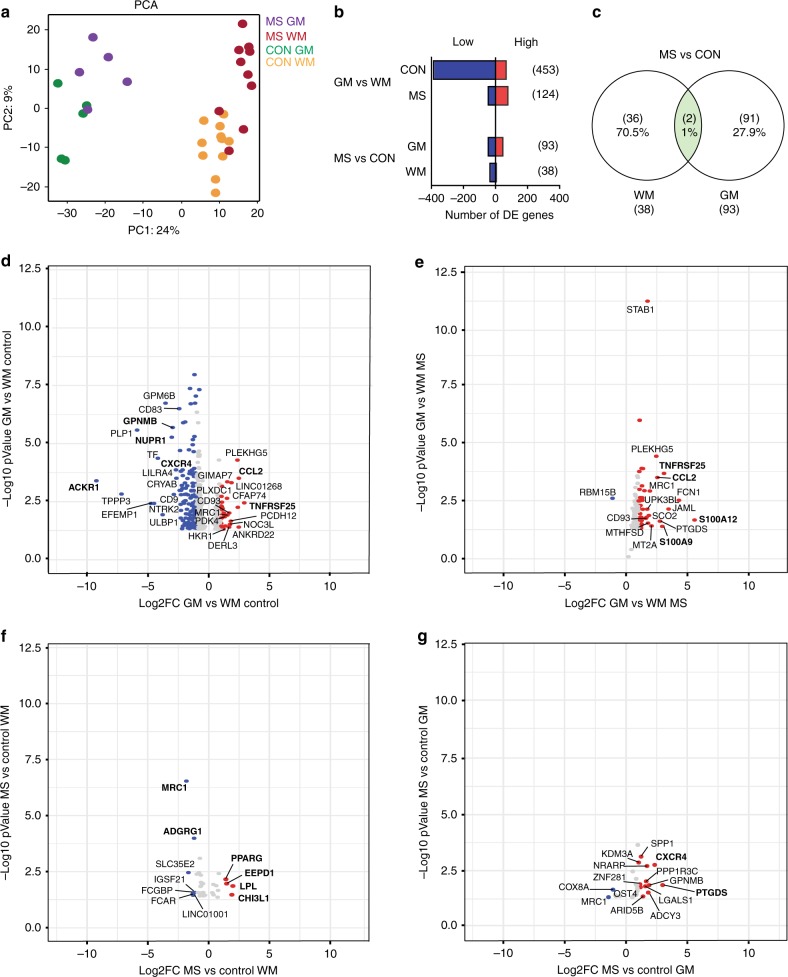
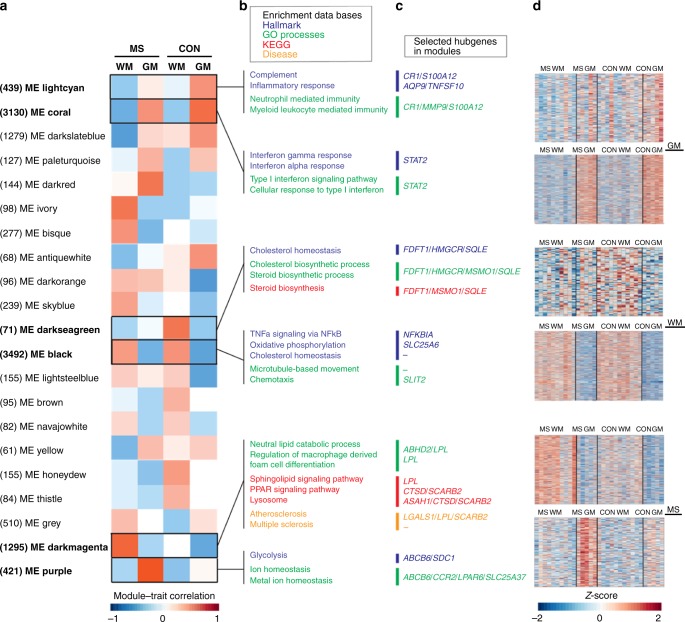
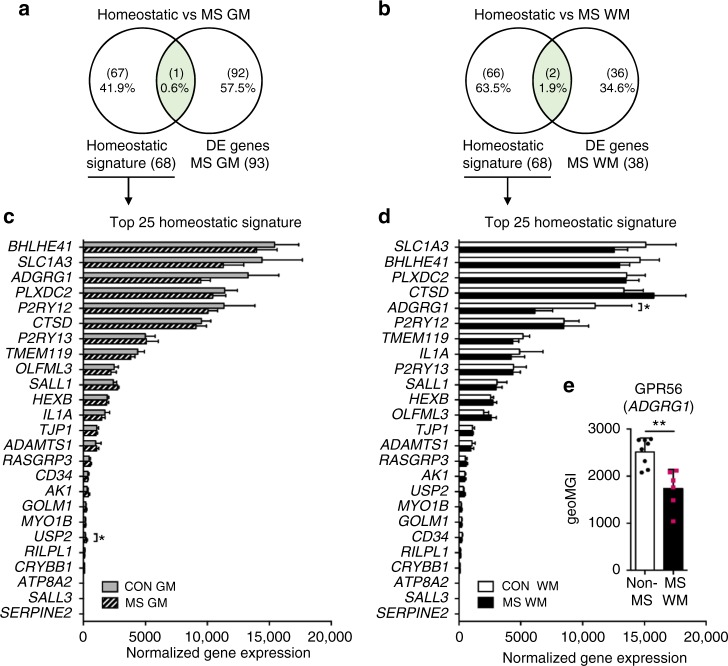
Here we report the transcriptional profile of human microglia, isolated from normal-appearing grey matter (GM) and white matter (WM) of multiple sclerosis (MS) and non-neurological control donors, to find possible early changes related to MS pathology. Microglia show a clear region-specific profile, indicated by higher expression of type-I interferon genes in GM and higher expression of NF-κB pathway genes in WM. Transcriptional changes in MS microglia also differ between GM and WM. MS WM microglia show increased lipid metabolism gene expression, which relates to MS pathology since active MS lesion-derived microglial nuclei show similar altered gene expression. Microglia from MS GM show increased expression of genes associated with glycolysis and iron homeostasis, possibly reflecting microglia reacting to iron depositions. Except for ADGRG1/GPR56, expression of homeostatic genes, such as P2RY12 and TMEM119, is unaltered in normal-appearing MS tissue, demonstrating overall preservation of microglia homeostatic functions in the initiation phase of MS.


Conflict of interest statement

The authors declare no competing interests.

Figures

Fig. 1
Fig. 1
A common core signature for grey and white matter (GM and WM, respectively) microglia. a Expression of genes associated with microglia, endothelial cells, astrocytes, neurons, and oligodendrocytes obtained by RNA sequencing of GM (n = 5) and WM (n = 11) microglia. b Expression of 19 established mouse microglia signature genes that overlap between two datasets, is highly conserved in human microglia from both GM (n = 5) and WM (n = 11) tissue. c Expression of microglia and macrophage signature genes in WM microglia (n = 6) and choroid plexus macrophages (n = 7) determined by quantitative reverse transcription polymerase chain reaction (RT-qPCR). Mann–Whitney U test *p < 0.05, **p < 0.01. d Transcriptional expression of G protein-coupled receptors (GPCRs) in microglia reveals ADGRG1 as top 3 abundant GPCR transcript in both GM (n = 5) and WM (n = 11) microglia. e Detection of GPR56 protein in WM microglia, but not in choroid plexus macrophages, by flow cytometry (n = 3). f Western blot analysis of GPR56 in NK-92 cells and WM microglia detects a 60-kDa band, corresponding with the presumed size of the N-terminal fragment (NTF). g In culture, microglia downregulate the expression of ADGRG1 and other signature genes (P2RY12, CX3CR1) determined here by RT-qPCR at 4 days in vitro (n = 4). Unpaired t test: *p < 0.05, ***p < 0.001. Bars show mean with standard deviation
Fig. 2
Fig. 2
Regional and multiple sclerosis (MS)-specific changes in human microglia determined by differentially expressed (DE) genes. a Principal component analysis of global gene expression demonstrates profound differences between microglia from GM and WM and smaller differences between microglia from control and MS donors. b Number of DE genes for GM vs WM and MS vs CON, based on a fold change of > 2 or <−2 and an adjusted p value (false discovery rate <0.05). c A Venn diagram shows hardly any overlap between GM and WM MS microglia, based on DE genes. The two overlapping genes are MRC1 and LOC101927481. dg Volcano plots illustrating the top regulated genes in GM vs WM microglia from control (d) or MS (e) and in MS vs control microglia in WM (f) and GM (g) regions. Red and blue dots indicate positive or negative fold change, respectively
Fig. 3
Fig. 3
Co-expression networks for microglia in grey and white matter (GM and WM, respectively) and in normal-appearing multiple sclerosis (MS) tissue. a Twenty-one modules identified by weighted gene co-expression network analysis are provided with their module–trait correlation and the amount of genes that belong to each module displayed between brackets. b, c Modules of interest for GM and WM regions and for MS GM or WM tissue are highlighted with top enriched hallmarks, Gene ontology terms, Kyoto Encyclopedia of Genes and Genomes pathways, and disease terms as well as top hubgenes with the highest connectivity provided. Module eigengenes (MEs) lightcyan and coral correlate to GM in control or in both control and MS microglia, respectively. MEs darkseagreen and black correlate to WM in control microglia or in both control and MS, respectively. MEs darkmagenta and purple correlate to MS WM or GM, respectively. d Heatmaps display the expression of each gene in modules of interest, based on Z-score
Fig. 4
Fig. 4
Conservation of homeostatic gene expression in microglia from normal-appearing multiple sclerosis (MS) tissue. a, b Venn diagrams show hardly any overlap between homeostatic genes identified in mouse microglia and differentially expressed genes for grey matter (GM; n = 5) and white matter (WM; n = 10) MS microglia. c, d Expression of 25 homeostatic signature genes is amply changed in human microglia from both MS GM and WM, except for USP2 upregulation in GM and ADGRG1 downregulation in WM MS microglia. Two-way ANOVA: * adjusted <0.05. e Flow cytometric analysis confirms downregulation of GPR56 protein expression in MS WM microglia (n = 6) compared to non-MS WM microglia (n = 8). Mann–Whitney U test: **p < 0.01. Bars show mean with standard deviation
Fig. 5
Fig. 5
Gene expression differences observed in normal-appearing white matter (NAWM) microglia relate to changes found in multiple sclerosis (MS) lesions. a Excised mixed active/inactive MS lesion tissue (n = 5) shows increased expression of the differentially expressed genes LPL and CHI3L1 compared to NAWM (n = 7) determined by quantitative reverse transcription polymerase chain reaction (RT-qPCR). EEPD1 and ADGRG1 expression is unaltered. Mann–Whitney U test: *p < 0.05, **p < 0.01. b IRF8+ nuclei isolated from the same mixed active/inactive MS lesions demonstrates increased expression of CHI3L1 and LPL, compared to IRF8+ nuclei from NAWM, determined by RT-qPCR. In line with the tissue data, the expression of EEPD1 and ADGRG1 is not changed in IRF8+ nuclei from MS lesions. Mann–Whitney U one-tailed test: *p < 0.05, **p < 0.01. Box plot center line shows median; whiskers show minimum–maximum values

Similar articles

Cited by

References

    1. Stadelman C, Wegner C, Bruck W. Inflammation, demyelination, and degeneration- recent insights from MS pathology. Biochim. Biophys. Acta. 2011;1812:275–282. - PubMed
    1. Mahad DH, Trapp BD, Lassmann H. Pathological mechanisms in progressive multiple sclerosis. Lancet Neurol. 2015;14:183–193. - PubMed
    1. Peterson JW, Bö L, Mörk S, Chang A, Trapp BD. Transected neurites, apoptotic neurons, and reduced inflammation in cortical multiple sclerosis lesions. Ann. Neurol. 2001;50:389–400. - PubMed
    1. Bø L, Vedeler CA, Nyland H, Trapp BD, Mørk SJ. Intracortical multiple sclerosis lesions are not associated with increased lymphocyte infiltration. Mult. Scler. 2003;9:323–331. - PubMed
    1. Lampron A, et al. Inefficient clearance of myelin debris by microglia impairs remyelinating processes. J. Exp. Med. 2015;212:481–495. - PMC - PubMed

Publication types

MeSH terms