. 2019 Mar 13;10(1):1189.
doi: 10.1038/s41467-019-09197-8.

A Hox-TALE regulatory circuit for neural crest patterning is conserved across vertebrates

Affiliations

A Hox-TALE regulatory circuit for neural crest patterning is conserved across vertebrates

Hugo J Parker et al. Nat Commun. .

Abstract

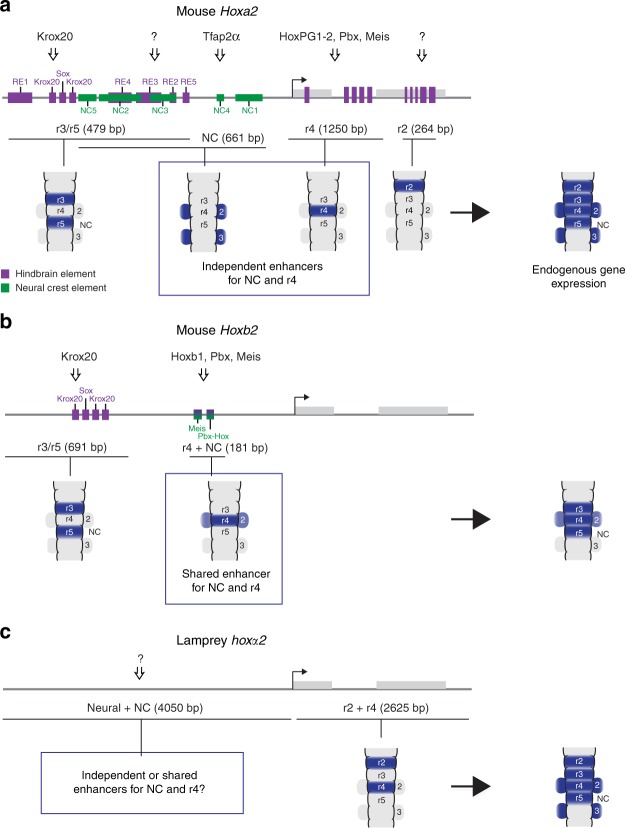
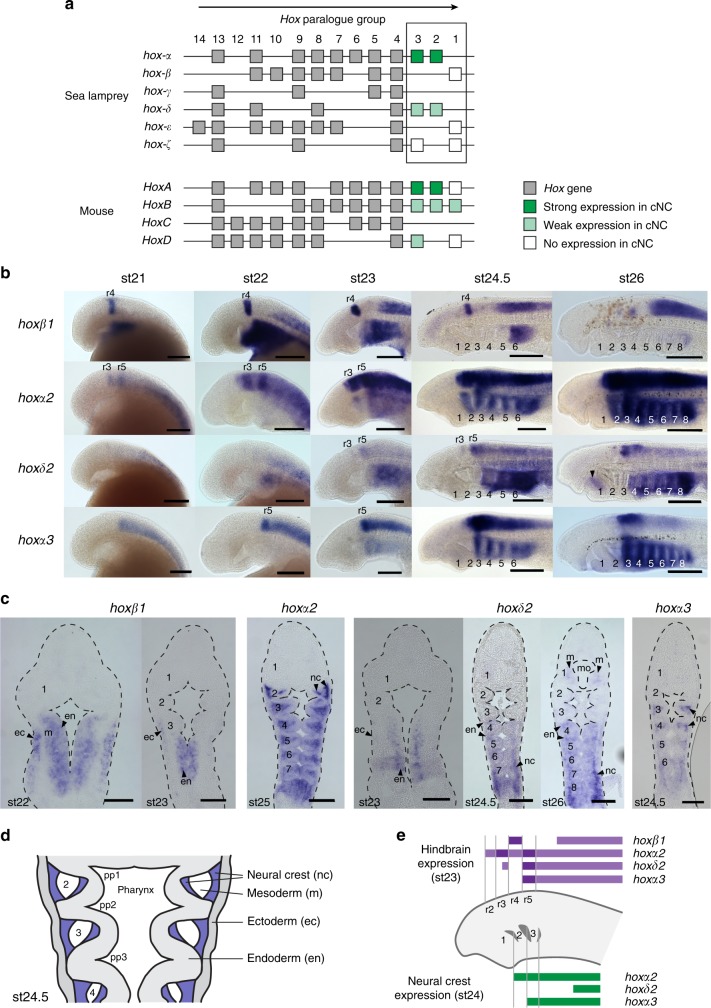
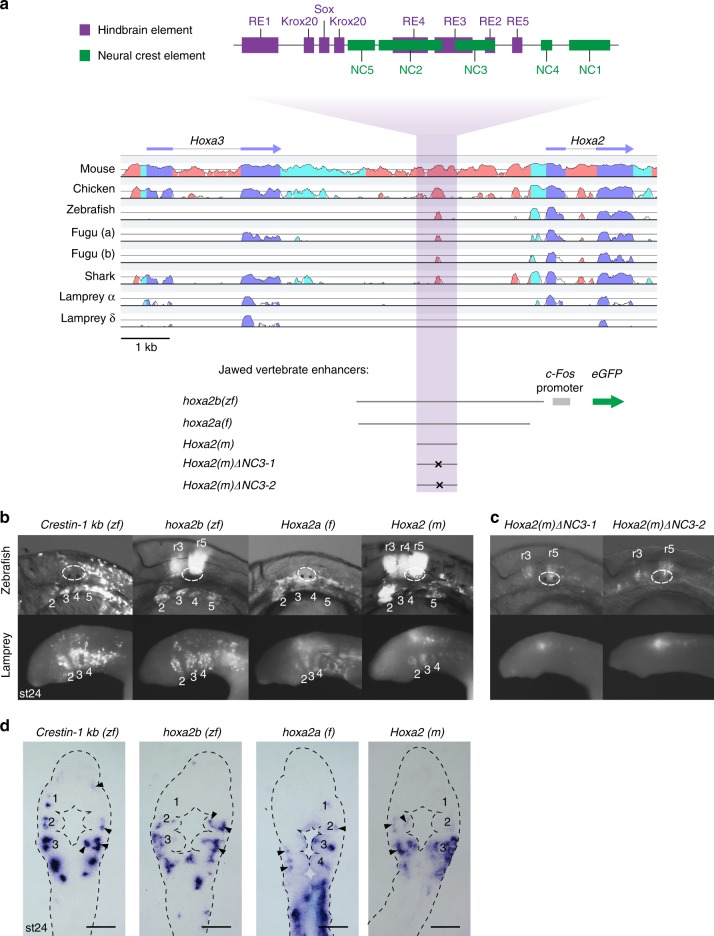
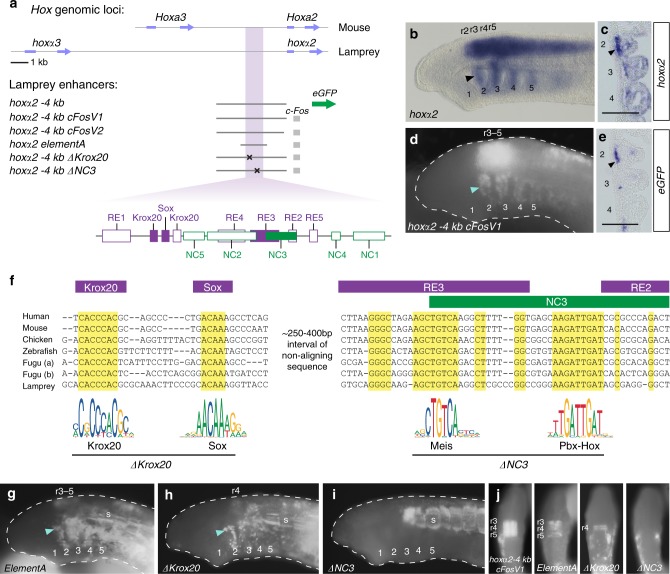
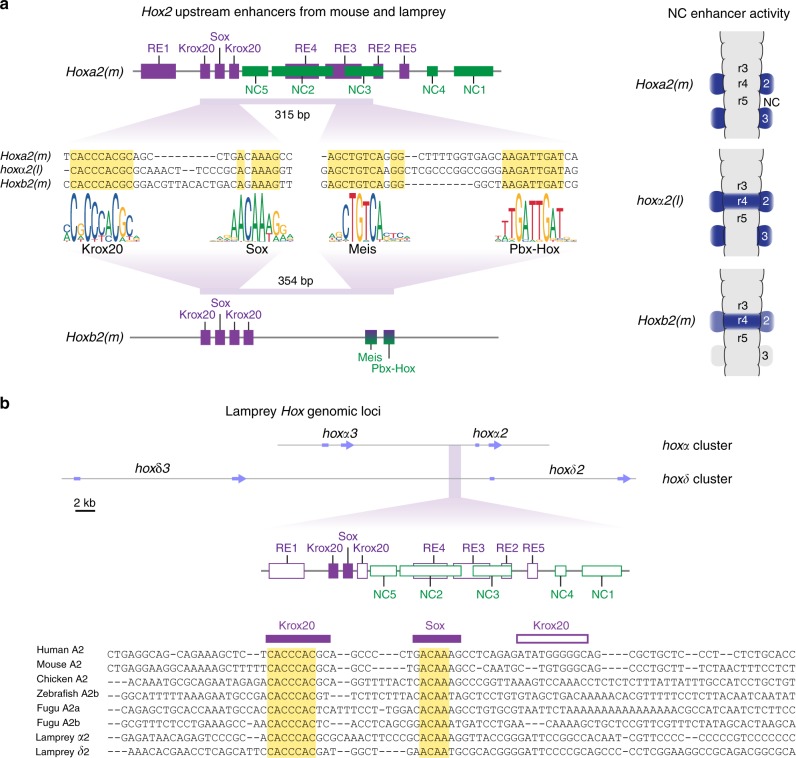
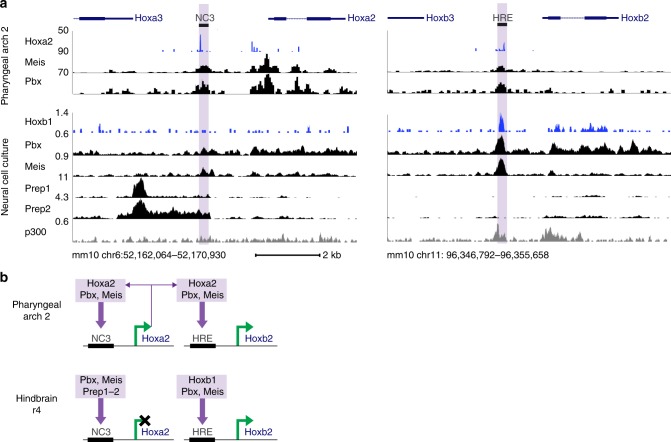
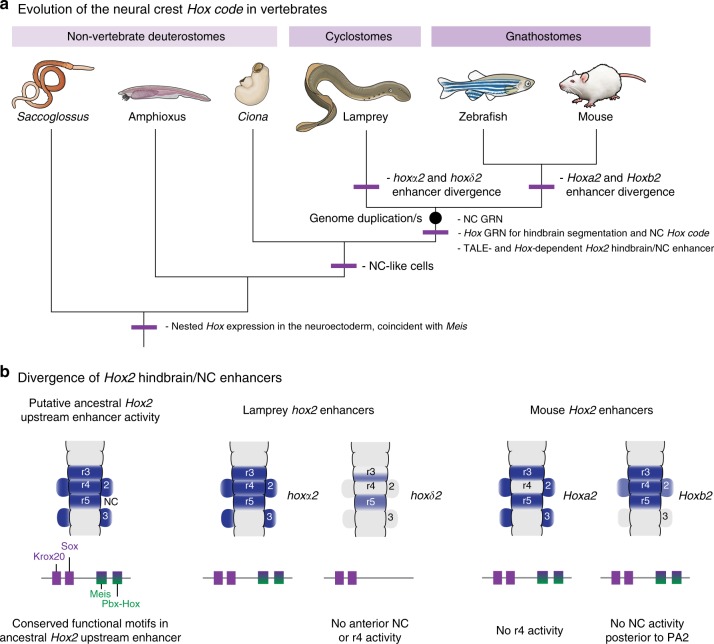
In jawed vertebrates (gnathostomes), Hox genes play an important role in patterning head and jaw formation, but mechanisms coupling Hox genes to neural crest (NC) are unknown. Here we use cross-species regulatory comparisons between gnathostomes and lamprey, a jawless extant vertebrate, to investigate conserved ancestral mechanisms regulating Hox2 genes in NC. Gnathostome Hoxa2 and Hoxb2 NC enhancers mediate equivalent NC expression in lamprey and gnathostomes, revealing ancient conservation of Hox upstream regulatory components in NC. In characterizing a lamprey hoxα2 NC/hindbrain enhancer, we identify essential Meis, Pbx, and Hox binding sites that are functionally conserved within Hoxa2/Hoxb2 NC enhancers. This suggests that the lamprey hoxα2 enhancer retains ancestral activity and that Hoxa2/Hoxb2 NC enhancers are ancient paralogues, which diverged in hindbrain and NC activities. This identifies an ancestral mechanism for Hox2 NC regulation involving a Hox-TALE regulatory circuit, potentiated by inputs from Meis and Pbx proteins and Hox auto-/cross-regulatory interactions.


Conflict of interest statement

The authors declare no competing interests.

Figures

Fig. 1
Fig. 1
Characterized Hox2 enhancers regulating neural crest (NC) and rhombomeric expression from mouse and lamprey. Schematic diagrams depicting the known enhancers regulating mouse Hoxa2 (a) and Hoxb2 (b), and lamprey hoxα2 (c), in rhombomeres (r) and NC. For each locus, the gene exons are represented by grey boxes and the transcriptional start site by an arrow. Enhancers are marked as black lines below the loci, with their activity domains illustrated by blue shading in schematic dorsal views of the hindbrain (r2–5) and pharyngeal arches (2–3). For the mouse loci, characterised cis-elements contributing to enhancer function are depicted as coloured boxes: hindbrain elements in purple and NC elements in green (not drawn to scale). Known direct inputs from transcription factors into these cis-elements are depicted by arrows, with unknown inputs shown as question marks. Hoxa2 is regulated in r4 and r4-derived NC (PA2) by independent enhancers (a). Hoxb2 expression in r4 and NC is mediated by a single enhancer, through cis-elements bound by Meis and Pbx-Hox factors (b). Since these elements have dual hindbrain/NC activity they are depicted in both purple and green. Genomic regions from the lamprey hoxα2 locus have enhancer activity, with an r2/r4 enhancer positioned within the exons and intron (c). The hoxα2-hoxα3 intergenic region drives reporter expression in the hindbrain and NC. However, it is not known whether this is through independent or shared NC/hindbrain enhancers, specific cis-elements have not been identified, and the relationship of this region to the gnathostome Hoxa2 and Hoxb2 enhancers is unclear
Fig. 2
Fig. 2
Embryonic time course showing expression of hox genes in the lamprey hindbrain and cranial neural crest (NC). a Genomic organization of Hox genes in lamprey and mouse. Boxes represent Hox genes, which are organized into paralogue groups based on their sequence. The arrow above the clusters denotes the direction of Hox gene transcription. Lamprey hox genes from paralogue groups 1–3 were examined for NC expression in this study and their expression in cranial NC is denoted by green/white shading. b Lateral views of lamprey embryos from stages (st)21 to 26, showing hox gene expression domains in the developing head. Pharyngeal arches are numbered and rhombomere-specific domains (r) indicated. The arrowhead marks weak hoxδ2 expression in mandibular mesoderm at st26. c Frontal sections through lamprey embryos showing hox gene expression domains within the developing pharynx. Pharyngeal arches are numbered. d Schematic of a frontal section through the lamprey st24.5 embryonic pharynx with tissue domains annotated; NC domains are shaded in blue. Scale bars: 200 μm (b); 100 µm (c). e Schematic depicting hox expression in the lamprey hindbrain and NC at st23 and st24. ec, ectoderm; en, endoderm; m, mesoderm; mo, mouth; nc, neural crest; r, rhombomere; st, stage
Fig. 3
Fig. 3
Conserved activity of gnathostome Hoxa2 neural crest (NC) enhancers in zebrafish and lamprey. a Sequence alignment of gnathostome Hoxa2-Hoxa3 and lamprey hox2-hox3 gene loci against the human locus. Conserved non-coding sequences (pink), untranslated regions (UTRs) (cyan) and coding sequences (blue) are highlighted. The relative locations of the mouse hindbrain and NC cis-elements (top) are shown. Gnathostome Hoxa2 enhancers used for cross-species reporter analysis are detailed below the alignment. Letters within parenthesis indicate species of origin of the enhancer: zf, zebrafish; f, fugu; m, mouse. b, c Green fluorescent protein (GFP) reporter expression in zebrafish and lamprey embryos (lateral views), mediated by wild-type (b) and mutated (c) gnathostome NC enhancers. For zebrafish, the otic vesicle is circled and GFP expression in rhombomeres (r) and pharyngeal arches (2–5) indicated. Lamprey pharyngeal arches are labelled (2–4). GFP-expressing embryos shown are representative of the expression potential of the reporter construct in each case, as inferred from screening many (typically more than 100) injected embryos. Supplementary Table 2 provides the number of embryos and details of specific expression for all constructs in lamprey. Injection statistics for the transient transgenic zebrafish embryos shown in c are given in Supplementary Table 3. d Frontal sections through the transient transgenic lamprey embryos shown in Fig. 3b, with GFP transcripts detected by in situ hybridisation, revealing expression in NC-derived mesenchyme (arrowheads) in the pharyngeal arches (numbered). Scale bars: 100 µm
Fig. 4
Fig. 4
Characterization of a lamprey hoxα2 neural crest (NC)/hindbrain enhancer. a The mouse Hoxa2-Hoxa3 genomic region and its equivalent from the lamprey hoxα cluster are shown, with Hox gene exons annotated (blue arrows). hoxα2 upstream regions assayed for reporter activity in this study, with or without the c-Fos minimal promoter, are shown. be Lateral views (b, d) and frontal sections (c, e) of st24.5 lamprey embryos, comparing endogenous expression of hoxα2 (b, c) to GFP reporter expression mediated by hoxα2 −4kb (d, e). Pharyngeal arches are numbered and rhombomeric expression detailed. Arrowheads point to PA2 NC expression. f Multiple sequence alignment of the Hoxa2 NC enhancer from gnathostomes with the lamprey hoxα2 enhancer, showing conserved sites (yellow). The positions of characterized mouse cis-elements (Krox20, Sox, RE2-3, NC3) are marked above the alignment. The enhancer schematic (a) shows the position of these elements within the assayed hoxα2 upstream regions, with conserved (shaded boxes) or divergent (empty boxes) cis-elements highlighted. Consensus binding motifs from the JASPAR database for Krox20, Sox11, Meis1, and Pbx-Hox factors are shown below the alignment, as well as sequences deleted in hoxα2 −4kb ΔKrox20 and ΔNC3 variants. The non-aligning interval between these conserved regions is ~250–400 bp and varies in length between species. Supplementary Figure 5 contains the full alignment. gj Lateral (g-i) and dorsal (j) views of st24.5 lamprey embryos showing GFP reporter expression driven by the enhancers detailed in a. Pharyngeal arches are numbered, with expression in rhombomeres (r) and somites (s) annotated. GFP-expressing embryos shown are representative of the expression potential of the reporter construct in each case, as inferred from screening many (typically more than 100) injected embryos. Supplementary Table 2 provides the number of embryos and details of specific expression for all constructs in lamprey
Fig. 5
Fig. 5
Hoxa2 and Hoxb2 neural crest (NC) enhancers are ancient paralogues and the lamprey hoxα2 enhancer appears to reflect the ancestral state. a Sequence alignment of mouse (m) Hoxa2 and Hoxb2 NC enhancers with that of lamprey (l) hoxα2, revealing short conserved sequence blocks (yellow). Corresponding consensus binding motifs for Krox20, Sox, Meis, and Pbx-Hox factors are shown below the alignment. These conserved sequences map to characterized cis-elements required for hindbrain (purple) or NC (green) activity in the mouse Hoxa2 (above) and Hoxb2 (below) enhancers. The 315 and 354 bp refer to the precise distances between the 5′ end of the Krox20 site and the 3′ end of the Pbx-Hox site of the mouse Hoxa2 and Hoxb2 enhancers, respectively. The activity of each NC enhancer in the hindbrain and NC is shown in schematic dorsal views. This activity differs between each enhancer, with hoxα2(l) showing the combined output of Hoxa2(m) and Hoxb2(m). b Multiple sequence alignment of gnathostome Hoxa2 NC enhancers with a homologous region upstream of lamprey hoxδ2. The lamprey hoxα2-hoxα3 and hoxδ2-hoxδ3 genomic loci are depicted, with hox gene exons annotated (blue arrows). The multiple sequence alignment reveals conservation of a Krox20 and a Sox site upstream of hoxδ2 (yellow shading in alignment), but other cis-elements, including NC3, are not conserved in sequence. This is depicted in the enhancer schematic, which details the conserved (shaded boxes) and divergent (empty boxes) cis-elements upstream of hoxδ2
Fig. 6
Fig. 6
Endogenous expression of meisC in neural crest (NC) overlaps with that of hoxα2 in lamprey embryos. a Lateral views (a, c) and frontal sections (b, d) are shown for embryos at st23 (a, b) and st24.5 (c, d). White lines in a and c denote planes of sections in b and d. Pharyngeal arches are numbered, arrows denote expression in NC. Scale bars: 200 μm (a, c); 100 µm (b, d). mb, mid-brain
Fig. 7
Fig. 7
Hoxa2 and Hoxb2 enhancers exhibit differential TALE (Three-Amino-Acid-Loop-Extension) and Hox binding correlating with their tissue-specific activities. a DNA-binding profiles for Hox, TALE, and p300 factors in neural cell culture and pharyngeal arch 2 tissues at the mouse Hoxa2 (NC3) and Hoxb2 (HRE) neural crest (NC) enhancers (highlighted in purple). Genes are annotated (top) and are transcribed from left-to-right. b Summary diagram of characterized differential regulatory inputs (purple arrows) from Hox and TALE factors (inferred from a) into the mouse Hoxa2 and Hoxb2 NC enhancers in pharyngeal arch 2 (NC) and hindbrain r4 in vivo. Activation or inactivation of transcription is depicted by green arrows or a black cross, respectively. Purple arrows from the Hoxa2 gene indicate auto-/cross-regulation
Fig. 8
Fig. 8
Evolutionary model for regulation of Hox2 genes in vertebrates. a A model for evolution of the neural crest (NC) Hox code, based on our data. a NC gene regulatory network (GRN) and NC Hox -code evolved in ancestral vertebrates and are conserved between cyclostomes and gnathostomes. In ancestral vertebrates, Hox2 NC expression was regulated by TALE (Three-Amino-Acid-Loop-Extension) and Hox factors, through a putative ancestral enhancer with shared NC and hindbrain activities. b A model for the divergence of lamprey and mouse Hox2 NC/hindbrain enhancers. Enhancer activity domains are depicted in blue in schematic dorsal views of the hindbrain and pharyngeal arches. Conserved functional motifs (Krox20, Sox, Meis, Pbx-Hox) present upstream of lamprey and mouse Hox2 genes are shown. Lamprey and mouse enhancers show divergent activities. Comparison between expression domains and conserved motifs leads us to suggest that a putative ancestral vertebrate Hox2 enhancer contained cis-elements for r3/r5 expression (Krox20, Sox) and r4/NC expression (Meis, Pbx-Hox).These scenarios assume that duplication events that gave rise to four Hox clusters in early vertebrates occurred prior to the cyclostome/gnathostome split, as the most parsimonious explanation,. However, it is also possible that independent genome duplication events may have occurred in cyclostome and gnathostome lineages (see Holland and Ocampo Daza for a recent discussion)

Similar articles

Cited by

References

    1. Green SA, Simoes-Costa M, Bronner ME. Evolution of vertebrates as viewed from the crest. Nature. 2015;520:474–482. doi: 10.1038/nature14436. - DOI - PMC - PubMed
    1. Le Douarin, N. & Kalcheim, C. The Neural Crest 2nd edn (Cambridge University Press, Cambridge, 1999).
    1. Northcutt R. The new head hypothesis revisited. J. Exp. Zool. B. 2005;304:274–297. doi: 10.1002/jez.b.21063. - DOI - PubMed
    1. Parker, H. J., Pushel, I. & Krumlauf, R. Coupling the roles of Hox genes to regulatory networks patterning cranial neural crest. Dev. Biol.10.1016/j.ydbio.2018.1003.1016 (2018). - PubMed
    1. Gavalas A, Trainor P, Ariza-McNaughton L, Krumlauf R. Synergy between Hoxa1 and Hoxb1: the relationship between arch patterning and the generation of cranial neural crest. Development. 2001;128:3017–3027. - PubMed

Publication types

MeSH terms

Substances

LinkOut - more resources