. 2019 Mar 13;9(1):4325.
doi: 10.1038/s41598-019-39608-1.

Field transcriptome revealed a novel relationship between nitrate transport and flowering in Japanese beech

Affiliations

Field transcriptome revealed a novel relationship between nitrate transport and flowering in Japanese beech

Akiko Satake et al. Sci Rep. .

Abstract

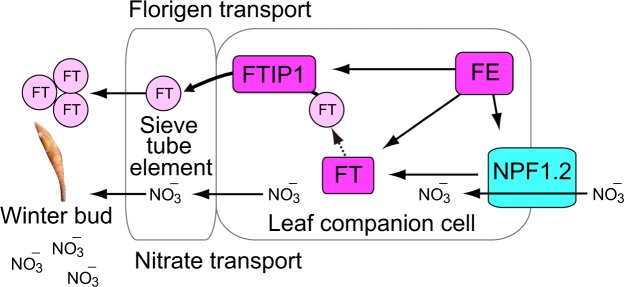
Recent advances in molecular and genetic studies about flowering time control have been increasingly available to elucidate the physiological mechanism underlying masting, the intermittent and synchronized production of a large amount of flowers and seeds in plant populations. To identify unexplored developmental and physiological processes associated with masting, genome-wide transcriptome analysis is a promising tool, but such analyses have yet to be performed. We established a field transcriptome using a typical masting species, Japanese beech (Fagus crenata Blume), over two years, and analyzed the data using a nonlinear time-series analysis called convergent cross mapping. Our field transcriptome was found to undergo numerous changes depending on the status of floral induction and season. An integrated approach of high-throughput transcriptomics and causal inference was successful at detecting novel causal regulatory relationships between nitrate transport and florigen synthesis/transport in a forest tree species. The synergistic activation of nitrate transport and floral transition could be adaptive to simultaneously satisfy floral transition at the appropriate timing and the nitrogen demand needed for flower formation.


Conflict of interest statement

The authors declare no competing interests.

Figures

Figure 1
Figure 1
Locations of two study sites and between-year fluctuation of flowering intensity. (a) Locations of the HG and NB study sites and Japanese beech used in this study. (b) Flowering intensity calculated as the average of the proportion of buds which are reproductive at the HG site (mean ± s.d. of three individuals) and at the NB site (mean ± s.d. of six individuals). When the proportion of buds which are reproductive was greater than 0.4, the year prior to anthesis was assigned as a floral induction year for the tree because floral induction occurs one year prior to anthesis; otherwise, it was assigned as a non-induction year. At the HG site, floral induction occurred in two trees, HG1 and HG2, both in 2014 and 2016. At the NB site, floral induction occurred in three trees, NB1, NB5, and NB6 in 2014. Horizontal arrows indicate the census period for field transcriptome and RT-qPCR, respectively. Vertical arrows stand for the year when floral induction occurred.
Figure 2
Figure 2
Venn diagram of differentially expressed genes (DEGs) and heat map of flowering-time genes in F. crenata. (a) Venn diagram of DEGs between both floral induction status and season. (b) Heat map of differentially expressed flowering-time genes between induction and non-induction years of flowering. The dendrogram of the 14 classification probe sets is shown on the left. (c) Heat map of differentially expressed flowering-time genes between summer and fall. A dendrogram of the 30 classification probe sets is shown on the left. FcCRY1 was highlighted by bold. To draw the heat map, mean signal levels over three individuals were used for each gene. Note that floral induction did not occur in the individual HG3 in 2016.
Figure 3
Figure 3
Phylogenetic relationships of NPF proteins in F. crenata and A. thaliana. The phylogenetic tree was created using the Maximum Likelihood method based of the JTT matrix-based model in MEGA7. All positions containing gaps and missing data were eliminated. The percentages of replicate trees in which the associated taxa clustered together in the bootstrap test (1000 replicates) are shown next to the branches. The numbers in parentheses are DDBJ and GenBank accession numbers (http://www.ddbj.nig.ac.jp).
Figure 4
Figure 4
Heat map of different NPF and NRT2 genes in F. crenata. Heat map of NPF and NRT2 genes in Japanese beech. DEGs between years with and without floral induction were highlighted by squares. To draw the heat map, mean signal levels over three individuals were used for each gene. Note that floral induction did not occur in the individual HG3 in 2016.
Figure 5
Figure 5
Causal gene regulatory network estimated from the CCM. (a) Causal gene regulatory network estimated from the CCM using field transcriptome data. Pink and blue squares represent flowering-time genes and nitrate transporter genes, respectively. Arrows indicate the direction of causal influence. (b) Relative expression levels of FcNFP1.2 and FcFT (mean ± s.d. of three replicates) of three individuals (HG1–HG3) during 2014–2016 at the HG site. An arrow indicates the direction of causal influence. (c) Relative expression levels of FcNFP2.1 and FcFT (mean ± s.d. of three replicates) of six individuals (NB1–NB6) during 2014–2016 at the NB site. An arrow indicates the direction of causal influence.
Figure 6
Figure 6
Summary of predicted causal relationships between flowering-time genes and nitrate transporter genes. Florigen and nitrate are simultaneously transported from leaf companion cells to winter bud where floral organs are developed.

References

    1. Kelly D. The evolutionary ecology of mast seeding. Trends Ecol. Evol. 1994;9:465–470. doi: 10.1016/0169-5347(94)90310-7. - DOI - PubMed
    1. Silvertown JW. The evolutionary ecology of mast seeding in trees. Biol. J. Linn. Soc. 1980;14:235–250. doi: 10.1111/j.1095-8312.1980.tb00107.x. - DOI
    1. Kelly D, Sork VL. Mast Seeding in Perennial Plants: Why, How, Where? Annu. Rev. Ecol. Syst. 2002;33:427–447. doi: 10.1146/annurev.ecolsys.33.020602.095433. - DOI
    1. Herrera CM, Jordano P, Guitián J, Traveset A. Annual Variability in Seed Production by Woody Plants and the Masting Concept: Reassessment of Principles and Relationship to Pollination and Seed Dispersal. Am. Nat. 1998;152:576–594. doi: 10.1086/286191. - DOI - PubMed
    1. Monselise, S. P. & Goldschmidt, E. E. Alternate bearing in fruit trees. Hortic. Rev. (Am. Soc. Hortic. Sci). 4, 10.1002/9781118060773.ch5 (1982).