. 2019 Mar 13;9(1):4389.
doi: 10.1038/s41598-019-39732-y.

B1.12: a novel peptide interacting with the extracellular loop of the EBV oncoprotein LMP1

Affiliations

B1.12: a novel peptide interacting with the extracellular loop of the EBV oncoprotein LMP1

Nihel Ammous-Boukhris et al. Sci Rep. .

Abstract

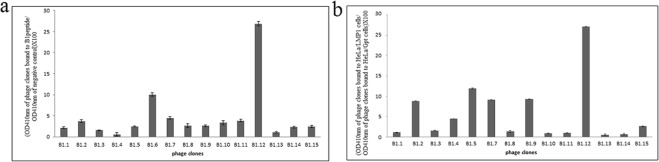
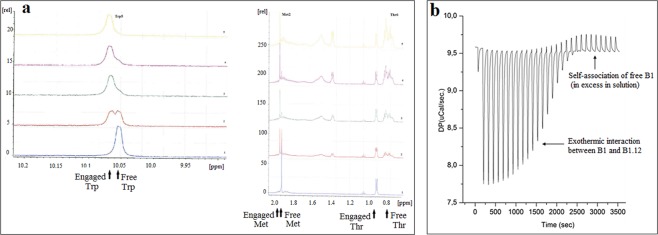
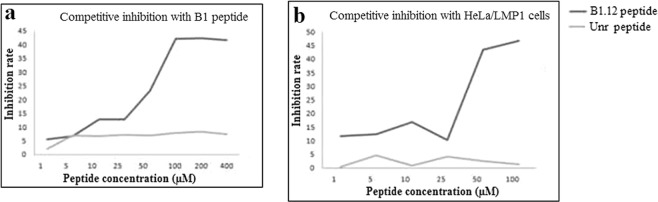
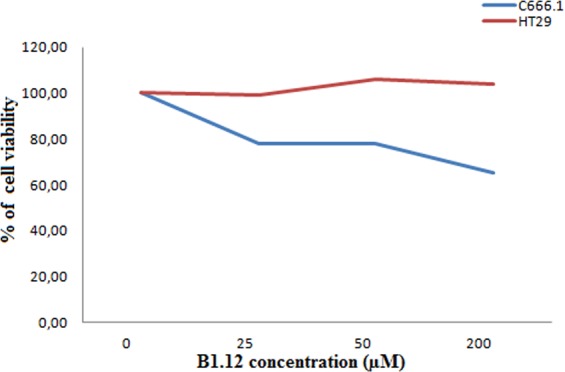
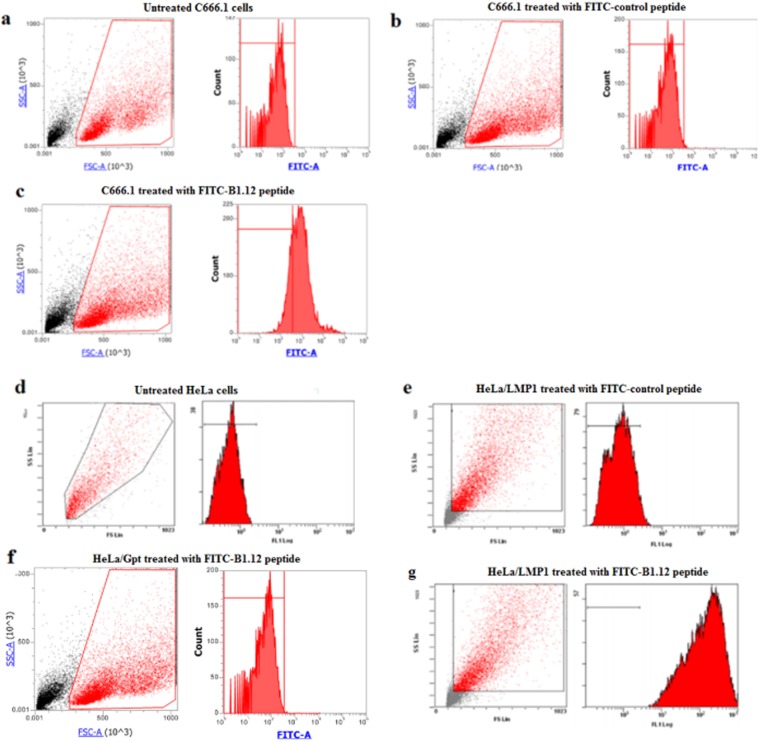
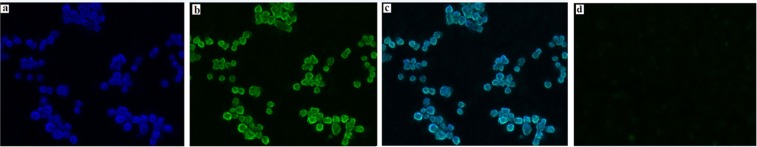
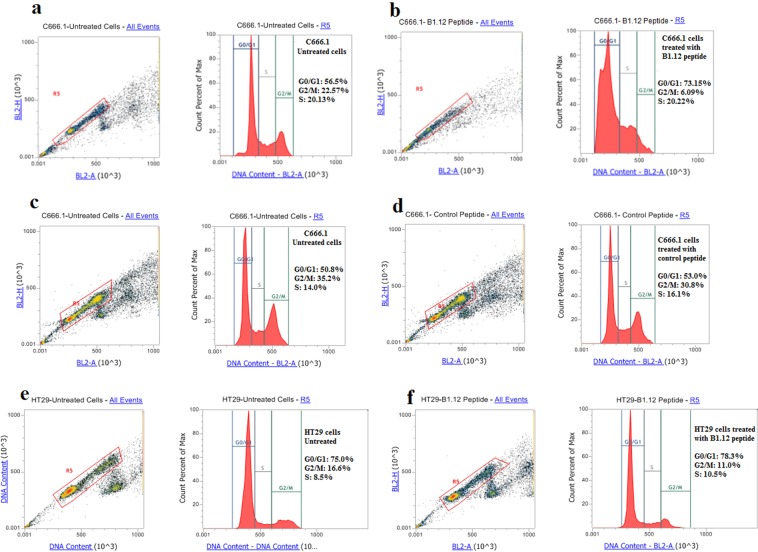
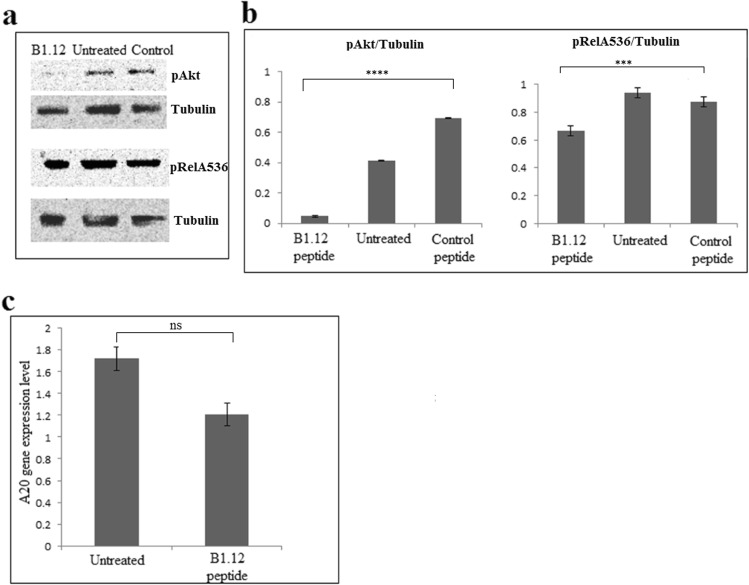
Latent membrane protein 1 (LMP1) encoded by the Epstein-Barr virus (EBV) plays an important role in EBV-induced cell transformation. Down-regulation of the LMP1 expression had shown promising results on cancer cell therapy. In this study, we identified by Phage display a novel peptide called B1.12 (ACPLDLRSPCG) which selectively binds to the extracellular loop (B1) of the LMP1 oncoprotein as demonstrated by molecular docking, NMR and ITC. Using an LMP1 expressing cell line, we showed that B1.12 decreased cell viability, and induced G0/G1 cell cycle arrest. In addition, the expression of A20, pAkt, and pNFkb (pRelA536) in C666-1 cells treated with B1.12 decreased compared to the untreated cells. In conclusion, we selected a novel peptide able to bind specifically to the extracellular loop of LMP1 and thus modulate its oncogenic properties.


Conflict of interest statement

The authors declare no competing interests.

Figures

Figure 1
Figure 1
ELISA performed with 15 individual phage clones randomly picked up from the eluted phage pool after the 3rd round of bio-panning. The B1 peptide (a) or HeLa cell lines (b), were coated and 1010 pfu of each phage were added. Blocking buffer without B1 peptide was used as negative control for (a), and HeLa/Gpt cells were used as negative control for (b). Data represent the binding of the phage clones to the B1 target (a) and HeLa cells (b) as the mean ± SD of three separate experiments.
Figure 2
Figure 2
Chemical shift changes observed in NMR experiment (a). Spectrum from 1 to 5 indicate the different proportions of B1:B1.12 used in titration experiment (1:1; 3:1; 5:1; 7:1; 9:1, respectively). Arrows indicate the engaged and free amino-acids before and after B1/B1.12 interaction. SI: Signal Intensity. ITC profile showing the interaction between the target B1 and the selected peptide B1.12 (b). The figure shows the evolution of the interaction (Exothermic) until all the B1 binding sites were saturated and self-association of B1.12 occurs.
Figure 3
Figure 3
Molecular Docking of the N-terminal domain of LMP1 with the B1.12 peptide. LMP1 model is shown as a yellow ribbon and the B1.12 peptide is shown as a line model. The carbon, oxygen, and nitrogen atoms are colored in green, red, and blue, respectively. Amino acids involved in the interaction are framed in the figure in red for LMP1’s amino acids, and in green for B1.12 amino acids.
Figure 4
Figure 4
Competitive inhibition of the binding of the phage clone B1.12 by its corresponding peptide. This experiment was done with 2 targets: (a) B1 peptide, and (b) HeLa/LMP1 cells. The average inhibition rates at different concentrations of the peptide are shown. Independent experiments were repeated three times.
Figure 5
Figure 5
The cell viability of C666.1 cells treated with different concentrations of B1.12 peptide for 48 hours, and then assessed by MTT. C666.1 cells were incubated with various concentrations (0, 25, 50, and 200 μM) of B1.12 peptide, and cell viability was assessed after 48 h by MTT assay. The cell viability was expressed as a percentage of the viability against untreated cells used as control: % of Viability = (OD590 nm of treated cells/OD590 nm of untreated cells) × 100.
Figure 6
Figure 6
The cellular uptake of FITC-labeled B1.12 by C666.1, and HeLa cells. Panels a, b, and c show flow cytometric histograms of C666.1 cells untreated (a), treated with FITC-labeled control peptide (b), or with FITC-labeled B1.12 peptide (c). Panels d, e, f, and g represent flow cytometric histograms of HeLa cells. (d) Untreated HeLa cells, (e) HeLa/LMP1 cells treated with FITC-labeled control peptide, (f) HeLa/Gpt cells treated with FITC-labeled B1.12 peptide, and (g) HeLa/LMP1 cells treated with FITC-labeled B1.12 peptide.
Figure 7
Figure 7
Immunofluorescence imaging of C666.1 cells. Log phase cells were fixed and stained for (a) LMP1 detection (blue) and (b) 10 µM FITC-labeled B1.12 (green). The merged images demonstrate colocalization of B1.12 and anti-LMP1 antibody signals (c). HeLa/Gpt cells treated with 10 µM FITC-labeled B1.12 served as negative control (d).
Figure 8
Figure 8
Effects of B1.12 treatment on the cell cycle. C666.1 cells were treated for 24 hours with (b) 50 µM B1.12 peptide, (d) 50 µM control peptide, then fixed, stained with propidium iodide and analyzed for DNA content by FACS. Similarly, HT29 cells were treated with B1.12 peptide at the same conditions (f). The untreated cells served as the negative control (a,c and e). The percentage of cells in each cell cycle phase was determined and shown for each sample.
Figure 9
Figure 9
Western blot analysis of pAkt and pRelA/536 expression, in C666.1 cell line treated or not with 100 µM of B1.12 peptide or with 100 µM control peptide (a). Histograms representing the ratios pAkt/Tubulin and pRelA536/Tubulin expression are shown in (b). Density quantification of each band was assessed by the ‘image-j’ software. Data are represented as mean ± SD (n = 4 biological replicates), and P-value was evaluated by one-way ANOVA test, ***P = 0.0006, and ****P < 0.0001. Expression level of A20 in both B1.12-treated and untreated C666.1 cells are represented in (c). Data are represented as mean ± SD (n = 3 biological replicates), and P-value was evaluated by two-tailed Mann-Whitney u test (P = 0.1). ns: non significant.

References

    1. Krumpe LRH, Mori T. The Use of Phage-Displayed Peptide Libraries to Develop Tumor-Targeting Drugs. International Journal of Peptide Research and Therapeutics. 2006;12:79–91. doi: 10.1007/s10989-005-9002-3. - DOI - PMC - PubMed
    1. Yu L, et al. Phage display screening against a set of targets to establish peptide-based sugar mimetics and molecular docking to predict binding site. Bioorganic & medicinal chemistry. 2009;17:4825–4832. doi: 10.1016/j.bmc.2009.03.054. - DOI - PubMed
    1. Zhang D, et al. A CD44 specific peptide developed by phage display for targeting gastric cancer. Biotechnology letters. 2015;37:2311–2320. doi: 10.1007/s10529-015-1896-z. - DOI - PubMed
    1. Zhou C, Kang J, Wang X, Wei W, Jiang W. Phage display screening identifies a novel peptide to suppress ovarian cancer cells in vitro and in vivo in mouse models. BMC cancer. 2015;15:889. doi: 10.1186/s12885-015-1891-8. - DOI - PMC - PubMed
    1. Ma C, et al. Screening of a specific peptide binding to esophageal squamous carcinoma cells from phage displayed peptide library. Molecular and cellular probes. 2015;29:182–189. doi: 10.1016/j.mcp.2015.04.001. - DOI - PubMed

Substances