. 2019 Mar 13;9(1):4379.
doi: 10.1038/s41598-019-40714-3.

Conditional knockout of UBC13 produces disturbances in gait and spontaneous locomotion and exploration in mice

Affiliations

Conditional knockout of UBC13 produces disturbances in gait and spontaneous locomotion and exploration in mice

David F Wozniak et al. Sci Rep. .

Abstract

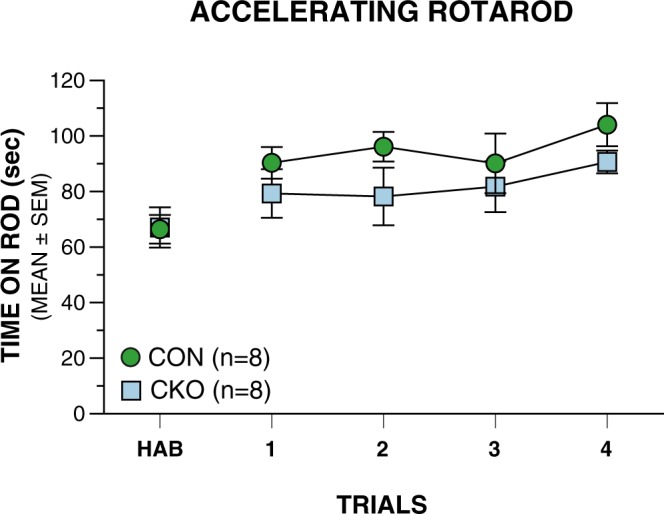
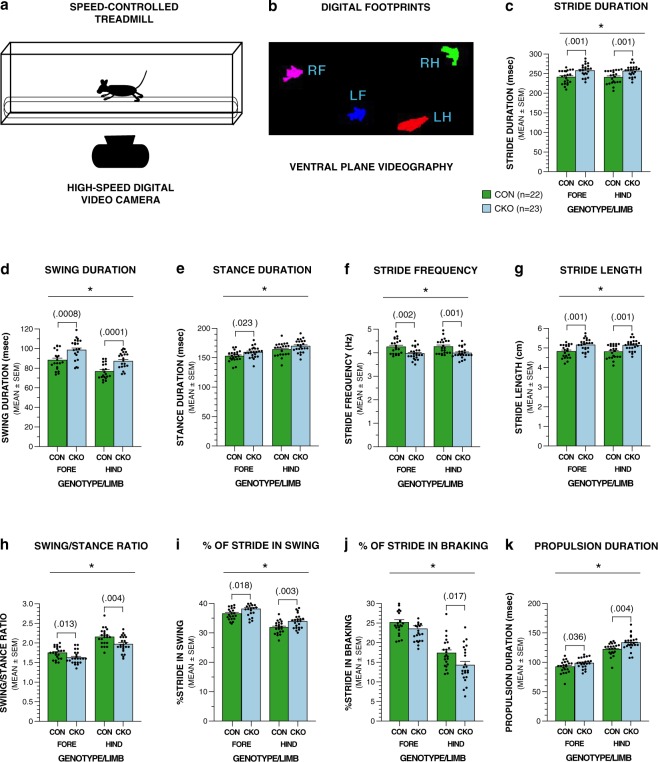
Here we have characterized the functional impairments resulting from conditional knockout of the ubiquitin-conjugating E2 enzyme (UBC13) in rodent cerebellar granule neurons, which greatly increases the parallel fiber presynaptic boutons and functional parallel fiber/Purkinje cell synapses. We report that conditional UBC13 knockout mice exhibit reliable deficits on several gait-related variables when their velocity of ambulation is tightly controlled by a moving treadmill and by restricting space for movement. Selected gait parameters and movement patterns related to spontaneous exploration in an open field may also be affected in conditional UBC13 knockout mice. Analysis of open-field data as a function of test session half using force-plate actometer instrumentation suggest that conditional UBC13 knockout mice have alterations in emotionality, possibly affecting gait and movement variables. These findings suggest that conditional UBC13 knockout mice represent a valuable platform for assessing the effects of disturbances in cerebellar granule cell circuitry on gait and other aspects of locomotion. Also, the possibility that psychological factors such as altered emotionality may impact gait and movement patterns in these mice suggest that these mice may provide a useful model for evaluating analogous behavioral impairments in autism spectrum disorders and other neurodevelopmental syndromes associated with deregulation of ubiquitin signaling.


Conflict of interest statement

The authors declare no competing interests.

Figures

Figure 1
Figure 1
UBC13 conditional knockout (CKO) mice show a trend toward impairment on the accelerating rotarod relative to the littermate control (CON) group across 4 days of test trials  (genotype effect: p = 0.061) but these differences are not statistically significant.
Figure 2
Figure 2
UBC13 CKO mice show significant performance deficits relative to littermate controls on gait-related variables when tested on the DigiGait procedure using a treadmill belt speed of 20 cm/s. (a) The DigiGait procedure involved having mice ambulate on a translucent treadmill (a) at controlled speeds (20 and 30 cm/s) on P27 or P28 to assess gait dynamics. (b) Ventral plane videography was used to acquire digital images of the ventral surfaces of the paws of each mouse at 150 frames/sec as it ambulated on the treadmill, with these images being used to derive several gait-related metrics. (ck) Results from repeated measures (rm) ANOVAs conducted on the 20 cm/s treadmill speed data revealed significant (*) genotype effects signifying impaired performance in the UBC13 conditional knockout (CKO) mice compared to the littermate control (CON) group for (c) stride duration (*p = 0.001), (d) swing duration (*p = 0.0002), (e) stance duration (*p = 0.037), (f) stride frequency (*p = 0.001), (g) stride length (*p = 0.001), (h) swing-to-stance ratio (*p = 0.003), (i)% of stride in swing (*p = 0.003), (j) % of stride in braking (*p = 0.018), and (k) propulsion duration (*p = 0.004). Pair-wise comparisons were conducted following the finding of significant genotype effects and “p” values for the significant comparisons involving the forelimbs and/or hindlimbs are shown in brackets above the bars in the graphs. Dot plots representing the raw data are superimposed on the bar graphs.
Figure 3
Figure 3
UBC13 CKO mice also exhibit deficits on several gait-related variables when tested on the DigiGait procedure using a higher treadmill belt speed (30 cm/s). If the UBC13 CKO and CON mice successfully completed tested on the DigiGait procedure using a belt speed of 20 cm/s, they were given additional trials at 30 cm/s. (ai) Results from rmANOVAs conducted on the 30 cm/s treadmill speed data revealed significant genotype effects (*) or genotype x limb interactions () signifying impaired performance in the UBC13 CKO mice compared to the CON group for (a) stride duration (*p = 0.0006), (b) swing duration (*p = 0.0001; p = 0.006), (c) stance duration (p = 0.008), (d) stride frequency (*p = 0.0009), (f) swing-to-stance ratio (*p = 0.006; p = 0.001), (g) % of stride in swing (*p = 0.007; p = 0.002), (h) % of stride in braking (p = 0.039). Pair-wise comparisons were conducted following the finding of significant genotype effects and/or genotype x limb interactions, and “p” values for the significant comparisons involving the forelimbs and/or hindlimbs are shown in brackets above the bars in the graphs, and dot plots of the raw data are superimposed on the graphs. No significant effects involving genotype were found for stride length (e) or propulsion duration (i).
Figure 4
Figure 4
UBC13 CKO mice display impaired performance on gait-related measures during spontaneously-occurring ambulation compared to littermate controls when tested on the force-plate actometer/open field apparatus (FPA/OF) on P29-P31 for one, 20-min session. (a) Force-time waveforms from a representative control mouse across 10 bouts (#) of trotting in the first and 10 in the second halves of the testing session are shown illustrating the kind of information used to extract certain gait-related parameters from continuously-recorded ground reaction forces. Note the general changes in the waveforms between bouts of trotting during the first and second session halves. See Supplementary Table 1 showing values for variables extracted from these force-time waveforms. (be) Analysis of data extracted from the force-time profiles from each mouse were used to quantify several gait-related variables including velocity, stride length, stride frequency, and within-run force range. (b) A significant genotype x session half interaction was found for movement velocity (p = 0.030), but both the UBC13 CKO and CON littermates each significantly increased their velocities across session halves (**p = 0.0002 and ††p < 0.00005, respectively), although the CON group showed a greater percent increase (#p = 0.046). (c) A significant genotype effect (*p < 0.05) and genotype x session half interaction (p = 0.003) were found for stride length, which appears mostly due to UBC13 CKO mice having significantly longer stride lengths than the CON group for the first session half. Also, the stride lengths of the CON mice were greater in the second session half (**p = 0.0005), while those of the UBC13 CKO mice were not. (d) Both the UBC13 CKO and CON groups exhibited significant increases in stride frequency in the second session half relative to the first half although no significant effects involving genotype were observed (**p < 0.00005 and ††p < 0.00005, respectively). (e) A significant genotype x session half interaction (p < 0.00005) was found for the within-run force range data, which appears to be mostly due to the CON group showing significantly increased levels during the second half of the test session (**p < 0.00005) while those of the UBC13 CKO mice were unchanged across session halves, and no group differences were observed for either half session.
Figure 5
Figure 5
“Time on task” (test session half) effects on open-field behaviors suggest possible alterations in emotionality in UBC13 CKO mice. No significant effects involving genotype were found for either distance traveled (a) or low mobility bouts (b), although the UBC13 CKO and CON groups each showed significant decreases in distance traveled during the second test session half versus the first, with corresponding increases observed in low mobility bouts for the second session half versus the first (**p < 0.00005 and ††p < 0.00005, respectively for each variable). (c) However, a significant genotype x session half interaction (p < 0.00005), was observed for the thigmotaxis data, being mostly due to the CON mice staying closer to the nearest wall during the first session half, but farther away in the second session half compared to the UBC13 CKO group. Nevertheless, a general reduction in thigmotaxis across session halves was observed for both the UBC13 CKO and CON groups, each showing significantly decreased distances away from the nearest wall during the second session half relative to the first (**p = 0.0002, ††p < 0.00005, respectively). Importantly, a significantly greater percentage change in thigmotaxis was exhibited by the CON mice compared to the UBC13 CKO group (#p = 0.015) across session halves, suggesting that the two groups differed in their emotional response in habituating to the test environment, with the UBC13 CKO mice being less responsive. (d) Run trajectories (ambulatory paths) from a control mouse are shown in the top row. These trajectories represent all tracks recorded (all movements in the x-y plane) during the two session halves and depict overall differences between the halves, and the proclivity of the mouse to remain near the chamber wall during the first half, which decreases in the second. Trajectories in the bottom row are from the first 10 tracks (left) and last 10 tracks (right) of movements that qualify as trots (runs) showing thigmotaxis being exhibited while the mouse was locomoting, thus demonstrating that low mobility bouts (sleeping or staying in one place near the wall) did not totally account for avoidance of the center of the field (first half), which decreases across session halves.

Similar articles

Cited by

References

    1. Glessner JT, et al. Autism genome-wide copy number variation reveals ubiquitin and neuronal genes. Nature. 2009;459:569–573. doi: 10.1038/nature07953. - DOI - PMC - PubMed
    1. Lehman NL. The ubiquitin proteasome system in neuropathology. Acta Neuropathol. 2009;118:329–347. doi: 10.1007/s00401-009-0560-x. - DOI - PMC - PubMed
    1. Kishino T, Lalande M, Wagstaff J. UBE3A/E6-AP mutations cause Angelman syndrome. Nat. Genet. 1997;15:70–73. doi: 10.1038/ng0197-70. - DOI - PubMed
    1. Valnegri P, et al. RNF8/UBC13 ubiquitin signaling suppresses synapse formation in the mammalian brain. Nat. Commun. 2017;8:1271. doi: 10.1038/s41467-017-01333-6. - DOI - PMC - PubMed
    1. Altman, J. & Bayer, S. A. Development of the cerebellar system: in relation to its evolution, structure, and functions. pp. 783 (CRC Press, Boca Raton, 1997).

Publication types

Substances