. 2019 Mar 13;9(1):4373.
doi: 10.1038/s41598-019-40760-x.

Hexamethylene bisacetamide impairs NK cell-mediated clearance of acute T lymphoblastic leukemia cells and HIV-1-infected T cells that exit viral latency

Affiliations

Hexamethylene bisacetamide impairs NK cell-mediated clearance of acute T lymphoblastic leukemia cells and HIV-1-infected T cells that exit viral latency

Erica Giuliani et al. Sci Rep. .

Abstract

The hexamethylene bisacetamide (HMBA) anticancer drug was dismissed due to limited efficacy in leukemic patients but it may re-enter into the clinics in HIV-1 eradication strategies because of its recently disclosed capacity to reactivate latent virus. Here, we investigated the impact of HMBA on the cytotoxicity of natural killer (NK) cells against acute T lymphoblastic leukemia (T-ALL) cells or HIV-1-infected T cells that exit from latency. We show that in T-ALL cells HMBA upmodulated MICB and ULBP2 ligands for the NKG2D activating receptor. In a primary CD4+ T cell-based latency model, HMBA did not reactivate HIV-1, yet enhanced ULBP2 expression on cells harboring virus reactivated by prostratin (PRO). However, HMBA reduced the expression of NKG2D and its DAP10 adaptor in NK cells, hence impairing NKG2D-mediated cytotoxicity and DAP10-dependent response to IL-15 stimulation. Alongside, HMBA dampened killing of T-ALL targets by IL-15-activated NK cells and impaired NK cell-mediated clearance of PRO-reactivated HIV-1+ cells. Overall, our results demonstrate a dominant detrimental effect of HMBA on the NKG2D pathway that crucially controls NK cell-mediated killing of tumors and virus-infected cells, providing one possible explanation for poor clinical outcome in HMBA-treated cancer patients and raising concerns for future therapeutic application of this drug.


Conflict of interest statement

The authors declare no competing interests.

Figures
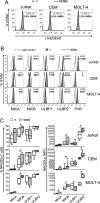
Figure 1
Figure 1
HMBA induces NKG2DL expression on leukemia T cells. Three T lymphoblastoid cell lines, Jurkat, CEM and MOLT-4, were cultivated for 18 h in medium alone (not treated, nt) or in the presence of 5 mM HMBA and then analyzed by flow cytometry to evaluate cell viability and measure the cell-surface expression of NKG2DLs and PVR. (A) The percentage of DEAD+ cells among nt (filled grey histograms, grey percentages) and treated cells (open histograms, black percentages) is shown. (B) Histograms show the fluorescence distribution of cells labeled with mAbs against MICA, MICB, ULBP1, ULBP2, and PVR in a representative experiment. Dashed line, filled gray histogram, and solid line represent staining with isotype control IgG, nt, and HMBA-treated cells, respectively. The MFI values for nt cells (gray) and HMBA-treated cells (black) are indicated. (C) NKG2DL expression, both % of positive cells and MFI, was determined as shown in panel A in 3 independent experiments. Whiskers box analysis shows median (bar), 25th–75th percentile (box), and minimum and maximum (vertical lines) values. *P < 0.05 by Wilcoxon matched-pairs test.
Figure 2
Figure 2
HMBA downmodulates NKG2D on NK cells. (A) The purity of NK cells isolated from PBMCs was examined by flow cytometry measuring the frequency of CD3CD56+CD16+/− cells. (B,C) NK cells were cultured for 18 h in medium alone (nt) or supplemented with 5 mM HMBA and examined for the expression of various markers: (B) the percentage of DEAD+, CD69+ and CD107a+ NK cells among nt (filled grey histograms, grey percentages) and treated cells (open histograms, black percentages) is shown together with control IgG signal (dashed line) for a representative experiment; (C) both the % of positive cells and MFI for NKG2D, DNAM-1, NKp46, NKp44, NKp30, and CD16 are shown for NK cells nt and treated with HMBA and/or 12.5 ng/ml of IL-15. Experiments were performed with at least 5 independent donors. Bars represent mean ± SEM. *P < 0.05, **P < 0.01, ***P < 0.001 by two-tailed paired t test.
Figure 3
Figure 3
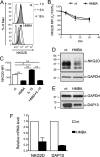
HMBA affects NKG2D and DAP10 expression. (A) Cell-surface NKG2D expression on NK cells at various time points following HMBA treatment. Histograms show NK cells treated or not (nt) with 5 mM HMBA for 1 h (solid line), 6 h (dashed line) and 18 h (filled grey histograms) in one representative experiment out of three. (B) Kinetics of NKG2D internalization in NK cells treated or not with HMBA for 18 h. Mean ± SEM values of NKG2D MFI were calculated over time with respect to initial expression (set to 100%) in 3 independent experiments. (C) Intracellular NKG2D expression was measured in permeabilized NK cells following 18 h treatment with HMBA and 12.5 ng/ml of IL-15, either alone or in combination, as compared to nt cells. NKG2D MFI (mean ± SEM) in 3 independent experiments is shown. *P < 0.05, **P < 0.01 by two-tailed paired t test. (D,E) Equal amounts of total cellular lysate of NK cells treated or not with HMBA for 18 h were analyzed by western blotting with anti-NKG2D (D) or anti-DAP10 (E) antibodies as well as with anti-GAPDH mAb to confirm equal protein loading. Molecular mass standards (kDa) are indicated. One representative of four independent experiments is shown. Uncropped blots are presented in Supplementary Fig. S1. (F) Relative NKG2D and DAP10 mRNA levels in NK cells treated with HMBA compared with control nt cells was measured by Real-time qPCR. Shown are mean ± SEM from three independent experiments performed in triplicate.
Figure 4
Figure 4
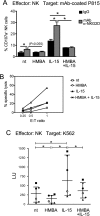
Impact of HMBA on NK-cell cytotoxicity. (A) A redirected antibody-dependent degranulation assay was performed with PBMCs cultivated for 18 h in medium alone (nt) or in the presence of 5 mM HMBA and/or 12.5 ng/ml IL-15. PBMCs were incubated for 6 h with P815 cells loaded with anti-NKG2D (α-NKG2D) mAb or control IgG in a re-directed degranulation assay. Then, cells were stained and analyzed by flow cytometry for the expression of CD107a on gated NK cells. The mean ± SEM percentage of CD107a+ NK cells measured in 3 independent experiments is shown. *P < 0.05 by two-tailed paired t test. (B,C) NK cells cultivated for 18 h without stimuli (nt), with HMBA and/or IL-15 were tested for cytotoxicity against K562 cell targets at different E:T ratio. (B) The percent specific lysis of a representative experiment out of 6 is shown. (C) The NK cell-mediated lysis measured in 6 independent experiments was converted in lytic units (LU, median and interquartile range). Each symbol represents 1 donor. *P < 0.05 by Wilcoxon matched-pairs test.
Figure 5
Figure 5
HMBA inhibits NK cell-mediated killing of leukemia T cells. (A,B) NK cells either treated with HMBA (EHMBA) or not treated (Ent) were used as effectors at various E:T ratio in a 4 h cytotoxicity assay against Jurkat, CEM and MOLT-4 target cells that have been as well exposed (THMBA) or not to HMBA (Tnt). (A) The percent specific lysis of a representative experiment out of 3 is shown. Results obtained with untreated NK cells (Ent) pre-incubated with saturating amounts of anti-NKG2D blocking mAb (α-NKG2D) and tested against Tnt are also shown. (B) Data are expressed as specific lysis inhibition at E:T ratio of 1:1 relative to Ent:Tnt lysis set at 100% (mean ± SEM, n = 3).
Figure 6
Figure 6
HMBA synergizes with PRO at upregulating ULBP2 on HIV-1-infected T cells that exit from viral latency. (AD) To establish viral latency, freshly isolated CD4+ T cells were cultivated in the presence of CCL19 for 1–3 days, infected or not with HIV-1, and further cultured for 3 days, as described in details in Materials and Methods. Then, cells were treated with 5 mM HMBA or 1 μM PRO, alone or in combination, stimulated with 10 μg/ml PHA or not stimulated (ns), further cultivated for 3 days and finally analyzed by 2-color flow cytometry for the expression of intracellular p24 and cell-surface ULBP2. (A) Representative dot plots show the frequency of reactivated p24+ cells gated by setting non-infected PHA-stimulated control cells at 0%. (B) Percentage of p24+ cells was determined as shown in panel A in three independent experiments and normalized to HIV-infected PHA-treated cultures (mean ± SEM). Each symbol represents 1 donor. (C) Histograms show ULBP2 fluorescence on gated p24 (top panels) and p24+ (bottom panels) cell populations measured in a representative experiment on ns, HMBA-, PRO-, and HMBA + PRO-stimulated cell samples. Signals obtained with control IgG (filled histograms) and the percentage of ligand-positive cells are shown. (D) ULBP2 expression (mean ± SEM), both % of positive cells and MFI, was determined in p24 (grey bars) and p24+ (black bars) cells as shown in panel C in 3 independent experiments. *P < 0.05 by two-tailed paired t test.
Figure 7
Figure 7
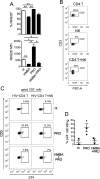
HMBA impairs the capacity of NK cells to suppress latently HIV-infected CD4+ T cells harboring PRO-reactivated virus. (A) The expression of NKG2D on NK cells not treated or exposed to HMBA, PRO, or HMBA + PRO for 18 h was measured as % of positive cells and NKG2D MFI (mean ± SEM, n = 3). (BD) A co-culture assay of latently infected CD4+ T cells at day 2 post-stimulation with 1 μM PRO alone or in combination with 5 mM HMBA and autologous NK cells at a 1:1 E:T ratio was performed overnight (18 h) in the presence of the same drug(s). Then, cells were analyzed to measure the frequency of p24+ cells among gated CD3+ targets and calculate % reduction of 24+ targets by NK cells. (B) The CD3+ cell gate was set on cultures of targets alone, so that effectors cells were excluded, as shown in control cultures of effectors alone as well as in co-cultures of targets and effectors in a representative experiment. (C) A representative set of results for nt, PRO-, and HMBA + PRO-exposed cultures is shown. (D) The NK cell mediated clearance of p24+ cells was measured in 3 independent experiments and expressed as % 24+ killing (mean ± SEM) as described in Materials and Methods. Each symbol represents 1 donor. *P < 0.05, **P < 0.01 by two-tailed paired t test.

Similar articles

Cited by

References

    1. Lanier LL. NK cell recognition. Annu. Rev. Immunol. 2005;23:225–274. doi: 10.1146/annurev.immunol.23.021704.115526. - DOI - PubMed
    1. Bachanova V, Miller JS. NK cells in therapy of cancer. Crit. Rev. Oncog. 2014;19:133–141. doi: 10.1615/CritRevOncog.2014011091. - DOI - PMC - PubMed
    1. Rezvani K, Rouce RH. The Application of Natural Killer Cell Immunotherapy for the Treatment of Cancer. Front. Immunol. 2015;6:578. doi: 10.3389/fimmu.2015.00578. - DOI - PMC - PubMed
    1. Koehl U, et al. Advances in clinical NK cell studies: Donor selection, manufacturing and quality control. Oncoimmunology. 2015;5:e1115178. doi: 10.1080/2162402X.2015.1115178. - DOI - PMC - PubMed
    1. Veluchamy JP, et al. The Rise of Allogeneic Natural Killer Cells As a Platform for Cancer Immunotherapy: Recent Innovations and Future Developments. Front. Immunol. 2017;8:631. doi: 10.3389/fimmu.2017.00631. - DOI - PMC - PubMed

Publication types

MeSH terms