

Loss of the Polycomb group protein Rnf2 results in derepression of tbx-transcription factors and defects in embryonic and cardiac development
- PMID: 30867528
- PMCID: PMC6416260
- DOI: 10.1038/s41598-019-40867-1
Loss of the Polycomb group protein Rnf2 results in derepression of tbx-transcription factors and defects in embryonic and cardiac development
Abstract
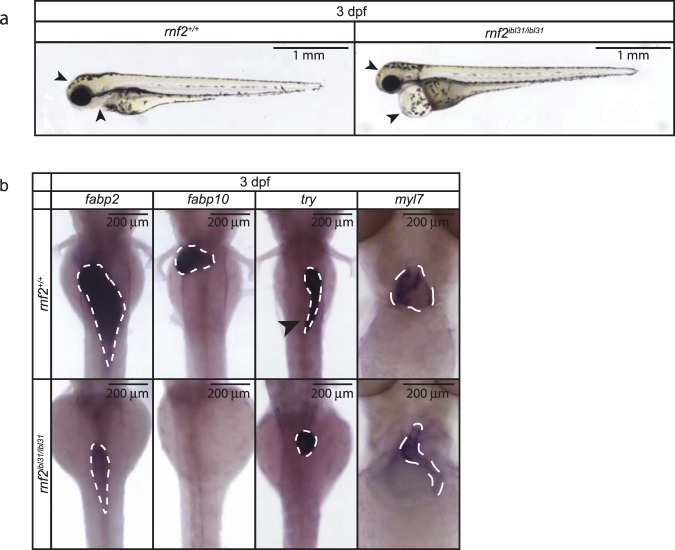
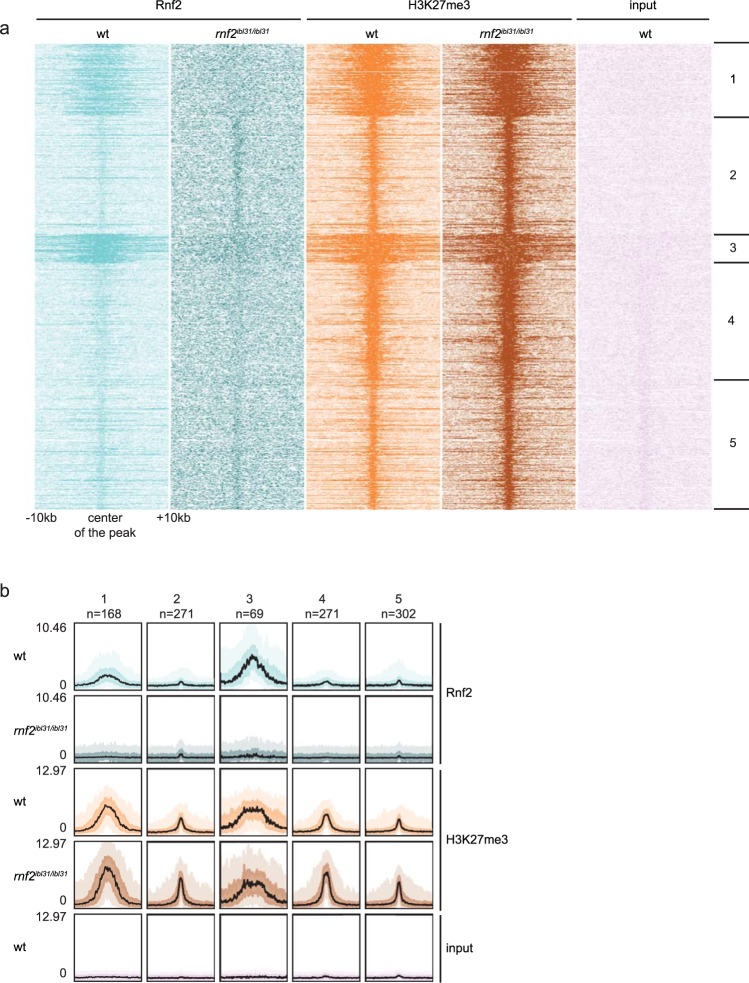
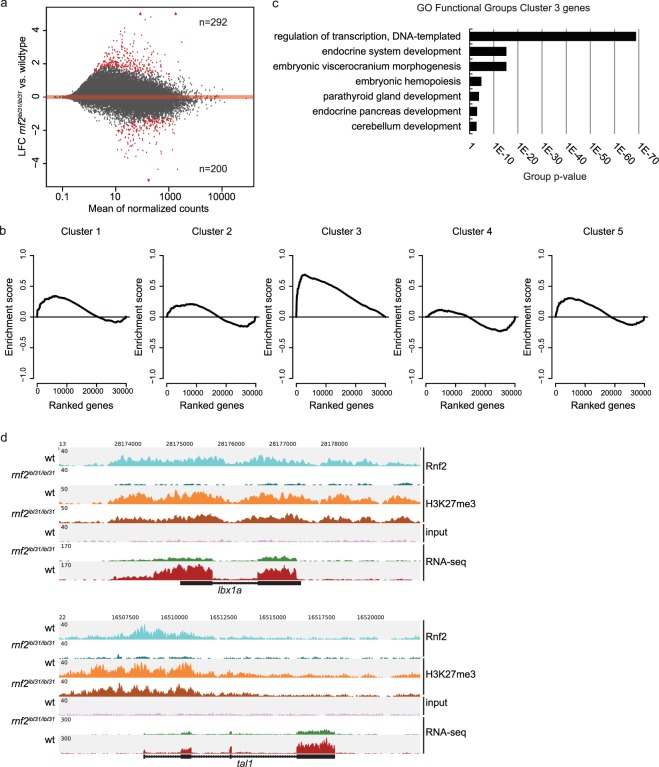
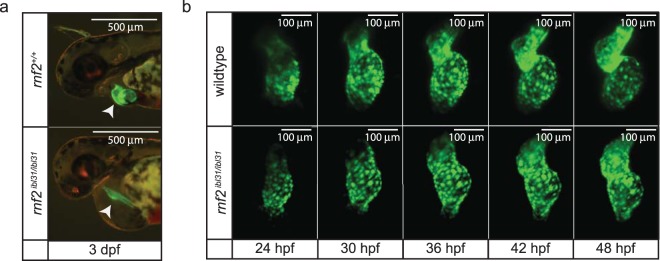
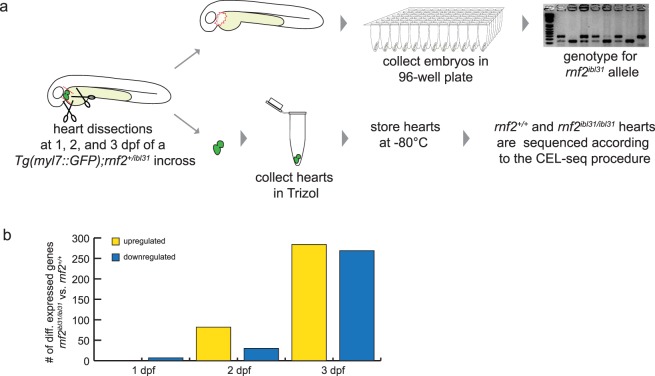
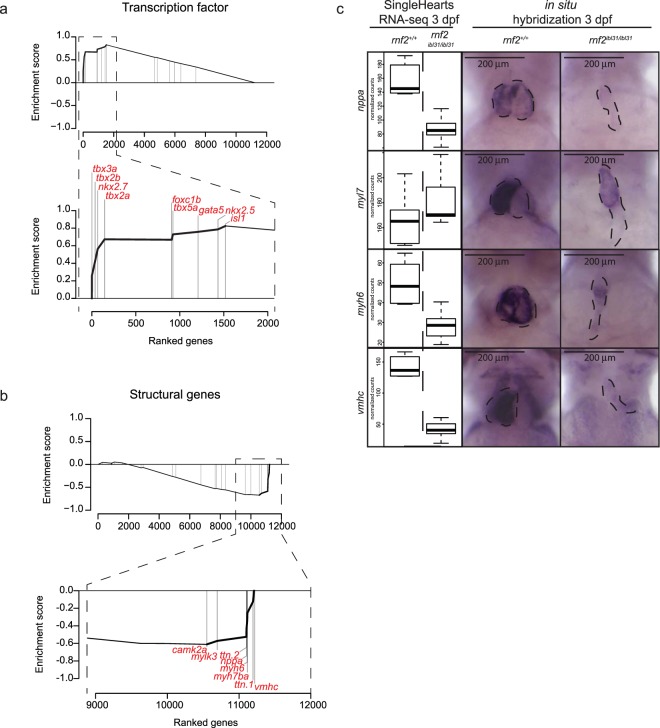
The Polycomb group (PcG) protein family is a well-known group of epigenetic modifiers. We used zebrafish to investigate the role of Rnf2, the enzymatic subunit of PRC1. We found a positive correlation between loss of Rnf2 and upregulation of genes, especially of those whose promoter is normally bound by Rnf2. The heart of rnf2 mutants shows a tubular shaped morphology and to further understand the underlying mechanism, we studied gene expression of single wildtype and rnf2 mutant hearts. We detected the most pronounced differences at 3 dpf, including upregulation of heart transcription factors, such as tbx2a, tbx2b, and tbx3a. These tbx genes were decorated by broad PcG domains in wildtype whole embryo lysates. Chamber specific genes such as vmhc, myh6, and nppa showed downregulation in rnf2 mutant hearts. The marker of the working myocard, nppa, is negatively regulated by Tbx2 and Tbx3. Based on our findings and literature we postulate that loss of Rnf2-mediated repression results in upregulation and ectopic expression of tbx2/3, whose expression is normally restricted to the cardiac conductive system. This could lead to repression of chamber specific gene expression, a misbalance in cardiac cell types, and thereby to cardiac defects observed in rnf2 mutants.
Conflict of interest statement
The authors declare no competing interests.
Figures
Similar articles
-
PRC1 Stabilizes Cardiac Contraction by Regulating Cardiac Sarcomere Assembly and Cardiac Conduction System Construction.Int J Mol Sci. 2021 Oct 21;22(21):11368. doi: 10.3390/ijms222111368. Int J Mol Sci. 2021. PMID: 34768802 Free PMC article.
-
Heart chamber size in zebrafish is regulated redundantly by duplicated tbx2 genes.Dev Dyn. 2011 Jun;240(6):1548-57. doi: 10.1002/dvdy.22622. Epub 2011 Mar 29. Dev Dyn. 2011. PMID: 21448936 Free PMC article.
-
The mediator complex subunit Med10 regulates heart valve formation in zebrafish by controlling Tbx2b-mediated Has2 expression and cardiac jelly formation.Biochem Biophys Res Commun. 2016 Sep 2;477(4):581-588. doi: 10.1016/j.bbrc.2016.06.088. Epub 2016 Jun 22. Biochem Biophys Res Commun. 2016. PMID: 27343557
-
The polycomb group protein ring1b/rnf2 is specifically required for craniofacial development.PLoS One. 2013 Sep 11;8(9):e73997. doi: 10.1371/journal.pone.0073997. eCollection 2013. PLoS One. 2013. PMID: 24040141 Free PMC article.
-
Unique roles of microRNA140 and its host gene WWP2 in cartilage biology.J Musculoskelet Neuronal Interact. 2008 Oct-Dec;8(4):321-2. J Musculoskelet Neuronal Interact. 2008. PMID: 19147957 Free PMC article. Review. No abstract available.
Cited by
-
Clinical significance of ring finger protein 2 high expression in skin squamous cell carcinoma.Oncol Lett. 2020 Aug;20(2):1111-1118. doi: 10.3892/ol.2020.11666. Epub 2020 May 22. Oncol Lett. 2020. PMID: 32724350 Free PMC article.
-
Pcgf1 Regulates Early Neural Tube Development Through Histone Methylation in Zebrafish.Front Cell Dev Biol. 2021 Jan 26;8:581636. doi: 10.3389/fcell.2020.581636. eCollection 2020. Front Cell Dev Biol. 2021. PMID: 33575252 Free PMC article.
-
Genetic and Epigenetic Control of Heart Development.Cold Spring Harb Perspect Biol. 2020 Jul 1;12(7):a036756. doi: 10.1101/cshperspect.a036756. Cold Spring Harb Perspect Biol. 2020. PMID: 31818853 Free PMC article. Review.
-
The Polycomb group gene rnf2 is essential for central and enteric neural system development in zebrafish.Front Neurosci. 2022 Sep 1;16:960149. doi: 10.3389/fnins.2022.960149. eCollection 2022. Front Neurosci. 2022. PMID: 36117635 Free PMC article.
-
Congenital Heart Diseases: Recent Insights into Epigenetic Mechanisms.Cells. 2025 May 31;14(11):820. doi: 10.3390/cells14110820. Cells. 2025. PMID: 40497996 Free PMC article. Review.
References
Publication types
MeSH terms
Substances
LinkOut - more resources
Full Text Sources
Molecular Biology Databases
