. 2019 Apr;568(7753):505-510.
doi: 10.1038/s41586-019-1058-x. Epub 2019 Mar 13.

New insights from uncultivated genomes of the global human gut microbiome

Affiliations

New insights from uncultivated genomes of the global human gut microbiome

Stephen Nayfach et al. Nature. 2019 Apr.

Abstract

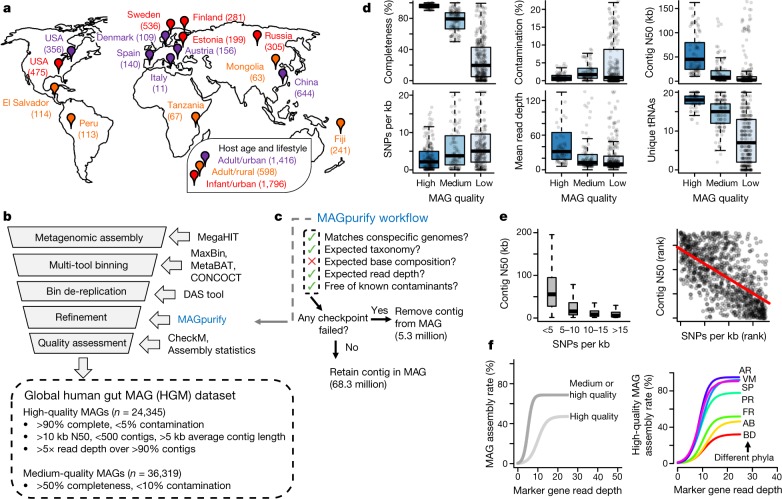
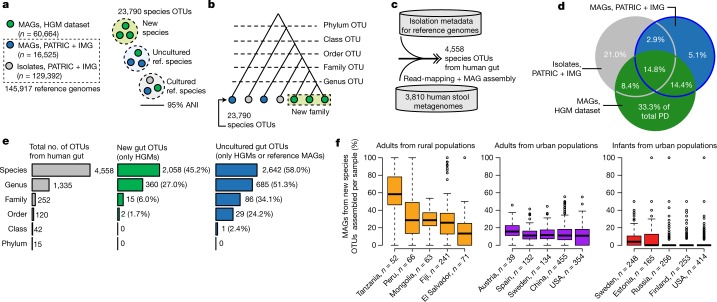
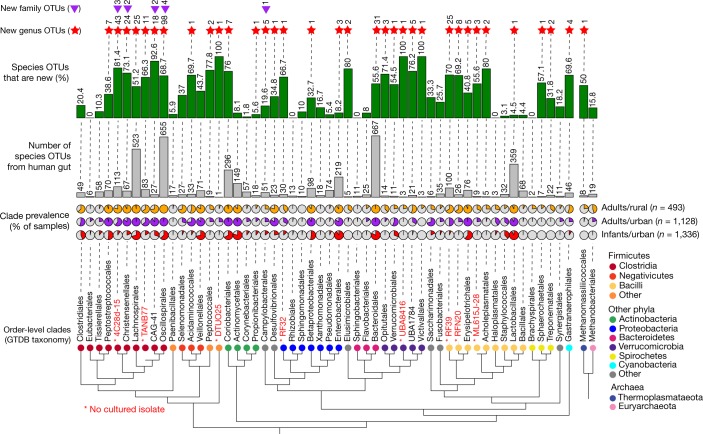
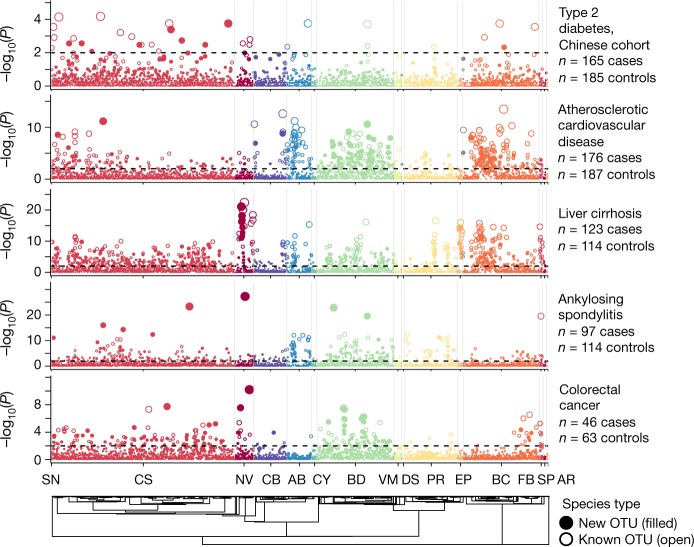
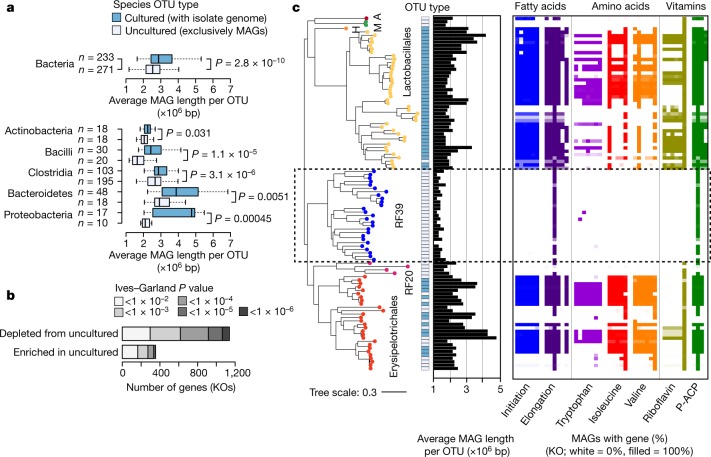
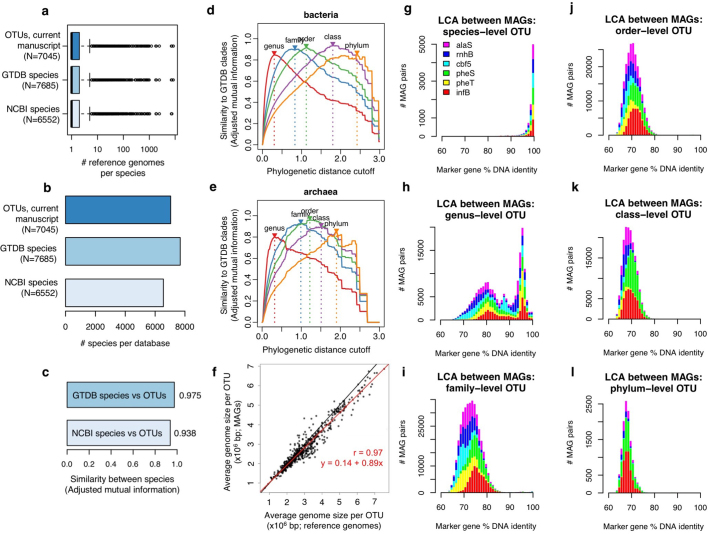
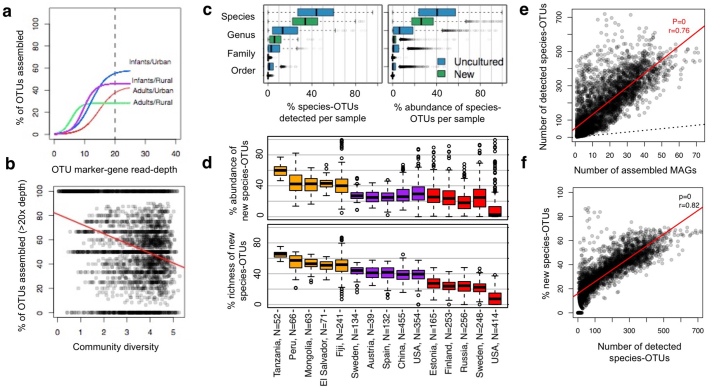
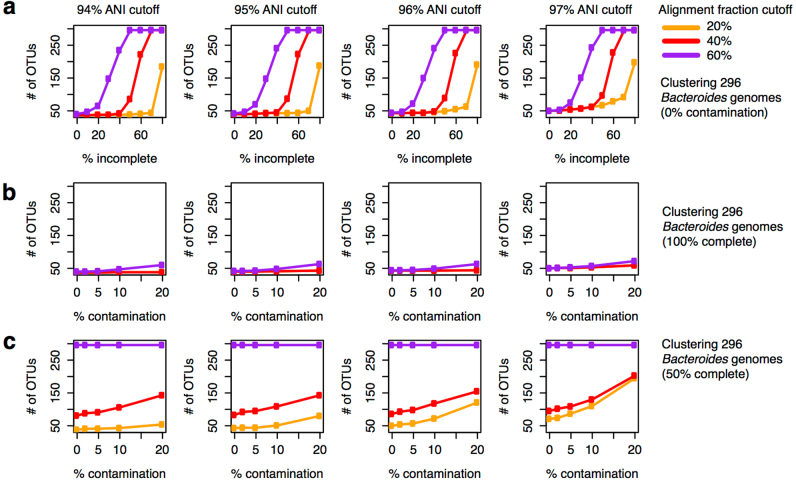
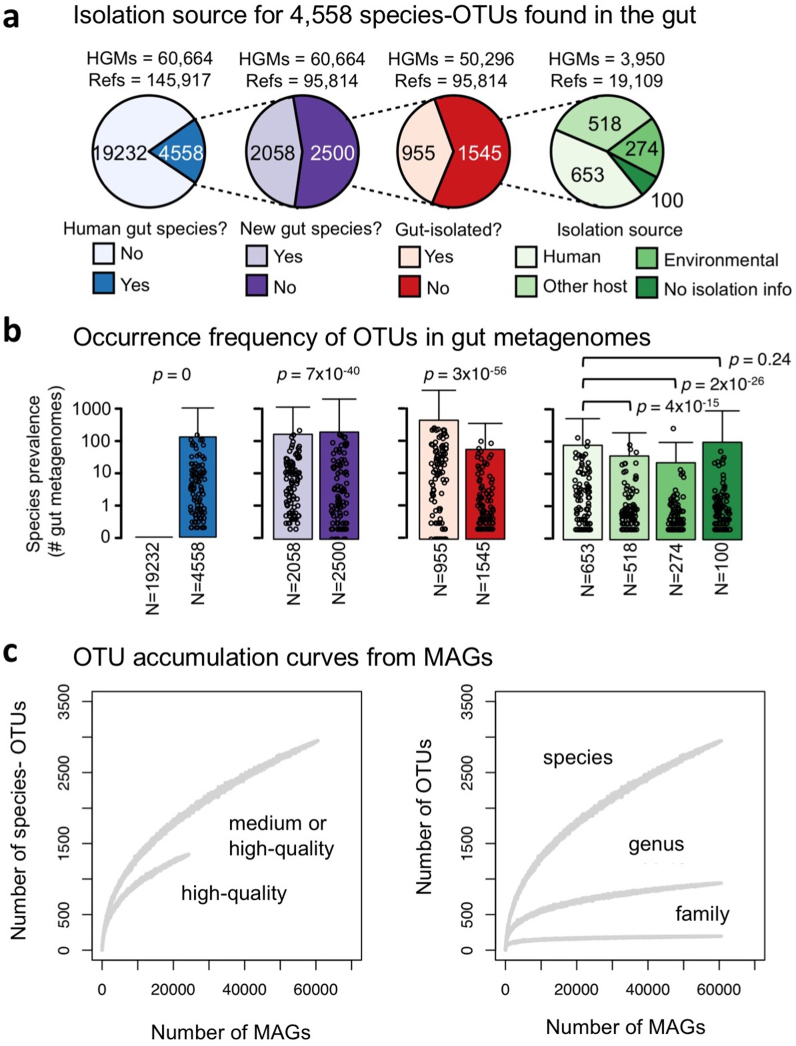
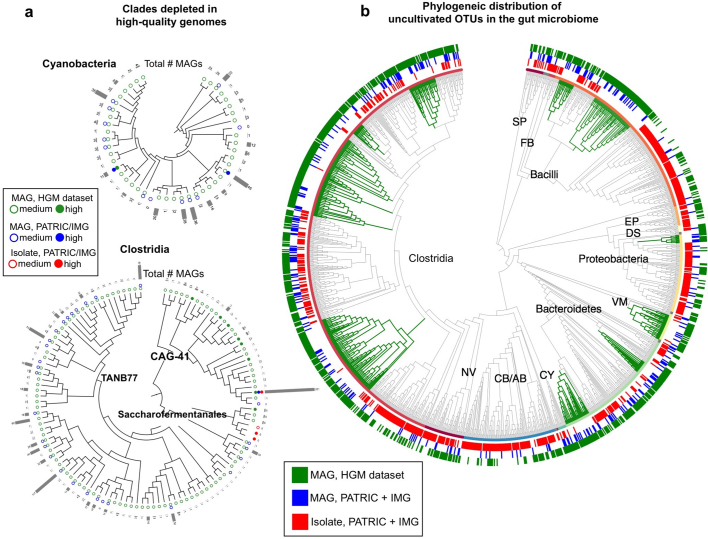
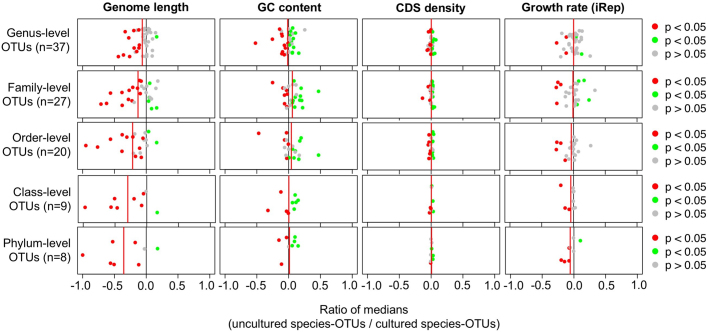
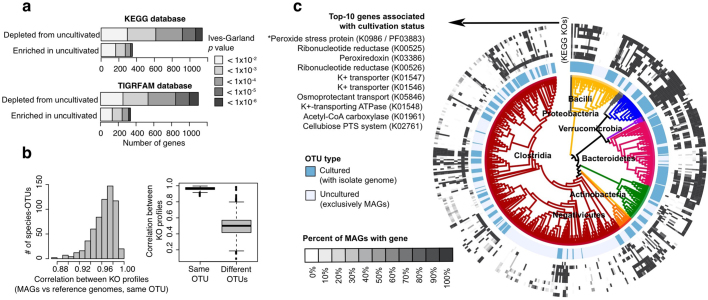
The genome sequences of many species of the human gut microbiome remain unknown, largely owing to challenges in cultivating microorganisms under laboratory conditions. Here we address this problem by reconstructing 60,664 draft prokaryotic genomes from 3,810 faecal metagenomes, from geographically and phenotypically diverse humans. These genomes provide reference points for 2,058 newly identified species-level operational taxonomic units (OTUs), which represents a 50% increase over the previously known phylogenetic diversity of sequenced gut bacteria. On average, the newly identified OTUs comprise 33% of richness and 28% of species abundance per individual, and are enriched in humans from rural populations. A meta-analysis of clinical gut-microbiome studies pinpointed numerous disease associations for the newly identified OTUs, which have the potential to improve predictive models. Finally, our analysis revealed that uncultured gut species have undergone genome reduction that has resulted in the loss of certain biosynthetic pathways, which may offer clues for improving cultivation strategies in the future.


Conflict of interest statement

K.S.P. is on the advisory boards of uBiome and Phylagen.

Figures

Fig. 1
Fig. 1. Recovery of genomes from globally distributed gut metagenomes.
a, Geographical distribution of metagenomes. Sample sizes are indicated in parentheses, and pin colour indicates the majority age group and lifestyle (infants, ≤3 years old; adults, ≥18 years old). Several locations are represented by multiple studies; several studies were conducted in multiple locations. b, Computational pipeline for assembling MAGs. c, Pipeline for identifying and removing incorrectly binned contigs. d, Quality metrics across low- (n = 101,651), medium- (med., n = 36,319) and high-quality (n = 24,345) MAGs. e, Barriers to MAG recovery. Single nucleotide polymorphisms (SNPs) were called for MAGs with sufficient read depth (n = 17,671), and compared with N50. Red line is from a Spearman correlation (ρ = −0.61). f, At least 10–20× depth is required to assemble a MAG, but assembly rates vary between taxa. AB, Actinobacteria; AR, Archaea; BD, Bacteroidetes; FR, Firmicutes; VM, Verrucomicrobia; PR, Proteobacteria; SP, Spirochaetes. Sequencing read depth was estimated using IGGsearch (see Methods), and curves were fit using logistic regression. For box plots, the middle line denotes the median; the box denotes the interquartile range (IQR); and the whiskers denote 1.5× IQR.
Fig. 2
Fig. 2. Human gut MAGs expand the genomic diversity of the gut microbiome.
a, Reference genomes were clustered with MAGs at 95% average nucleotide identity (ANI). IMG, Integrated Microbial Genomes; PATRIC, Pathosystems Resource Integration Center. b, All OTUs were further clustered into groups at higher taxonomic ranks. c, Human gut OTUs were identified on the basis of isolation metadata, read-mapping or assembly of a gut MAG. d, Pie chart indicating the percentage of bacterial phylogenetic diversity (PD) in the gut covered by different sets of genomes. e, A considerable fraction of gut OTUs are represented exclusively by MAGs. f, Distribution of newly identified OTUs across healthy human populations. Only countries with at least 20 samples are shown. For box plots, the middle line denotes the median; the box denotes the IQR; and the whiskers denote 1.5× IQR.
Fig. 3
Fig. 3. Newly identified gut species are broadly distributed across taxonomic groups.
Order-level clades with ≥10 human gut species-level OTUs or that were detected in ≥10% of metagenomes from healthy individuals. Taxonomic labels are based on the Genome Taxonomy Database (GTDB). Red labels indicate orders represented exclusively by MAGs (whether in the current study or from previous studies). Pie charts indicate the prevalence of orders across metagenomes from healthy individuals. Grey bars indicate the number of gut species-level OTUs per order, and the green bars indicate the percentage of OTUs that are newly identified in this study. Red stars and purple triangles indicate the number of newly identified genus-level and family-level OTUs, respectively.
Fig. 4
Fig. 4. Metagenome-wide association of gut OTUs with human diseases.
The Manhattan plot shows the phylogenetic distribution of species–disease associations for different metagenomic studies. Each point is one species-level OTU and point height indicates the P value from a two-sided Wilcoxon rank-sum test of estimated species abundance between diseased and healthy individuals after correction for multiple hypothesis tests. The dotted line indicates a false discovery rate of 1%. The plot shows results for five diseases with more than ten species–disease associations. Species are ordered according to their phylogeny, which is displayed at the bottom. AR, Archaea; AB, Actinobacteria; BC, Bacilli; BD, Bacteroidetes; CB, Coriobacteriia; CS, Clostridia; CY, Cyanobacteria; DS, Desulfobacteraeota; EP, Epsilonbacteraeota; FB, Fusobacteria; NV, Negativicutes; PR, Proteobacteria; SN, Synergistetes; SP, Spirochaetes; VM, Verrucomicrobia.
Fig. 5
Fig. 5. Uncultured OTUs have reduced genomes and are missing common biological functions.
a, Comparison of genome size between cultivated and uncultivated species-level OTUs after correction for incompleteness and contamination. The middle line of the box plots denotes the median; the box denotes the IQR; and the whiskers denote 1.5× IQR. b, Genes from the KEGG database were compared between 233 cultivated and 271 uncultivated species-level OTUs using phylogenetic logistic regression. Most genes associated with cultivated status are depleted from uncultured OTUs. KO, KEGG orthology group. c, Phylogenetic tree of species OTUs from Bacilli that were detected in >1% of gut metagenomes. Tip labels and colours indicate order-level clades from the GTDB. A, Acholeplasmatales; M, ML615J-28; H, Haloplasmatales. RF39 has a highly reduced genome with numerous metabolic auxotrophies. P-ACP, pimeloyl-acyl-carrier protein.
Extended Data Fig. 1
Extended Data Fig. 1. The MAGpurify tool removes contamination, maintains completeness and does not result in biased estimates of genome quality.
a, b, One thousand human gut MAGs were simulated to validate the MAGpurify pipeline. Each MAG contained two genomes: one host genome that represents the target genome, and one donor genome that represents the contaminating genome (Supplementary Table 7). All 102 input genomes were isolated from the human gut, and were estimated to have >95% completeness, <1% contamination and <25 contigs. MAGs were simulated with completeness, contamination and N50 on the basis of randomly sampled MAGs from the HGM dataset. Sixty-five MAGs in which contamination exceeded completeness (and thus the host genome was in the minority) were dropped from the analysis. a, The box plots indicate the percentage of reduction in completeness (top) and contamination (bottom) after applying MAGpurify. Regardless of initial quality, MAGpurify sensitively removed contamination for most MAGs, while avoiding removal of the host genome. b, CheckM was applied to simulated MAGs before and after applying MAGpurify. Top, the scatter plots show that true genome quality is correlated with the estimated genome quality before and after applying MAGpurify. Black lines indicate the line of equality. Bottom, the distribution of differences between true and estimated quality is centred at zero, which indicates that CheckM quality estimates are not biased after applying MAGpurify. c, MAGpurify was applied to all MAGs from the HGM dataset. The figure shows the reduction in CheckM quality estimates before and applying MAGpurify. Estimated quality improvement is greatest when completeness is between 90 and 100% and contamination is between 10 and 30%. In all box plots, the middle line denotes the median, the box denotes the IQR and the whiskers denote 1.5× IQR.
Extended Data Fig. 2
Extended Data Fig. 2. Single-sample assembly and binning yields more non-redundant, high-quality MAGs compared to other approaches.
ac, Comparison of single-sample assembly and binning with co-assembly and binning. a, One hundred randomly selected human gut metagenomes were co-assembled with MegaHIT (v.1.1.4, options ‘–k-min 27–k-max 127–k-step 10–kmin-1pass–continue’), which took 3,608 central processing unit hours. Reads from each sample were mapped back to the co-assembly to quantify the read depth of each contig in each sample. This information was used as input to MetaBAT (v.2.12.1, default options) to generate MAGs. Other binning programs—including CONCOCT and MaxBin2—did not complete owing to the large size of the assembly. MAGs from the single-sample pipeline were grouped with MAGs from the co-assembly using Mash at 90% ANI to form 248 clusters. b, A large fraction of clusters is exclusively represented by MAGs from the single-sample pipeline. These clusters tend to be found in multiple samples, which may interfere with co-assembly. For bar plots, the centre bar indicates the mean, the error bar indicates the standard deviation and all data points are overlaid. c, The MAGs recovered by both pipelines (n = 61) have high ANI (which indicates that they are very similar genomes) and tend to have similar levels of estimated completeness and contamination, as determined by CheckM. Black lines indicate the line of equality. df, Comparison of single-sample assembly and binning with co-abundance binning (as previously performed). d, MAGs from the single-sample pipeline were grouped with previously published MAGs using Mash at 90% ANI to form 1,088 clusters. e, A large fraction of clusters is only represented by MAGs from the single-sample pipeline, which tend to be restricted to individual metagenomes—this may be explained by the fact the previously published method requires MAGs to be present in multiple samples to accurately quantify co-variation and bin contigs. For bar plots, the centre bar indicates the mean, the error bar indicates the standard deviation and all data points are overlaid. f, The MAGs recovered by both pipelines (n = 176) have high ANI (which indicates that they are very similar genomes) and tend to have similar levels of estimated completeness and contamination, as determined by CheckM. Black lines indicate the line of equality.
Extended Data Fig. 3
Extended Data Fig. 3. Additional checks of MAG quality after clustering genomes into OTUs.
ac, MAGs and reference genomes were clustered into species-level OTUs on the basis of 95% ANI. As validation, OTUs were compared to the NCBI and GTDB for 65,900 reference genomes with valid species names. a, Box plots of the number of genomes per species, in which the middle line denotes the median, the box denotes the IQR and the whiskers denote 1.5× IQR. b, The number of species per database. c, Similarity between OTUs and other databases, as measured using the adjusted mutual information statistic. Species-level OTUs are concordant with the NCBI and GTDB taxonomies. d, e, MAGs and reference genomes were further clustered into higher-rank OTUs on the basis of phylogenetic distance cut-offs. Rank-specific cut-offs were identified that maximized similarity to the GTDB. f, As an additional indicator of completeness, genome sizes of high-quality MAGs and reference genomes from the same OTU were compared. Each point indicates one species-level OTU (n = 625). A positive slope of close to 1.0 indicates to systematic loss of gene content. gl, As an additional check of contamination, six single-copy marker genes (alaS, rnhB, cbf5, pheS, pheT and infB) were aligned between MAGs using BLASTN. MAGs devoid of contamination should display high percentage identity from the same OTU, and low percentage identity between different OTUs. The six marker genes were selected on the basis of (1) their presence in >90% of high-quality MAGs and reference genomes at single copy, and (2) having species-level percentage DNA identity cut-offs <98%. Highly conserved genes may be similar between different OTUs, and were not suitable for this analysis. For between-OTU comparisons we used 1 MAG for each of 2,962 species-level OTUs. For within-OTU comparisons, we used 2 MAGs for each of 1,616 species-level OTUs. The histograms indicate the distribution of DNA percentage identity between MAGs from the same species-level OTU (in which the lowest common ancestor (LCA) = species) (g), and between MAGs that are more distantly related, in which the LCA = genus (h), family (i), order (j), class (k) or phylum (l). The vast majority of genes from the same species-level OTU display >98% identity, whereas those from different OTUs display <98% identity.
Extended Data Fig. 4
Extended Data Fig. 4. Assembly and distribution of MAGs across human populations.
IGGsearch was applied to 3,083 metagenomes from healthy individuals that were used for assembly and binning to estimate the abundance of human gut OTUs per sample. a, b, The overall assembly rate was computed at each read depth, defined as the percentage of detected OTUs with an assembled MAG. a, Curves were fit using logistic regression. Conditioning on read depth, MAGs are recovered more readily from an infant metagenome compared to an adult metagenome from a rural population. b, The x axis indicates the Shannon diversity of each of the 3,810 metagenomic samples, and the y axis indicates the MAG recovery rate for OTUs with >20× depth. MAGs are recovered less often from a high-diversity community, even when read-depth is sufficiently high (Pearson’s ρ = −0.31, P = 4.3 × 10−75). c, Relative abundance and richness of newly identified and uncultured OTUs at different taxonomic ranks across metagenomes from healthy individuals (n = 3,083). d, Data from c, but shown only for newly identified species-level OTUs and conditioned by host population. Only populations with at least 30 metagenomes are shown. Orange box plots indicate samples from adults in rural countries, purple from adults in urban countries and red from infants in urban countries. c, d, In box plots, the middle line denotes the median, the box denotes the IQR and the whiskers denote 1.5× IQR. e, IGGsearch sensitively detects the presence of species-level OTUs in samples from which no MAG was recovered. The x axis indicated the number of MAGs assembled and the y axis indicates the number of species-levels OTUs detected from IGGsearch profiling. Each point indicates one metagenomic sample (n = 3,083). The red regression line is from a Pearson correlation. The vast majority of detected species is not assembled into a MAG. f, Species richness versus the relative percentage of newly identified species-level OTUs across metagenomic samples (n = 3,083). The red regression line is from a Pearson correlation (ρ = 0.82, P = 0). Newly identified species-level OTUs comprise a greater percentage of the community when diversity is high. This pattern was robust after rarefying metagenomes to one million reads and using a prevalence-matched set of 1,000 newly identified species and 1,000 known species (ρ = 0.59, P = 0).
Extended Data Fig. 5
Extended Data Fig. 5. Effect of completeness and contamination on the identification of OTUs from whole genomes.
ac, OTUs were identified for 296 genomes from the Bacteroides genus on the basis of average-linkage clustering of whole-genome ANI, using the ANIcalculator (v.1.0). The ANI cut-offs used for forming OTUs are indicated in the panel titles (94–97% ANI). The alignment fraction cut-offs, defined as the required percentage of genome length aligned between genome pairs (20–60%), is indicated by line colour. In each panel, the vertical axis indicates the number of OTUs identified from genomes on the basis of the ANI cut-off, alignment fraction cut-off and the degree of incompleteness and/or amount of contamination present in the 296 genomes. a, OTUs were identified for the 296 Bacteroides genomes with up to 80% of genes randomly removed. The number of OTUs is inflated when genomes are incomplete and the alignment fraction is >20%. b, OTUs were identified for the 296 Bacteroides genomes with up to 20% of genes from a different one of the 296 genomes. The number of OTUs is not affected by contamination when genomes are complete. c, OTUs were identified for the 296 Bacteroides genomes with 50% of genes randomly removed and up to 20% of genes from a different one of the 296 genomes, representing a worst-case scenario. The number of OTUs is inflated by contamination when genomes are 50% complete. Using a lower ANI threshold (for example, 94 or 95% versus 96 or 97%) reduces the negative effect of contamination. On the basis of these experiments, we chose an alignment fraction cut-off of 20% and an ANI cut-off of 95% for identifying OTUs from MAGs and reference genomes in the current study.
Extended Data Fig. 6
Extended Data Fig. 6. Annotation and accumulation of human gut OTUs.
a, Of the 23,790 species-level OTUs identified from MAGs and reference genomes, 4,558 were classified as being from the human gut on the basis of (1) having a MAG from the HGM dataset, (2) being detected in a human gut metagenome via read-mapping with IGGsearch or (3) containing a reference genome with metadata that indicate isolation from a human stool sample. Of the 4,558 gut OTUs, 2,058 are represented exclusively by MAGs from the current study and are therefore newly identified. Of the remaining 2,500 represented by reference genomes, only 955 contained a gut-isolated reference genome. The remaining 1,545 OTUs either lack isolation metadata or contain metadata that indicate other isolation sources, including human, non-human and environmental. For example, several gut species from non-host-associated environments were isolated from human food products, including milk, cheese, meat and fermented foods. b, The occurrence frequency of all 4,558 gut OTUs was estimated across 3,810 human stool metagenomes using IGGsearch. For bar plots, the centre bar indicates the mean, the error bar indicates the standard deviation and 100 random data points are overlaid. P values are from two-sided Wilcoxon rank-sum tests. c, Accumulation curves that indicate that the discovery of genus- and family-level OTUs from MAGs has saturated, but that the discovery of species-level OTUs has not. To make the plots, MAGs were randomly sampled without replacement, and the number of unique OTUs was counted for each sample.
Extended Data Fig. 7
Extended Data Fig. 7. Large lineages are depleted in high-quality genomes and isolate genomes.
a, The trees indicate the phylogenetic distribution of species-level OTUs from the human gut for Cyanobacteria, and a subclade within Clostridia. All OTUs within the Cyanobacteria phylum were assigned to the Melainabacteria class. Each tip indicates one species-level OTU. Circles indicates whether a medium- (open circle) or high-quality genome (closed circle) was recovered for MAGs from the HGM dataset (green), MAGs from PATRIC + IMG datasets (blue) or isolate genomes from PATRIC + IMG datasets (red). Diversity within these clades would have been missed without the inclusion of medium-quality MAGs. b, The tree indicates the phylogenetic distribution of bacterial genus-level OTUs from the human gut (n = 1,321 OTUs). The outer rings indicate whether an OTU contains a MAG from the HGM dataset (green), a MAG from PATRIC + IMG dataset (blue) or an isolate genome from PATRIC + IMG dataset (red). Labels indicate phyla. Large monophyletic clades that are depleted in isolate genomes are highlighted with green branches.
Extended Data Fig. 8
Extended Data Fig. 8. Genome size consistently differs between MAGs from cultivated and uncultivated species-level OTUs, but other features do not.
Each column indicates one genomic feature (genome size, GC content, coding density and growth rate) that was compared between high-quality MAGs (n = 24,345) from cultivated species-level OTUs (n = 233) and MAGs from uncultivated species-level OTUs (n = 271). To reduce redundancy, genomic features were averaged across all MAGs per species-level OTU. The value of each point in the figure indicates the log2 ratio of each genomic feature between uncultivated species-level OTUs and cultivated species-level OTUs. Each point indicates a single OTU at a higher taxonomic rank, with the rank indicated by row labels (only including higher-rank OTUs with at least ten cultivated and ten uncultivated species-level OTUs). Red and green points indicate whether the distribution of a genomic feature was significantly different between groups based on a two-sided Wilcoxon rank-sum test after correction for multiple hypothesis tests (α = 0.05). For example, a value of −1.0 at the phylum level for genome size indicates that the genome size of MAGs within uncultivated species was 2× smaller than for cultivated species within a single phylum. Overall, MAGs from uncultivated species had consistently smaller genomes across taxonomic groups regardless of the taxonomic rank, whereas other genomic features (GC content, coding density and growth rate) did not consistently or systematically differ.
Extended Data Fig. 9
Extended Data Fig. 9. Uncultivated OTUs are depleted in numerous functions, including genes for osmotic and oxidative stress.
Genes from high-quality MAGs were functionally annotated on the basis of the KEGG and TIGRFAM databases, and the presence and absence of functions was averaged across MAGs per OTU. Functions were then compared between uncultivated OTUs (n = 271) and cultivated OTUs (n = 233) using the Ives–Garland phylogenetic logistic regression test, and P values were corrected for multiple hypothesis testing using the Benjamini–Hochberg procedure. a, The number of genes associated with cultivation status does not depend on the database used for functional annotation. b, KEGG functional annotations were compared between high-quality MAGs and reference genomes from the same species-level OTU (left) (n = 665 OTUs), and between MAGs and reference genomes from different OTUs using Pearson correlation (right) (n = 665 OTUs). MAGs and reference genomes have concordant functional annotations. In the box plots, the middle line denotes the median, the box denotes the IQR and the whiskers denote 1.5× IQR. c, Phylogenetic tree of 271 uncultivated OTUs and 233 cultivated OTUs. The inner ring indicates whether an OTU is cultivated or not. The outer ring indicates the presence or absence genes from the KEGG database. The top ten genes associated with cultivation status are shown. Of these, four are related to the maintenance of osmotic pressure (KEGG identifiers K05846, K01547, K01546 and K01548) and two (including the top hit) are related to oxidative stress (identifiers K0986 and K03386). Note that identifier K0986 (the top hit) is listed as encoding an uncharacterized protein in the KEGG database, but as encoding a peroxide stress protein in the PFam database (identifier PF03883). Organisms that lack these functions may have decreased viability during cultivation owing to oxygen exposure and osmotic stress from growth in culture medium.

References

    1. Lynch SV, Pedersen O. The human intestinal microbiome in health and disease. N. Engl. J. Med. 2016;375:2369–2379. - PubMed
    1. Kyrpides NC, et al. Genomic encyclopedia of bacteria and archaea: sequencing a myriad of type strains. PLoS Biol. 2014;12:e1001920. - PMC - PubMed
    1. Sunagawa S, et al. Metagenomic species profiling using universal phylogenetic marker genes. Nat. Methods. 2013;10:1196–1199. - PubMed
    1. Nayfach S, Rodriguez-Mueller B, Garud N, Pollard KS. An integrated metagenomics pipeline for strain profiling reveals novel patterns of bacterial transmission and biogeography. Genome Res. 2016;26:1612–1625. - PMC - PubMed
    1. Nelson KE, et al. A catalog of reference genomes from the human microbiome. Science. 2010;328:994–999. - PMC - PubMed