. 2019 Mar;567(7748):414-419.
doi: 10.1038/s41586-019-1016-7. Epub 2019 Mar 13.

Histone H3 trimethylation at lysine 36 guides m6A RNA modification co-transcriptionally

Affiliations

Histone H3 trimethylation at lysine 36 guides m6A RNA modification co-transcriptionally

Huilin Huang et al. Nature. 2019 Mar.

Abstract

DNA and histone modifications have notable effects on gene expression1. Being the most prevalent internal modification in mRNA, the N6-methyladenosine (m6A) mRNA modification is as an important post-transcriptional mechanism of gene regulation2-4 and has crucial roles in various normal and pathological processes5-12. However, it is unclear how m6A is specifically and dynamically deposited in the transcriptome. Here we report that histone H3 trimethylation at Lys36 (H3K36me3), a marker for transcription elongation, guides m6A deposition globally. We show that m6A modifications are enriched in the vicinity of H3K36me3 peaks, and are reduced globally when cellular H3K36me3 is depleted. Mechanistically, H3K36me3 is recognized and bound directly by METTL14, a crucial component of the m6A methyltransferase complex (MTC), which in turn facilitates the binding of the m6A MTC to adjacent RNA polymerase II, thereby delivering the m6A MTC to actively transcribed nascent RNAs to deposit m6A co-transcriptionally. In mouse embryonic stem cells, phenocopying METTL14 knockdown, H3K36me3 depletion also markedly reduces m6A abundance transcriptome-wide and in pluripotency transcripts, resulting in increased cell stemness. Collectively, our studies reveal the important roles of H3K36me3 and METTL14 in determining specific and dynamic deposition of m6A in mRNA, and uncover another layer of gene expression regulation that involves crosstalk between histone modification and RNA methylation.


Figures
Extended Data Figure 1.
Extended Data Figure 1.. Overlapping of H3K36me3 with m6A and co-expression of their writer genes.
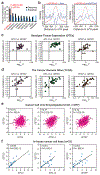
(a) Overlaps of m6A sites with histone modification sites in human genome. Histogram showed the observed and expected percentages of m6A sites that overlap with various histone modification sites; the ENCODE ChIP-seq data and m6A-seq data (GSE37003) obtained from HepG2 cells were used for the analyses. (b) Distance of histone modifications to the nearest m6A peaks. Input and H3K27me3 were shown as negative controls. (c-e) Correlation of SETD2 with individual m6A MTC genes (i.e., METTL3, METTL14, WTAP) in expression in normal tissues (c), cancer samples (d), and cell lines (e), based on the data from Genotype Tissue Expression (GTEx), The Cancer Genome Altlas (TCGA), and Cancer Cell Line Encyclopedia (CCLE) databases, respectively. Note that every dot represents one tissue type (c) or one cancer type (d). (f) Co-expression analysis of SETD2 and individual m6A MTC genes in 33 cancer cell lines based on our qPCR data. The value of each gene represents relative expression as normalized to HEK293T cells. Correlation coefficient (r) and P value were calculated by Pearson’s Correlation analysis in c, d, e and f.
Extended Data Figure 2.
Extended Data Figure 2.. Cellular m6A level was regulated by the H3K36me3 methyltransferase SETD2 and the demethylase KDM4A.
(a) Western blot showing knockdown efficiency of SETD2 and decrease of H3K36me3 in HepG2 and Hela cells by shSETD2#1. GAPDH and H3 serve as loading controls. (b) LC-MS/MS quantification of m6A abundance in poly(A) RNA from Hela cells with knockdown of SETD2 (shSETD2#1) or individual m6A MTC genes compared to control cells. Values are mean±SD of two independent experiments. (c) Knockdown efficiency of shRNAs was verified by qPCR assays. Values are mean±SD of three independent experiments. (d) Dot blot (left) and quantification (right, values are mean±SD) of m6A in total RNAs from control cells or cells with knockdown of SETD2 or individual m6A MTC genes. MB: methylene blue, serving as loading control. (e) Knockdown of SETD2 by two shRNAs were verified by western blot in HepG2 cells. (f) Dot blot (right) and quantification (left, values are mean±SD) of m6A in total RNAs from SETD2 knockdown HepG2 cells. (g) Western blot showing depletion of SETD2 and H3K36me3 in wild type (WT) or SETD2 knockout (KO) Hela cells. (h) LC-MS/MS quantification of m6A in poly(A) RNA from WT or SETD2 KO Hela cells. Values are mean±SD of two independent experiments. (i) Dot blot (right) and quantification (left, values are mean±SD) of m6A in total RNA from WT or SETD2 KO Hela cells. (j) Western blot confirmed the overexpression of HA-tagged KDM4A and decrease of H3K36me3 in HEK293T cells. (k) Quantification (left, values are mean±SD) and dot blot (right) showed hypomethylation of m6A in poly(A) RNAs from HEK293T cells with KDM4A overexpression compared to control cells. (l) Genotyping of SETD2 heterozygous knockout (+/−) mice. c-kit+ bone marrow (BM) cells were used. (m) Western blot showing H3K36me3 level in c-kit+ BM cells from SETD2 heterozygous knockout (+/−) mice. (n and o) LC-MS/MS quantification (n) and dot blot analysis (o, values are mean±SD on left) of m6A in poly(A) RNA from c-kit+ BM cells of wild type (+/+) and Setd2+/− mice. Values are mean±SD of two technical replications and 3 mice were used for each group in n. (p) Western blot showing expression of SUV39H1 and H3K9me3 in Hela cells transfected with siRNA against SUV39H1 (siSUV39H1) or negative control (siNC). (q and r) Dot blot and quantification (values are mean±SD on left) of m6A in total RNA (q) or poly(A) RNA (r) from Hela cells transfected with siSUV39H1 or siNC. (s) A498 cells were transfected with GFP-fused wild type or mutated SETD2, and were selected for GFP positive cells after 48 hours by cell sorting. The elevation of SETD2 mRNA level in SETD2-overexpressed cells was confirmed by qPCR. Values are mean±SD of three independent experiments. (t) Western blot showing H3K36me3 level in A498 cells with (wild-type or mutant) or without SETD2 overexpression. HEK293T served as a positive control. (u) Dot blot detecting m6A in poly(A) RNAs from A498 cells with (wild-type or mutant) or without SETD2 overexpression. (v) Western blot showing that silencing of individual m6A MTC genes did not affect cellular H3K36me3 level. Two-tailed student’s t-test was used in b, c, d, f, h, i, k, n, o, q, r and s; *, P<0.05; **, P<0.01; ***, P<0.001; N.S., non-significant. Images in a, d, g, and i were representative of three independent experiments, e, f, j, k, m, o, p, q, r, t, u and v were representative of two independent experiments. Source data of b, c, d, f, h, i, k, n, o, q, r and s are in Supplementary Table 4.
Extended Data Figure 3.
Extended Data Figure 3.. Reprogramming of H3K36me3 and m6A upon silencing of SETD2.
(a) Histogram showing H3K36me3 peak numbers in HepG2 cells with (shSETD2#1) or without (shCtrl) SETD2 knockdown. (b) Cumulative curves and box plot showing reduction of H3K36me3 in SETD2 knockdown HepG2 cells relative to control cells. P values were calculated using two-sided Wilcoxon and Mann-Whitney test. For the box plot, top of upper whisker is 95th percentile (shCtrl=3.436, shSETD2#1=2.073), top of the box is 75th percentile (shCtrl=1.898, shSETD2#1=1.035), line through the box is median (shCtrl=1.358, shSETD2#1=0.645), bottom of the box is 25th percentile (shCtrl=0.868, shSETD2#1=0.339), and bottom of the lower whisker is 5th percentile (shCtrl=0.001, shSETD2#1=0.001). (c) Circos plot showing genome-wide decrease of H3K36me3 in SETD2 knockdown HepG2 cells compared to control cells. (d) The proportion (pie chart on top) and enrichment (histogram on bottom) of hypomethylated H3K36me3 peak distribution in the promoter, 5’UTR, CDS, stop codon, or 3’UTR region in SETD2 knockdown HepG2 cells. The enrichment was determined by the proportion of H3K36me3 peaks normalized by the length of the region. (e) Metagene profiles of H3K36me3 in SETD2 knockdown and control HepG2 cells. (f) Cumulative curves of m6A abundance [i.e., log2(m6A EF+1)] in control and SETD2 knockdown (shSETD2#1) HepG2 cells. Abundance of m6A-IP was normalized to input when calculating the enrichment fold. P value was calculated using two-sided Wilcoxon and Mann-Whitney test. (g) Scatter plot of m6A peaks in control (shCtrl) and SETD2 knockdown (shSETD2#2) HepG2 cells. The abundance of m6A peaks was calculated as enrichment fold (EF, IP/input) from 3 independent m6A-seq replications. Hypermethylated (hyper) peaks were in red, while hypomethylated (hypo) peaks were in green. (h) Cumulative curves of m6A abundance [i.e., log2(enrichment fold+1)] in control and SETD2 knockdown (shSETD2#2) HepG2 cells. P value was calculated using two-sided Wilcoxon and Mann-Whitney test. (i) Circos plot showing the distribution of hypermethylated and hypomethylated m6A peaks in human transcriptome (left) and chromosome 5 (right) upon knockdown of SETD2 or individual m6A MTC genes. (j) Pie charts showing the percentages of hypomethylated m6A peaks distribution in various RNA species by SETD2 knockdown in HepG2 cells. (k) The proportion (pie chart on top) and enrichment (histogram on bottom) of hypomethylated m6A peak distribution in the 5’UTR, CDS, stop codon, or 3’UTR region in SETD2 knockdown HepG2 cells. The enrichment was determined by the proportion of m6A peaks normalized by the length of the region. (l) HOMER motif analysis revealed conserved motifs enriched in hypomethylated peaks. P values were calculated by HOMER algorithm. (m) Numbers of m6A sites in control (shCtrl) and SETD2 knockdown (sh#1 or sh#2) HepG2 cells identified by miCLIP. (n) HOMER motif analysis revealed conserved motifs of C to T mutations or truncations identified by miCLIP. P values were calculated by HOMER algorithm. (o) The proportion (pie chart on top) and enrichment (histogram on bottom) of miCLIP-identified m6A distribution in gene body regions. (p) Percentages of various RNA species containing miCLIP-identified m6A residues. (q) Metagene profiling of miCLIP-identified m6A residues in control and SETD2 knockdown cells.
Extended Data Figure 4.
Extended Data Figure 4.. Genome-/Transcriptome-wide and locus-specific co-regulation of H3K36me3 and m6A.
(a) Circos plot showing global distribution of H3K36me3 and m6A, as well as H3K9me3, in human genome (left) and chromosome 5 (right) of HepG2 cells. (b) Distribution of H3K9me3 relative to nearest m6A sites in HepG2 cells. (c) Percentages and peak numbers of H3K36me3 and m6A in H3K9me3 negative (H3K9me3-), H3K9me3 positive (H3K9me3+), H3K27me3 negative (H3K27me3-), or H3K27me3 positive (H3K27me3+) regions in HepG2 cells. (d) Distinct patterns of m6A metagene at H3K36me3 positive (H3K36me3+) or negative (H3K36me3-) sites. (e) Distribution of H3K36me3 peaks with m6A (m6A+) or without m6A (m6A-) modifications in gene body and intergenic regions. (f and g) Quantification of H3K36me3 (f) and m6A (g) level in representative genes as determined by ChIP-qPCR and gene specific m6A-qPCR assays in shSETD2#1 and control (shCtrl) HepG2 cells. (h and i) Quantification of H3K36me3 (h) and m6A (i) level in representative genes as determined by ChIP-qPCR and gene specific m6A-qPCR assays in shSETD2#2 and control (shCtrl) HepG2 cells. (j and k) Quantification of H3K36me3 (j) and m6A (k) level in representative genes as determined by ChIP-qPCR and gene specific m6A-qPCR assays in KDM4A-overexpressed and control HEK293T cells. Values are mean±SD of three independent experiments in f, g, h, i, j and k; two-tailed student’s t-test; *, P<0.05; **, P<0.01; ***, P<0.001. Source data of f, g, h, i, j and k are in Supplementary Table 4.
Extended Data Figure 5.
Extended Data Figure 5.. Locus-specific regulation of m6A by H3K36me3.
(a, b) Schematic showing the epigenetic editing of H3K36me3 by dCas9-KDM4A on MYC-CRD (a) or by dCas-SETD2 on GNG4 (b). (c) Distribution of H3K36me3 and m6A peaks across GNG4 mRNA transcript. (d) Schematic showing the endogenous GNG4 and artificial MYC-GNG4 fusion gene. The primers used to distinguish endogenous GNG4 (GNG4-5’UTR), MYC-GNG4 fusion sites (MYC-GNG4) or GNG4-vector fusion sites (GNG4-pcDNA) were indicated by black, orange, or blue arrows, respectively. (e) Quantification of H3K36me3 (top) and m6A (bottom) in endogenous GNG4 or MYC-GNG4 fusion gene by ChIP-qPCR or gene specific m6A assay in control or SETD2 knockdown cells. Values are mean±SD of five independent experiments. Two-tailed student’s t-test was used; ***, P<0.001; N.S., non-significant. Source data of e are in Supplementary Table 4.
Extended Data Figure 6.
Extended Data Figure 6.. Impact of SETD2 knockdown on gene expression, mRNA stability and translation.
(a) Distribution of H3K36me3 and m6A peaks across MYC mRNA transcript. CRD: coding region instability determinant. (b) Histogram showing significant upregulated (up, log2FC>0.585, P<0.05) and downregulated (down, log2FC<−0.585, P<0.05) genes in SETD2 or individual MTC gene knockdown HepG2 cells. (c) Correlation of fold-change (FC) in gene expression between SETD2 knockdown and individual MTC gene knockdown cells. (d) Cumulative curves of mRNA half-life in SETD2 or METTL14 knockdown or control cells. P value was calculated using two-sided Wilcoxon and Mann-Whitney test. (e) Decay curves and half-life (T1/2) of MYC mRNA in SETD2 or METTL14 knockdown or control cells were derived from transcriptome-wide mRNA stability profiling. Values are mean±SD of two independent experiments. (f) Correlation of changes in mRNA half-life between SETD2 knockdown and METTL14 knockdown cells. (g) Histograms showing genes with significantly increase (up, log2FC>0.585, P<0.05) or decrease of translation efficiency (down, log2FC<−0.585, P<0.05) in SETD2 or METTL14 knockdown HepG2 cells. (h) Correlation of changes in translation efficiency between SETD2 knockdown and METTL14 knockdown cells. Correlation coefficient (r) and P values were calculated by Pearson’s Correlation analysis in c, f and h. Source data of e are in Supplementary Table 4.
Extended Data Figure 7.
Extended Data Figure 7.. Mechanism of H3K36me3-dependent m6A modification.
(a) Binding of METTL3 (MTL3, upper panel) and METTL14 (MTL14, lower panel) to target mRNAs was determined by CLIP-qPCR assays. (b) qPCR data showing that knockdown of SETD2 in HepG2 and Hela cells did not downregulate the expression of m6A MTC genes. (c) qPCR data showing that overexpression of SETD2 in A498 cells did not significantly change the expression of m6A MTC genes. (d) qPCR showing that overexpression of KDM4A in HEK293T cells did not affect the expression of individual m6A MTC genes i. GAPDH were used as reference gene when normalizing qPCR data in b, c and d. (e) Protein level of individual MTC in SETD2 silencing, SETD2 overexpression (OE), or KDM4A overexpression cells was determined by western blot. (f) Interaction of METTL3 and METTL14 in SETD2 knockdown or control cells with forced expression of HA-METTL3. (g) Western blot showing forced expression of METTL3, METTL14, and WTAP in Hela cells. (h) Co-IP of HA-tagged individual m6A MTC proteins in Hela cell lysates with or without pretreatment with DNase (DN, 100 U/ml) or RNase (RN, 2 ug/ml) for 1-hour at room temperature. (i) Co-IP of HA-tagged METTL14 showed no interaction between METTL14 and mono- or di-methylation of H3K36 (H3K36me1 and H3K36me2) in Hela cells. (j) Co-IP of endogenous METTL3 (M13) or METTL14 (M14) in Hela cells. The interaction between METTL3 or METTL14 with H3K36me3 was detected by western blot. (k) Co-IP of endogenous H3K36me3 in HepG2 cells without or with knockdown of individual m6A MTC genes. (l) The m6A/A ratio was quantified by LC-MS/MS in HepG2 cells with knockdown of SETD2 or/and METTL14. Values are mean±SD of two independent experiments in b and l and of three independent experiments in a, c and d; two-tailed student’s t-test was used to test difference; *, P<0.05; **, P<0.01; ***, P<0.001. Images in e, f, g, h, i, j and k were representative of three independent experiments. Source data of a, b, c, d and l are in Supplementary Table 4.
Extended Data Figure 8.
Extended Data Figure 8.. METTL14 binds to H3K36me3 in vitro and in vivo.
(a) Schematic of the indirect or direct models of H3K36me3 recruiting MTC. “Adaptor” model (left) refers to indirect interaction of m6A MTC with H3K36me3 through known H3K36me3 binding proteins (adaptors). “Reading and Writing” (R/W) model is shown on right, which proposes that m6A writer complex functions as reader of H3K36me3 (green dot) and is recruited to chromatin to catalyze m6A methylations (yellow dots) in newly synthesized RNAs. (b) Potential association of METTL3 or METTL14 with known H3K36me3 readers was examined by co-IP in Hela cells with forced expression of HA-tagged METTL3 or METTL14. (c) Western blot confirmed knockdown efficiency of MSH2 by siRNA. (d) Western blot showing that MSH2 siRNA did not affect the interaction between METTL14 and H3K36me3. (e) The direct binding of Flag-tagged recombinant human METTL3 or METTL14 proteins with histone 3 peptides with (me3+) or without (me3-) K36me3 modifications was examined by in vitro pull-down assays. (f) Gel shift of H3K9me3 or unmethylated histone H3 with recombinant human METTL3 or METTL14 in native SDS-PAGE gel. (g) Schematic of full-length (FL) METTL14 and its truncations was shown on top. Co-IP coupled with western blot showing the interaction of ectopically expressed FL or truncated METTL14 with H3K36me3 in Hela cells was shown on the bottom. (h) Co-IP coupled with western blot showed the interaction of ectopically expressed truncated (Δ186-456 or Δ117-456) METTL14 with H3K36me3 in HepG2 cells. (i) Co-IP coupled with western blot showed the interaction of ectopically expressed full length (FL) or truncated (Δ138-143 or Δ153-161) METTL14 with H3K36me3 in HepG2 cells. (j) m6A Dot blot assays in METTL14 inducible knockout cells (sgMETTL14) transduced with different variants of METTL14. Images of m6A and methylene blue blots were shown on right, while the quantification of m6A was shown on left (values are mean±SD). (k) Pearson correlation coefficients of METTL14 ChIP-seq peaks with genomic H3K27me3 features in non-overlapping, non-repetitive windows of different sizes along the genome. (l) Percentages of various RNA species containing METTL14 binding sites detected by PAR-CLIP-seq. (m) The proportion (pie chart on top) and enrichment (histogram on bottom) of METTL14 CLIP binding sites distribution in gene body regions. (n) HOMER motif analysis of T to C mutations or truncations identified by METTL14 PAR-CLIP. P value was calculated by HOMER algorithm. (o) Co-IP showed that METTL14 bound to Ser2 phosphorylated polymerase II (Pol II pSer2) in Hela cells. (p) Co-localization of METTL14 with H3K36me3 (upper panels) or active transcription polymerase II (pSer2) (lower panels) in nuclei of HepG2 cells. Scale bar =10 μm. (q) Dot blot (right) and quantification (left, values are mean±SD) showing enrichment of m6A in chromatin bound RNAs compared to that in RNAs from other cell fractions. (r) Western blot showing DRB treatment (100µM for 3 hours) did not affect H3K36me3 level in Hela cells. DMSO, was used as a vehicle control. (s and t) Dot blot and quantification (values are mean±SD on left) showing the m6A abundance of total RNA (s) or poly(A) RNA (t) was reduced upon DRB treatment (at 100µM for 3 hours) in Hela cells. (u) Co-IP showing association of METTL14 with H3K36me3, METTL3 or Pol II CTD with or without DRB treatment. (v) Distribution of METTL14 binding sites on chromatin in DRB treated cells. Images in b, c, d, e, f, g, h, i, j, o, q, r, s, t and u were representative of three independent experiments. Two-tailed student’s t-test was used to test difference in j, q, s and t; *, P<0.05; **, P<0.01; ***, P<0.001; N.S., non-significant. Source data of j, q, s and t are in Supplementary Table 4.
Extended Data Figure 9.
Extended Data Figure 9.. Silencing of SETD2 demethylates H3K36me3 and m6A of pluripotency factors and delays the in vitro differentiation of mESCs.
(a) qPCR showing remarkable downregulation of SETD2, but not m6A MTC genes, in doxycycline (Dox)-induced Setd2 knockdown mESCs. (b) Western blot showing reduction of Setd2 and decrease of H3K36me3 in doxycycline (Dox)-induced SETD2 knockdown mESCs after 48 hours of Dox treatment. (c) Immunofluorescence showing expression of Stage-specific embryonic antigen-1 (SSEA-1, left) and OCT4 (right) in control (-Dox) and SETD2 knockdown (+Dox) mESCs after 3 days of LIF withdrawal. Scale bar =10 μm. (d) Expression level changes of endoderm differentiation markers during in vitro differentiation of mESCs. (e) Silencing of METTL14 by shRNAs in mESCs as determined by qRT-PCR. (f) Silencing of METTL14 promotes the expression of pluripotency markers in mESCs. HSP90 serves as a loading control. (g) Silencing of METTL14 delayed emerging of endoderm markers in mESCs as determined by qPCR assays. (h) Numbers of H3K36me3 peaks identified in mESCs with or without Dox-induced SETD2 knockdown by ChIP-seq. (i) ChIP-seq revealed global hypomethylation of H3K36me3 in mESCs with doxycyclin treatment as shown by histogram distribution and box plots. For the box plot, top of upper whisker is 95th percentile (shCtrl=2.519, shSETD2=1.081), top of the box is 75th percentile (shCtrl=1.281, shSETD2=0.527), line through the box is median (shCtrl=0.886, shSETD2=0.312), bottom of the box is 25th percentile (shCtrl=0.454, shSETD2=0.155), and bottom of the lower whisker is 5th percentile (shCtrl=0.000, shSETD2=0.000). P value was calculated using two-sided Wilcoxon and Mann-Whitney test. (j) Dot blot (left) and quantification (right, values are mean±SD) revealed reduction of cellular m6A in mESCs by doxycycline-induced knockdown of Setd2. (k) m6A-seq revealed global hypomethylation of m6A in mESCs with doxycyclin treatment as shown by histogram distribution and box plots. For the box plot, top of upper whisker is 95th percentile (shCtrl=18.500, shSETD2=10.200), top of the box is 75th percentile (shCtrl=9.530, shSETD2=5.360), line through the box is median (shCtrl=5.480, shSETD2=3.700), bottom of the box is 25th percentile (shCtrl=3.530, shSETD2=2.110), and bottom of the lower whisker is 5th percentile (shCtrl=2.000, shSETD2=0.000). P value was calculated using two-sided Wilcoxon and Mann-Whitney test. (l) HOMER motif analysis revealed conserved motifs enriched in hypomethylated peaks. P value was calculated by HOMER algorithm. (m) The enrichment of hypomethylated m6A peak distribution. The enrichment fold was determined by the proportion of m6A peaks normalized by the length of the region. (n) Gene set enrichment analysis (GSEA)58 of downregulated genes upon differentiation (D0 -> D6 down) and upregulated genes upon SETD2 silencing (-Dox -> +Dox up). (o) Determination of H3K36me3 abundance in pluripotency factors by ChIP-qPCR. (p) mRNA levels of pluripotency factors in mESCs as examined by qPCR. Values are mean±SD of two independent experiment in a, or three independent experiments in d, e, g, j, o and p; two-tailed student’s t-test; *, P<0.05; **, P<0.01; ***, P<0.001. Images in b, f and j were representative of three independent experiments. Source data of a, d, e, g, j, o and p are in Supplementary Table 4.
Extended Data Figure 10.
Extended Data Figure 10.. Impact of SETD2 and METTL14 in mESCs differentiation.
(a and b) qPCR detecting the expression of SETD2 (a) and METTL14 (b) in mESCs. (c) The fold changes (D6 vs. D0) of gene expression of pluripotency factors and differentiation markers during in vitro differentiation of mESC with SETD2 and/or METTL14 knockdown. (d and e) qPCR detecting the expression of SETD2 (d) and METTL14 (e) showed the knockdown of SETD2 and overexpression of METTL14 in mESCs. (f) The fold changes (D6 vs. D0) of gene expression of pluripotency factors and differentiation markers during in vitro differentiation of mESC with SETD2 knockdown and/or METTL14 overexpression. Values are mean±SD of three independent experiments in a, b, c, d, e and f; two-tailed student’s t-test; *, P<0.05; **, P<0.01; ***, P<0.001; N.S., non-significant. Source data of a, b, c, d, e, and f are in Supplementary Table 4.
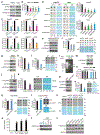
Figure 1.
Figure 1.. H3K36me3 histone modification affects de novo m6A RNA methylation.
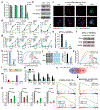
(a) LC-MS/MS quantification of m6A abundance in poly(A) RNA from HepG2 cells with knockdown of SETD2 (shSETD2#1) or individual m6A MTC genes. Values are mean±SD of two independent experiments. (b) m6A level of ploy(A) RNA from A498 cells with ectopic expression of wild type (WT) or mutated (R1625C and ΔSRI) SETD2 or empty pEGFP vector. The m6A abundance was determined by dot blot and quantified (values are mean±SD). Note that R1625C-SETD2 is catalytically inactive, whereas truncation of the small three-helix domain (ΔSRI-SETD2) impairs the direct binding between SETD2 and Pol II and the co-transcriptional installation of H3K36me3. (c) Scatter plot of m6A peaks in control (shCtrl) and SETD2 knockdown (shSETD2#1) HepG2 cells. The abundance of m6A peaks was calculated as enrichment fold (EF, IP/input) from 3 independent m6A-seq replications. Hypermethylated (hyper) peaks were in red, while hypomethylated (hypo) peaks were in green. (d) Distribution of H3K36me3 relative to the m6A peaks in HepG2 cells. (e and f) H3K36me3 (e) and m6A (f) levels in MYC CRD determined by ChIP-qPCR and gene-specific m6A assays in shSETD2#1 and control HepG2 cells. Values are mean±SD of three independent experiments. (g and h) H3K36me3 (left) and m6A (right) level on specific locus were detected in HEK293T cells co-transfected with dCas9-KDM4A (g) or dCas9-SETD2 (h) and specific sgRNAs or non-targeting control (sgNT) as indicated. Values are mean±SD of four independent experiments. Two-tailed student’s t-test was used to test difference in a, b, e, f, g and h; *, P<0.05; **, P<0.01; ***, P<0.001. Source data of a, b, e, f, g and h are in Supplementary Table 4.
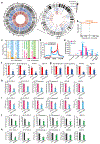
Figure 2.
Figure 2.. Transcriptome-wide cooperation of H3K36me3 and MTC in m6A regulation
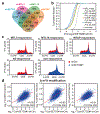
(a) Venn diagram of significantly hypomethylated peaks in HepG2 cells upon knockdown of SETD2 (shSETD2#1) or individual m6A MTC genes. (b) Cumulative curves showing m6A demethylation in m6A MTC gene-responsive peaks upon SETD2 silencing. P values were calculated using two-sided Wilcoxon and Mann-Whitney test. (c) Metagene profiles of m6A modifications in MTC gene-responsive peaks and non-responsive peaks. Note that only loci with H3K36me3 modification in the shCtrl cells were included in the analysis. (d) Correlation of fold-change (FC) in m6A abundance between SETD2 knockdown and individual MTC gene knockdown cells. Correlation coefficient (r) and P values were calculated by Pearson’s Correlation analysis.
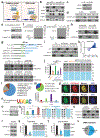
Figure 3.
Figure 3.. H3K36me3 is recognized by METTL14 and guides m6A modifications co-transcriptionally.
(a) Co-immunoprecipitation and western blot in Hela cells with forced expression of HA-tagged m6A MTC genes. (b) Gel shift of H3K36me3 with recombinant human METTL3 or METTL14 in native SDS-PAGE gel. (c) Binding curves and calculated Kd of DyLight488-METTL14 with full length H3K36me3 or H3K9me3 peptide. Values are mean±SD of three independent experiments for H3K36me3 and two independent experiments for H3K9me3. (d) Distribution of METTL14 binding sites on chromatin identified by ChIP-seq. (e) Pearson correlation coefficients analysis of METTL14 ChIP-seq signals with genomic H3K36me3 features in non-overlapping, non-repetitive windows of different sizes along the genome. (f and g) Distribution of H3K36me3 (f) or m6A (g) relative to nearest METTL14 RNA binding sites identified by PAR-CLIP-seq. (h) Proposed model underlying the mechanism of H3K36me3-guided deposition of m6A methylation. Images in a and b were representative of three independent experiments. Source data of c are in Supplementary Table 4.
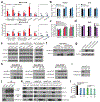
Figure 4.
Figure 4.. Loss of H3K36me3 reduces m6A in mouse embryonic cells and delays in vitro differentiation.
(a) Western blot showing increase of pluripotency factors in mESCs with Dox-induced SETD2 knockdown. (b) Distribution of genes with more than 1.5 fold changes (P<0.05) in both m6A level and H3K36me3 level in SETD2 knockdown mESCs compared to control cells. (c and d) Distribution of H3K36me3 peaks (c) and m6A peaks (d) across SOX2 mRNA transcript. (e) m6A abundance of individual sites in mRNA transcripts of pluripotency factors during differentiation was determined by m6A-IP and qRT-PCR. Values are mean±SD of three independent experiments; two-tailed student’s t-test; ***, P<0.001. Images were representative of three independent experiments. Source data of e are in Supplementary Table 4.

Comment in

References

    1. Egger G, Liang G, Aparicio A & Jones PA Epigenetics in human disease and prospects for epigenetic therapy. Nature 429, 457–463 (2004) - PubMed
    1. Wang X et al. N6-methyladenosine-dependent regulation of messenger RNA stability. Nature 505, 117–120 (2014) - PMC - PubMed
    1. Wang X et al. N(6)-methyladenosine Modulates Messenger RNA Translation Efficiency. Cell 161, 1388–1399 (2015) - PMC - PubMed
    1. Huang H et al. Recognition of RNA N(6)-methyladenosine by IGF2BP proteins enhances mRNA stability and translation. Nat Cell Biol 20, 285–295 (2018) - PMC - PubMed
    1. Batista PJ et al. m(6)A RNA modification controls cell fate transition in mammalian embryonic stem cells. Cell Stem Cell 15, 707–719 (2014) - PMC - PubMed

Publication types

MeSH terms