. 2019 Mar;567(7749):535-539.
doi: 10.1038/s41586-019-1024-7. Epub 2019 Mar 13.

Histone serotonylation is a permissive modification that enhances TFIID binding to H3K4me3

Affiliations

Histone serotonylation is a permissive modification that enhances TFIID binding to H3K4me3

Lorna A Farrelly et al. Nature. 2019 Mar.

Abstract

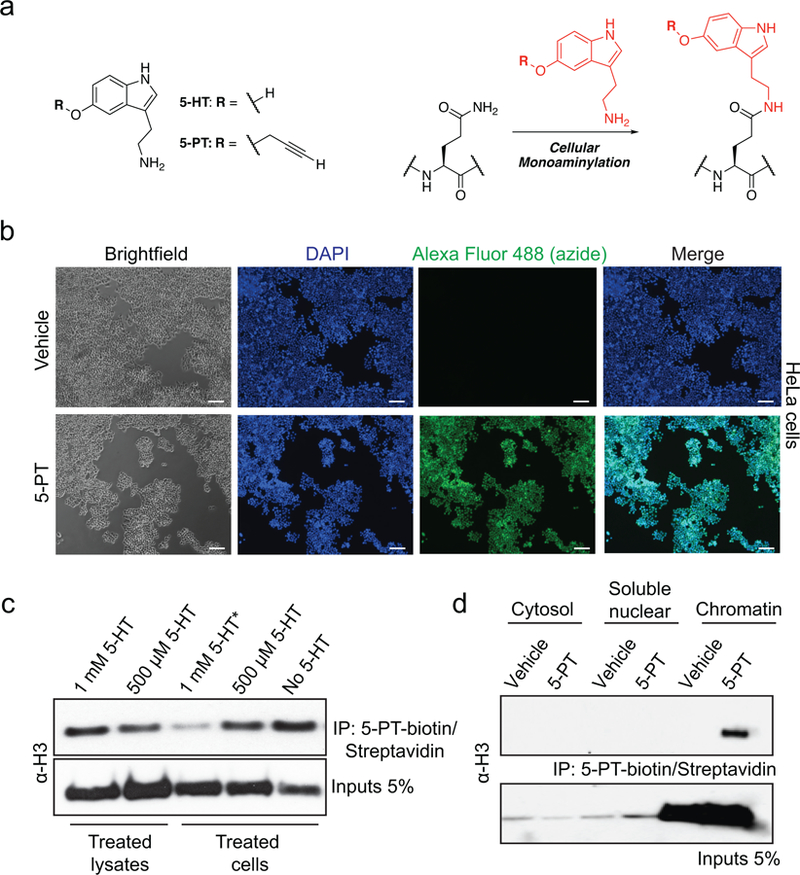
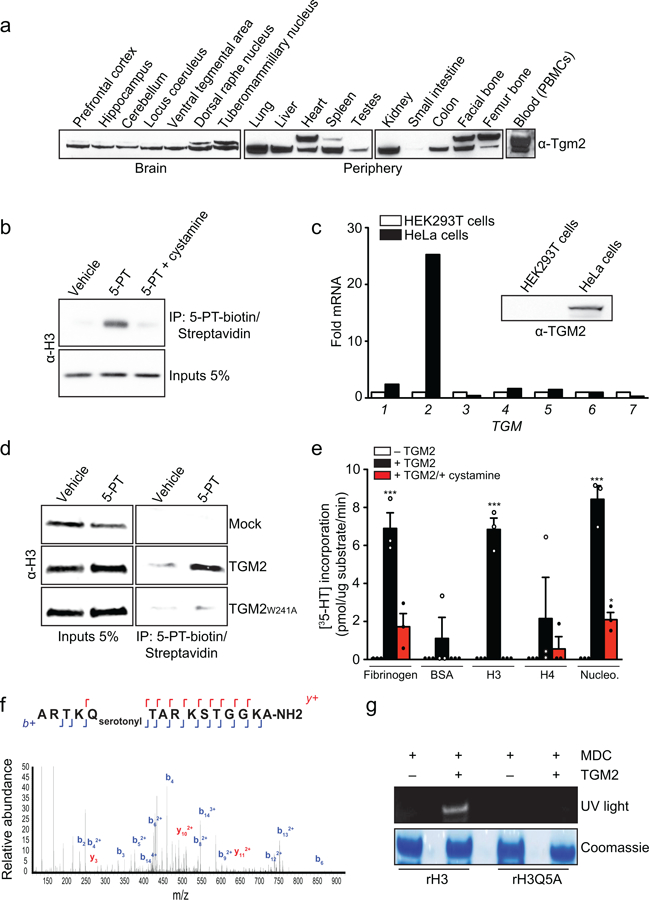
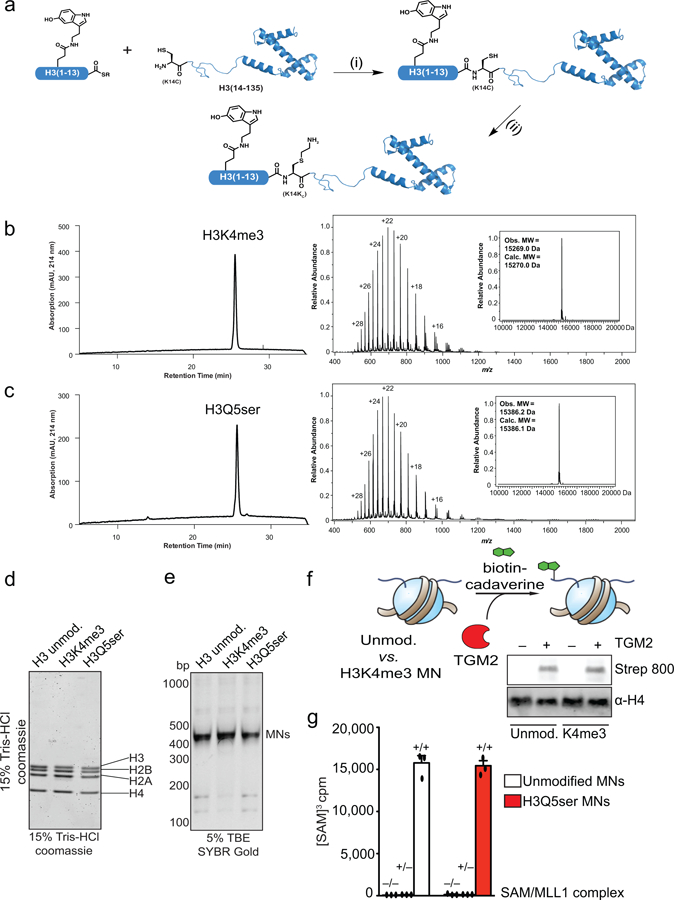
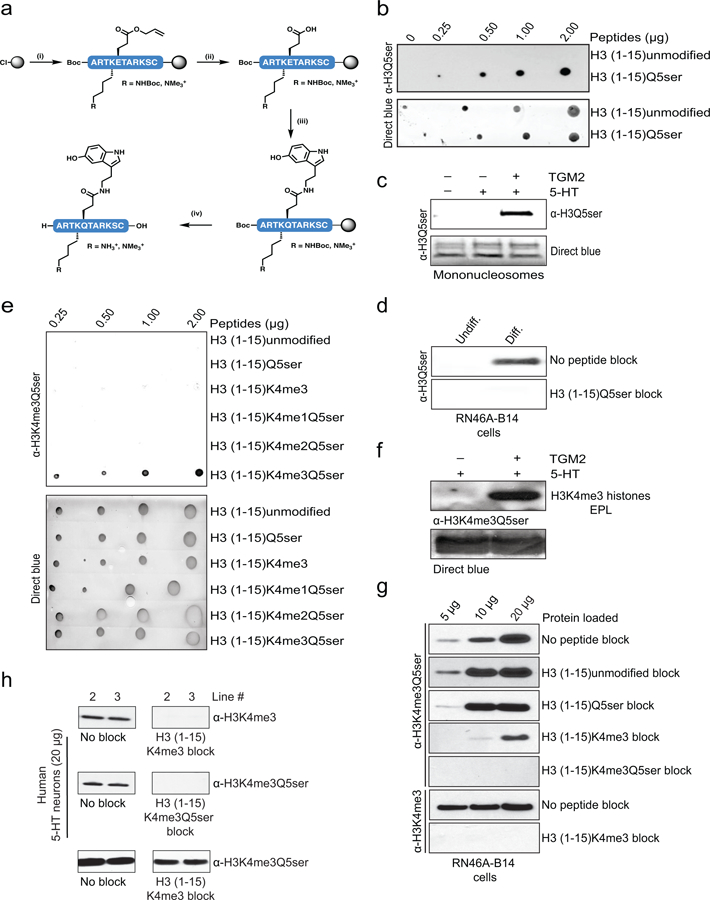
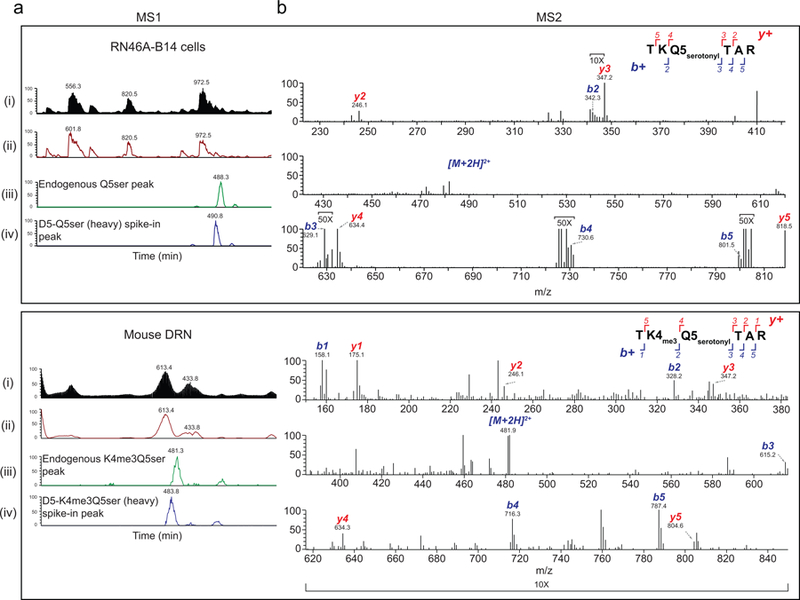
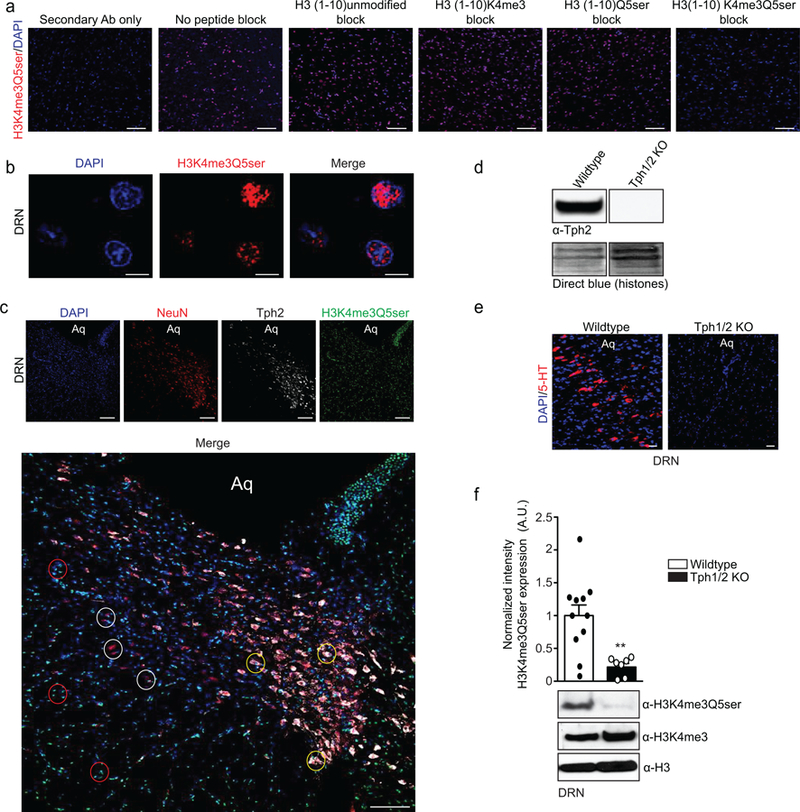
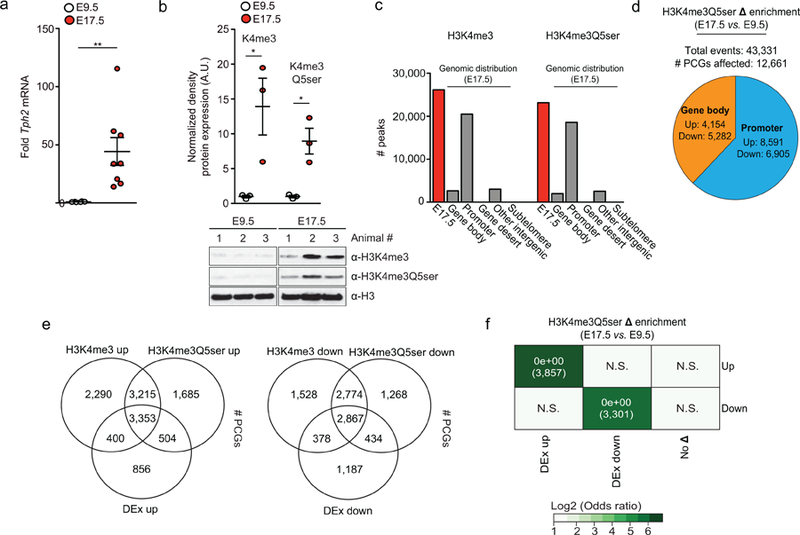
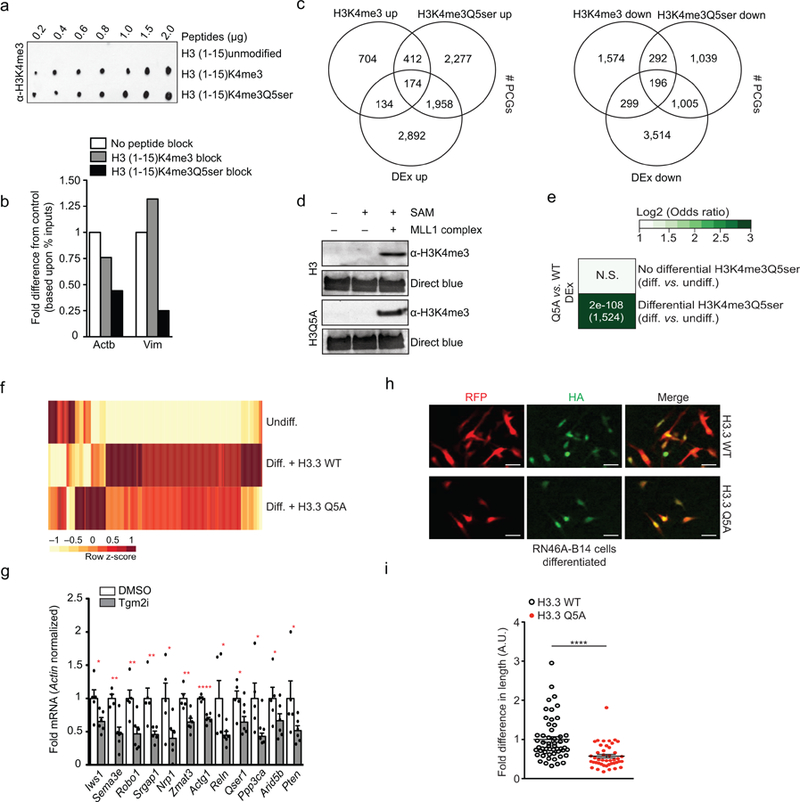
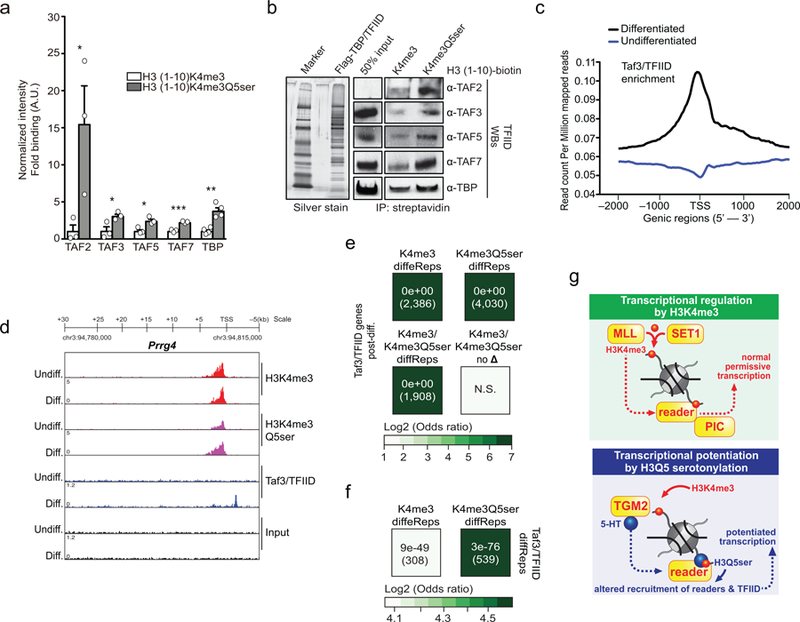
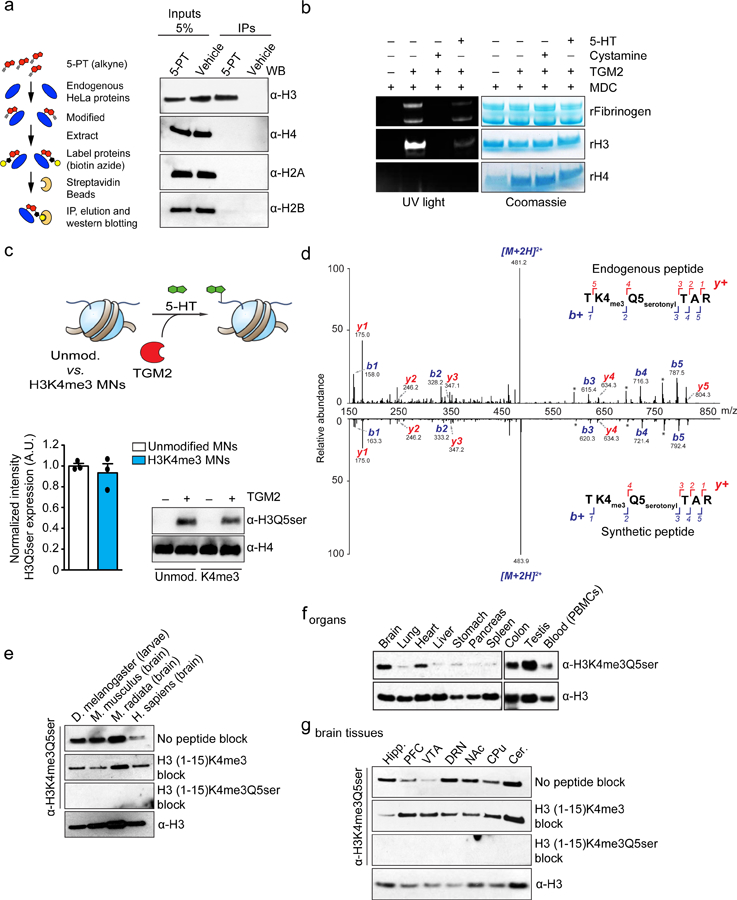
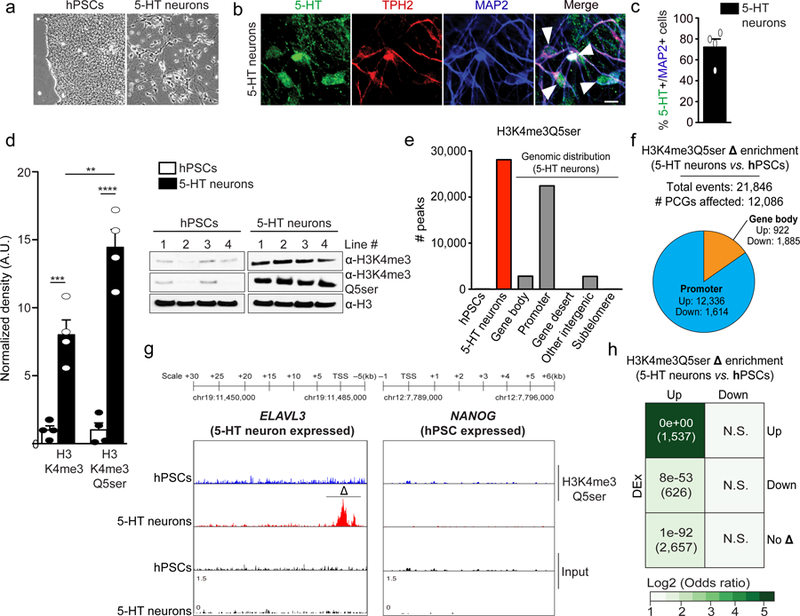
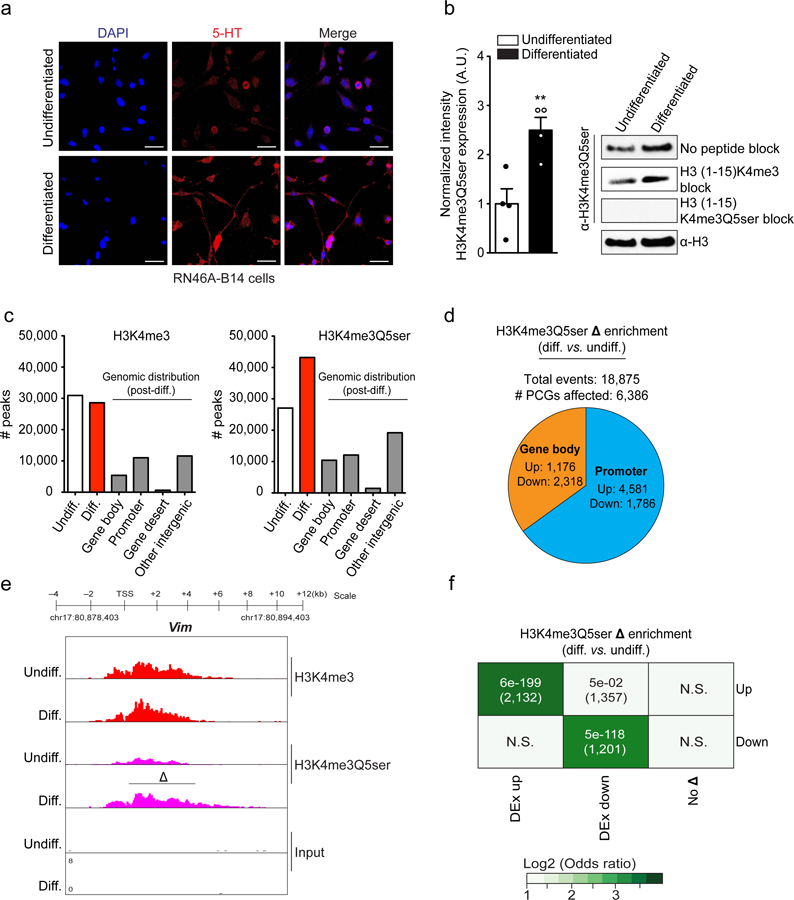
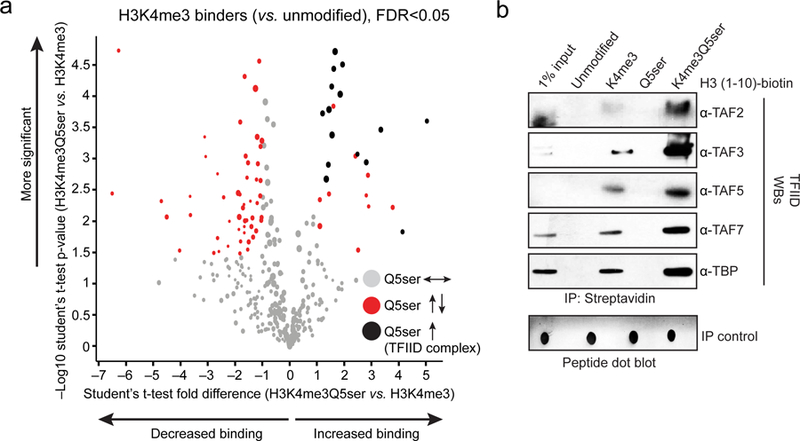
Chemical modifications of histones can mediate diverse DNA-templated processes, including gene transcription1-3. Here we provide evidence for a class of histone post-translational modification, serotonylation of glutamine, which occurs at position 5 (Q5ser) on histone H3 in organisms that produce serotonin (also known as 5-hydroxytryptamine (5-HT)). We demonstrate that tissue transglutaminase 2 can serotonylate histone H3 tri-methylated lysine 4 (H3K4me3)-marked nucleosomes, resulting in the presence of combinatorial H3K4me3Q5ser in vivo. H3K4me3Q5ser displays a ubiquitous pattern of tissue expression in mammals, with enrichment observed in brain and gut, two organ systems responsible for the bulk of 5-HT production. Genome-wide analyses of human serotonergic neurons, developing mouse brain and cultured serotonergic cells indicate that H3K4me3Q5ser nucleosomes are enriched in euchromatin, are sensitive to cellular differentiation and correlate with permissive gene expression, phenomena that are linked to the potentiation of TFIID4-6 interactions with H3K4me3. Cells that ectopically express a H3 mutant that cannot be serotonylated display significantly altered expression of H3K4me3Q5ser-target loci, which leads to deficits in differentiation. Taken together, these data identify a direct role for 5-HT, independent from its contributions to neurotransmission and cellular signalling, in the mediation of permissive gene expression.


Conflict of interest statement

Competing interest statement

The authors declare no competing financial interests.

Figures

Extended Data Figure 1
Extended Data Figure 1. Bioorthogonal labeling by 5-PT identifies H3 serotonylation in chromatin.
a, Structures of 5-HT and 5-PT in transamidation reactions. b, Immunofluorescence images (Scale bars equal 500 μm) of intracellular 5-PT in HeLa cells (bottom) after exogenous application of the molecule (vs. vehicle, top). Intracellular 5-PT was imaged in fixed cells after chemical labeling with Alexa Fluor 488 azide. DAPI was used as a nuclear co-stain. Results confirmed in ≥ 2 independent experiments. c, Cell vs. lysate donor competition assays indicating that application of excess 5-HT to live HeLa cells, but not to processed lysates, prior to chemical labeling and 5-PT-based pulldowns results in loss of H3 signal post-IP. Input and IP WBs are shown. d, Cellular fractionation analysis (WB) identifying H3 serotonylation post-IP in HeLa cell chromatin, but not in soluble nuclear or cytosolic fractions. Input and IP WBs are shown. H3 results confirmed in ≥ 3 independent experiments.
Extended Data Figure 2
Extended Data Figure 2. TGM2 is both necessary and sufficient to promote H3 serotonylation in cells.
a, WB analysis of Tgm2 expression across mouse brain and peripheral tissues (including blood) validate Tgm2 as a ubiquitously expressed enzyme in mammals. While two isoforms of Tgm2 exist and are expressed differentially across tissues, the functions of these two variants remain unknown (n=1/brain region or organ tissue). b, Bioorthogonal labeling of 5-PT modified H3 from HeLa cell extracts in the absence or presence of the transglutaminase inhibitor cystamine (4 mM). Input and IP WBs are shown. Results confirmed in ≥ 2 independent experiments. c, qPCR analysis of TGM genes comparing HeLa vs. HEK293T cells (n=1/cell type). Insert WB validating that TGM2 is differentially expressed across cell types. d, Bioorthogonal labeling of 5-PT modified H3 from mock (non-transfected) vs. nuclear expression of TGM2 in HEK293T cell extracts. Catalytically dead (W241A) TGM2 was used as a negative control. Input and IP WBs are shown. Results confirmed in ≥ 2 independent experiments. e, Recombinant histones (H3 vs. H4) and reconstituted nucleosomes, as well as Fibrinogen (positive control) and bovine serum albumin (BSA–negative control), were subjected to radioactive serotonylation (35-HT) reactions in vitro (n=3), in the absence or presence of cystamine (one-way ANOVA, Dunnett’s post hoc; Fibrinogen – F2,6=33.47, ***p=0.0006, BSA - F2,6=1.000, p=0.4219, H3 - F2,6=130.0, ****p<0.0001, H4 - F2,6=0.7345, p=0.5184, Nucleosomes - F2,6=88.52, ****p<0.0001). f, LC-MS/MS analysis of a TGM2 transamidated H3 peptide (1–15) identifying glutamine 5 as a substrate for serotonylation. The y and b series indicate peptide fragments at amide bonds. Results confirmed in ≥ 2 independent experiments. g, TGM2 monoaminylation assays examining MDC transfer to wildtype rH3 vs. H3Q5A indicating Q5 as a dominant reactive aa substrate for H3. CS of loading is shown. H3 results confirmed in ≥3 independent experiments. Data are presented as averages ± SEM.
Extended Data Figure 3
Extended Data Figure 3. Histone semisynthesis and nucleosome assembly.
a, Representative semisynthesis of serotonylated histone H3 comprising (i) native chemical ligation between the serotonylated H3(1–13) ◻-thioester and a truncated histone H3(14–135), followed by (ii) cysteine alkylation to give K14thialysine. RP-HPLC and MS characterization of semisynthetic histone proteins, including b, H3K4me3 and c, H3Q5Ser. Purified proteins were eluted from a C18 RP-HPLC column using a gradient of 0–73% Solvent B (0.1% TFA in 9:1 acetonitrile/water) in Solvent A (0.1% TFA in water) detecting absorption at 214 nm. Mass spectra of purified proteins were deconvoluted (inset) and observed vs. calculated masses are shown. Results confirmed in ≥ 3 independent experiments. Validation of d, octamer and e, mononucleosome assembly post-semisynthesis of unmodified, K4me3 and Q5ser proteins. Results confirmed in ≥ 3 independent experiments. f, TGM2 monoaminylation assays on unmodified vs. H3K4me3 nucleosomes using biotin cadaverine in place of 5-HT (n=3, two-tailed Student’s t-test; t4=0.500, p=0.64). H4 is provided as a loading control. g, MLL1 complex methyltransferase assays on unmodified vs. Q5ser mononucleosmes (–SAM/–MLL1, +SAM/–MLL1 and +SAM/+MLL1; n=3, two-tailed Student’s t-test +/+ vs. +/+; t4=0.3100, p=0.76). Data are presented as averages ± SEM.
Extended Data Figure 4
Extended Data Figure 4. H3Q5ser and H3K4me3Q5ser antibody validations
a, Synthesis of peptide antigens on 2-Cl trityl resin by (i) iterative Fmoc solid-phase peptide synthesis incorporating Fmoc-Glu(OAII)-OH at position 5 and either Fmoc-Lys(Boc)-OH or Fmoc-Lys(me3)-OH at position 4, (ii) followed by Pd(0) deallylation, (iii) 5-HT coupling and (iv) acidolytic cleavage from the resin and global deprotection. Side-chain protecting groups are omitted for clarity. b, Peptide dot blot titrations testing the α-H3Q5ser antibody’s reactivity against unmodified vs. Q5ser peptides; note that linear signal was only observed with the Q5ser peptide. Direct blue (DB) staining was used to control for peptide loading. c, WB analysis of TGM2 serotonylation assays on unmodified mononucleosomes revealing that the α-H3Q5ser antibody only detects signal when the nucleosomes have been transamidated with 5-HT. DB staining was used to control for protein loading. d, Peptide competition WB analysis of lysates from RN46A-B14 cells indicating the specificity of our α-H3Q5ser antibody. e, Peptide dot blot titrations testing the α-H3K4me3Q5ser antibody’s reactivity against various peptides; note that linear signal was only observed with the K4me3Q5ser peptide. Direct blue (DB) staining was used to control for peptide loading. f, WB analysis of TGM2 serotonylation assays on monomeric K4me3 (EPL) H3 revealing that the α-H3K4me3Q5ser antibody only detects signal when the K4me3 histone has been transamidated with 5-HT. DB staining was used to control for protein loading. g, Peptide competition WB analysis of lysates from RN46A-B14 cells indicating the specificity of our α-H3K4me3Q5ser antibody in vivo; note that a minimum of 20 μg protein was loaded for all other comparisons made throughout the study. h, Peptide competition WB analysis of lysates from hPSC-derived 5-HT neurons indicating the specificity of our α-H3K4me3Q5ser antibody in human cells. For experiments in b-h, similar results were confirmed in ≥ 2 independent experiments/assay.
Extended Data Figure 5
Extended Data Figure 5. LC-MS/MS identification of H3 serotonylation in cells and brain.
LC-MS/MS analysis of endogenous and synthetic (N-terminally labeled with D5) H3Q5ser/H3K4me3Q5ser peptides in RN46A-B14 cells (post-differentiation, top) and brain (mouse DRN, bottom) following IP using our α-H3Q5ser and α-H3K4me3Q5ser antibodies, respectively. a, LC-MS (MS1) chromatograms showing elution profiles for the samples including the endogenous peptide vs. a synthetic peptide standard. From top to bottom, (i) Total Ion Current chromatogram (TIC) depicting the summed intensity of all signals; (ii) base peak chromatogram showing the intensity of the top signal; (iii) extracted ion chromatogram of the m/z of the endogenous peptide; (iv) extracted ion chromatogram of the m/z value of the synthetic, heavy labeled peptide. b, MS/MS (MS2) spectrum (aligned by m/z, and magnified where indicated on either side of the precursor ion) of the H3Q5ser and H3K4me3Q5ser peptides obtained by HCD fragmentation. b+ and y+ fragment ions were annotated manually, and the top insets show good coverage. Results confirmed in ≥ 2 independent experiments (RN46A-B14 cells pre- vs. post-differentiation and/or in mouse brain).
Extended Data Figure 6
Extended Data Figure 6. Euchromatic H3K4me3Q5ser distribution in DRN.
a, Immunofluorescence images (scale bars equal 100 μm) of H3K4me3Q5ser in brain (DRN) –/+ peptide competition, as indicated. DAPI was used as a nuclear co-stain, and a secondary antibody only control is also included. b, Immunofluorescence images (scale bars equal 10 μm) of H3K4me3Q5ser in DRN (no peptide block) revealing a euchromatic distribution pattern in the nucleus with near total exclusion from DAPI rich chromocenters typical of neurons. c, Immunofluorescence images (scale bars equal 100 μm) of H3K4me3Q5ser in DRN, counter stained with DAPI, NeuN (a neuronal cell marker) and Tph2 (a marker of serotonergic neurons). Merged images reveal that H3K4me3Q5ser is not only expressed in serotonergic neurons (NeuN+/Tph2+, yellow circles), but also in non-serotonergic neurons (NeuN+/Tph2–, white circles) and in non-neuronal cells (NeuN–/Tph2–, red circles). Aq = aqueduct. d, WB validation of Tph2 KO in DRN of Tph1/2 KO mice. DB was used to control for loading. e, Immunofluorescence validation of 5-HT depletion in DRN of Tph1/2 KO mice vs. wildtype littermate controls (scale bars equal 100 μm). For all immunofluorescence experiments (a-e), results were confirmed in ≥ 2 independent experiments. f, WB validation that Tph1/2 KO results in loss of H3K4me3Q5ser signal in DRN (n=11 wildtype vs. n=7 Tph1/2 KO, two-tailed Student’s t-test; t16=3.425, **p=0.0035); no effects on H3K4me3 or total H3 expression were observed. Data presented as average ± SEM.
Extended Data Figure 7
Extended Data Figure 7. H3K4me3Q5ser positively correlates with gene expression in developing mouse brain.
a, qPCR analysis of Tph2 gene expression in embryonic mouse brain (E9.5/n=6 vs. E17.5 n=8, two-tailed Student’s t-test; t12=3.100, **p=0.0092). Actin was used as a normalization control. b, Quantitative WB analysis of H3K4me3 and H3K4me3Q5ser expression in embryonic mouse brain at E9.5 vs. E17.5 (two-tailed Student’s t-test, two-sided, n=3 independent biological replicates/age; K4me3 – t4=3.168, *p=0.0339, K4me3Q5ser - t4=4.277, *p=0.0129). H3 was used a loading control. c, MACSv2.1.1-based peak calling for H3K4me3 vs. H3K4me3Q5ser ChIP-seq data in embryonic mouse brain at E17.5 (FDR<0.05, FC>1.2 cutoffs applied after adjusting for multiple comparisons–n=3 independent biological replicates/age). d, Analysis of H3K4me3Q5ser differential enrichment comparing E17.5 vs. E9.5 embryonic mouse brain using diffReps (FDR<0.05, FC>1.2 cutoffs applied after adjusting for multiple comparisons–n=3 independent biological replicates/age). Pie chart indicates distribution of genic differential enrichment events for the mark comparing promoter vs. gene body regions. e, Overlap of differential enrichment events at protein-coding genes for H3K4me3 and H3K4me3Q5ser vs. differential gene expression (DEx) during mouse brain development indicates significant associations between the two marks, as well as positive correlations with gene expression. f, Odds ratio analysis (using Fisher’s exact tests) of overlapping genes displaying differential H3K4me3Q5ser enrichment vs. differential gene expression (DEx, n=3 independent biological replicates/age, FDR<0.05 cutoff applied after adjusting for multiple comparisons) indicating positive correlations between mark enrichment and permissive gene expression during development. Insert numbers indicate respective p values for associations, followed by the number of protein-coding genes overlapping per significant category. Data presented as average ± SEM.
Extended Data Figure 8
Extended Data Figure 8. Functional validations of H3 serotonyl’s role in permissive gene expression.
a, Peptide dot blot titrations testing the ability of the α-H3K4me3 antibody to detect the mark in the absence or presence of Q5ser; note that Q5ser does not occlude antibody recognition of the mark. Results confirmed in ≥ 2 independent experiments. b, Peptide competition qChIP validation of H3K4me3Q5ser’s enrichment at two target loci (Actb and Vim) identified via ChIP-seq in RN46A-B14 cells (undifferentiated, n=1/group). c, Overlap of differential enrichment events at protein-coding genes for H3K4me3 and H3K4me3Q5ser vs. differential gene expression (DEx) in response to RN46A-B14 cell differentiation indicates positive correlations between H3K4me3Q5ser gene expression in the absence of significant changes in H3K4me3 enrichment (FDR<0.05, FC>1.2 cutoffs applied after adjusting for multiple comparisons–n=3 independent biological replicates/differentiation state/antibody). d, Recombinant methylation assays (MLL1 complex mediated) on wildtype H3 vs. H3Q5A, followed by WB for H3K4me3, indicating that the Q5A mutation does not affect methylation capacity at K4. DB was used to control for protein loading. Results confirmed in ≥ 2 independent experiments. e, Odds ratio analysis (using Fisher’s exact tests) of overlapping genes displaying differential H3K4me3Q5ser enrichment (or not) vs. differential gene expression [DEx, n=5 (H3.3 WT) vs. 6 (H3.3Q5A) independent biological replicates/virus], FDR<0.05 cutoff applied after adjusting for multiple comparisons) comparing differentiated RN46A-B14 cells expressing either H3.3 WT or H3.3Q5A. Insert numbers indicate respective p values for associations, followed by the number of protein-coding genes overlapping per significant category. f, Heat map of RNA-seq data comparing undifferentiated vs. differentiated (n=5 H3.3 WT vs. 6 H3.3Q5A expressing) RN46A-B14 cells using normalized RNA expression values (averaged between replicates) to generate z-scores for each row. Represented are those genes that displayed differential enrichment during differentiation, along with altered gene expression (see Fig. 3), along with opposing regulation in the context of H3.3Q5A. These genes were found to significantly enrich for pathways associated with axon guidance signaling via Kegg Analysis (see Supplementary Data Table 28). g, qPCR analysis of candidate gene expression in RN46A-B14 cells (n=5 DMSO vs. 6 LDN 27219/Tgm2i; one-tailed student’s t-test; Iws1: t9=2.559, *p=0.0154, Sema3e: t8=3.982, **p=0.0020, Robo1: t9=3.344, **p=0.0043, Srgap1: t8=3.312, **p=0.0053, Nrp1: t9=2.452, *p=0.0183, Zmat3: t9=3.820, **p=0.0020, Actg1: t8=7.836, ****p<0.0001, Reln: t9=2.209, *p=0.0273, Qser1: t8=2.513, *p=0.0181, Ppp3ca: t8=2.418, *p=0.0210, Arid5b: t9=1.754, *p=0.0567, Pten: t9=1.936, *p=0.0424). Actin was used as a normalization control. h, Immunofluorescence images (scale bars equal 20 μm) of RN46A-B14 cells infected during differentiation with lentiviruses expressing either wildtype H3.3-HA or H3.3Q5A-HA. Results confirmed on ≥ 3 independent coverslips/viral treatment. i, Neurite outgrowth analysis examining RN46A-B14 cellular length post-differentiation (n=54 H3.3 WT vs. 44 H3.3 Q5A expressing cells; two-tailed student’s t-test, t96=4.664, ****p<0.0001). Data presented as average ± SEM.
Extended Data Figure 9
Extended Data Figure 9. Genome-wide associations between H3K4me3Q5ser and TFIID.
a, Western blot quantifications related to Fig. 4a (Student’s t-tests, two-sided) of modified H3 (1–10) peptide IPs from HeLa nuclear extracts (TAF2 – n=3/peptide; t4=2.724, *p=0.05, TAF3 - n=3/peptide; t4=2.920, *p=0.04, TAF5 - n=3/peptide; t4=3.685, *p=0.02, TAF7 - n=3/peptide; t4=8.885, ***p=0.0009, TBP – n=4/peptide; t6=5.383, **p=0.0017). b, Modified H3 (1–10) peptide IPs against purified TFIID from Flag tagged TBP expressing soluble HeLa nuclear extracts (left, silver stain of the purified complex), followed by WBs (right). Inputs are provided (n=1/protein examined). c, Gene plot (ngs.plot) of Taf3/TFIID enrichment (Log2 fold change vs. input) comparing signals pre- vs. post-differentiation (n=3 independent biological replicates/differentiation states). d, IGV genome browser tracks of the Prrg4 locus for H3K4me3, H3K4me3Q5ser and Taf3/TFIID (vs. DNA input) in RN46A-B14 cells pre- and post differentiation (example locus was chosen based upon MACSv2.1.1- and diffReps-based statistical comparisons). Odds ratio analysis (using Fisher’s exact tests) of overlapping genes displaying differential H3K4me3 or H3K4me3Q5ser enrichment (or those genes containing differential sites for both or neither of the two marks, FDR<0.05, FC>1.2) vs. e, Taf3 peaks (n=3 independent biological replicates/differentiation state, MACSv2.1.1, FDR<0.05, FC>1.2 cutoffs applied after adjusting for multiple comparisons; normalized to respective DNA inputs) or f, differential Taf3/TFIID enrichment (n=3 independent biological replicates/differentiation state, diffReps, FDR<0.05, FC>1.2 cutoffs applied after adjusting for multiple comparisons) post-differentiation. Insert numbers indicate respective p values for associations, followed by the number of protein-coding genes overlapping per significant category. g, Model of the impact of Q5ser on K4me3-mediated gene expression in vivo – our data suggest that the presence of combinatorial H3K4me3Q5ser alters interactions with certain K4me3 “reader” proteins, such as the TFIID complex, to potentiate/stabilize permissive gene expression in mammalian cells.
Figure 1
Figure 1. Identification of endogenous serotonylated H3 glutamine 5.
a, Bioorthogonal labeling of 5-PT modified histone proteins from HeLa nuclear extracts. H3 results confirmed in ≥ 3 independent experiments. b, TGM2 monoaminylation (MDC) assays with histone vs. non-histone substrates –/+ TGM2 inhibition with cystamine (4 mM) or donor competition with excess 5-HT (500 μM). H3 results confirmed in ≥ 3 independent experiments. c, TGM2 serotonylation assays on unmodified vs. H3K4me3 nucleosomes (n=3/MN type, two-tailed Student’s t-test; t4=0.7309, p=0.50). H4 is provided as a loading control. d, Mirror plot representation (aligned by m/z, and magnified 2X on either side of the precursor ion) of MS/MS spectra for endogenous vs. heavy synthetic (i.e., D5 labeled on the N-terminus leading to mass shifts for b+ fragment ions exclusively) H3K4me3Q5ser peptides in undifferentiated RN46A-B14 cells. Results confirmed in ≥ 3 independent experiments (RN46A-B14 cells pre- vs. post-differentiation and in mouse brain). e, Multi-species comparison of H3K4me3Q5ser expression (n=1). H3 is provided as a loading control. Representative analysis of f, peripheral organ/blood (PBMC) and g, brain (hippocampus, prefrontal cortex, ventral tegmental area, dorsal raphe nucleus, nucleus accumbens, caudate putamen, cerebellum) cell extracts from mouse for the presence of K4me3Q5ser (n=3–4/tissue or brain region; see Supplementary Data Table 1 for quantifications). H3 is provided as a loading control. Data are presented as averages ± SEM.
Figure 2
Figure 2. H3K4me3Q5ser is responsive to human serotonergic neuronal differentiation.
a, Brightfield and b, immunofluorescence images (line #1 provided as representative) validating differentiation of 5-HT+/TPH2+ neurons from hPSCs with c, ~72% efficiency (5-HT+/MAP2+) across all four lines examined. Scale bar equals 20 μm. d, Quantitative WB analysis of H3K4me3 and H3K4me3Q5ser expression in 5-HT neurons vs. hPSCs (two-tailed Student’s t-tests, n=4/group; K4me3 - t6=6.134, ***p=0.0009, K4me3Q5ser - t6=9.513, ****p<0.0001, K4me3Q5ser vs. K4me3 neurons - t6=3.755, **p=0.0095). H3 was used a loading control. e, MACSv2.1.1-based peak calling for H3K4me3Q5ser ChIP-seq data pre- and post-differentiation (FDR<0.05, FC>1.2 cutoffs applied after adjusting for multiple comparisons–n=4 lines/pre- vs. post-differentiation; normalized to respective inputs). f, diffReps analysis of H3K4me3Q5ser differential enrichment pre- vs. post-differentiation (FDR<0.05, FC>1.2 cutoffs applied after adjusting for multiple comparisons–n=4 lines/pre- vs. post-differentiation). Pie chart indicates distribution of genic differential enrichment events for the mark comparing promoter vs. gene body regions. g, Representative genome browser tracks of ELAVL3 vs. NANOG loci for H3K4me3Q5ser (vs. DNA input) in hPSCs vs. 5-HT neurons (n=4 lines/pre- vs. post-differentiation). Δ indicates a statistically significant site of differential enrichment for H3K4me3Q5ser. h, Odds ratio analysis of overlapping genes displaying differential H3K4me3Q5ser enrichment (FDR<0.05, FC>2.5, n=4 lines/pre- vs. post-differentiation) vs. differential gene expression (DEx, n=3 lines/pre- vs. post-differentiation – lines 1–3, FDR<0.05 cutoff applied after adjusting for multiple comparisons). Insert numbers indicate respective p values for associations, followed by the number of protein-coding genes overlapping per significant category. Data are presented as averages ± SEM.
Figure 3
Figure 3. H3K4me3Q5ser, independently from H3K4me3, correlates with permissive gene expression during cellular differentiation.
a, Immunofluorescence images of 5-HT in RN46A-B14 cells overlayed with a nuclear co-stain (DAPI) pre- and post-differentiation. Scale bars equal 20 μm. Results confirmed in ≥ 3 independent experiments b, Quantitative WB analysis of H3K4me3Q5ser expression in RN46A-B14 cells pre- vs. post-differentiation (two-tailed Student’s t-test, n=4/group; t6=3.736, **p=0.0097). H3 was used a loading control.. c, MACSv2.1.1-based peak calling for H3K4me3 vs. H3K4me3Q5ser ChIP-seq data pre- and post-differentiation in RN46A-B14 cells (FDR<0.05, FC>1.2 cutoffs applied after adjusting for multiple comparisons–n=3 independent biological samples/pre- vs. post-differentiation; normalized to respective inputs). d, Analysis of H3K4me3Q5ser differential enrichment comparing RN46A-B14 cells pre- vs. post-differentiation (FDR<0.05, FC>1.2 cutoffs applied after adjusting for multiple comparisons–n=3 independent biological samples/pre- vs. post-differentiation). Pie chart indicates distribution of genic differential enrichment events for the mark comparing promoter vs. gene body regions. e, Genome browser tracks of the Vim locus for H3K4me3 and H3K4me3Q5ser (vs. DNA input) in RN46A-B14 cells pre- and post differentiation. Δ indicates a statistically significant site of differential enrichment for H3K4me3Q5ser as determined by diffReps (n=3 independent biological samples/pre- vs. post-differentiation). f, Odds ratio analysis of overlapping genes displaying differential H3K4me3Q5ser enrichment vs. differential gene expression (DEx, n=3 independent biological samples/pre- vs. post-differentiation, FDR<0.05 cutoff applied after adjusting for multiple comparisons). Insert numbers indicate respective p values for associations, followed by the number of protein-coding genes overlapping per significant category. Data are presented as averages ± SEM.
Figure 4
Figure 4. H3K4me3Q5ser potentiates TFIID interactions with H3K4me3.
Modified H3 (1–10) peptide IPs from HeLa nuclear extracts identifying potentiated interactions between TFIID complex proteins and the H3K4me3 tail in the presence of Q5ser via a, LC-MS/MS–iBAQ label-free quantitation, n=4 independent biological replicates/peptide; results of t-tests (adjusted for multiple comparisons) are illustrated using a Volcano plot. Sizes of the filled circles are used as an indication of the approximate amount of a given protein. FDR<0.05, FC>2 cutoffs applied (gray circles = K4me3 binders unaffected by Q5ser; red circles = K4me3 binders potentiated or attenuated by Q5ser; black circles = TFIID complex proteins altered in their interactions by Q5ser). b, Representative western blot images of modified H3 (1–10) peptide IPs from HeLa nuclear extracts (quantifications provided in Extended Data Fig. 9a).

Comment in

References

    1. Kouzarides T Chromatin modifications and their function. Cell 128, 693–705, doi:S0092–8674(07)00184–5 [pii] 10.1016/j.cell.2007.02.005 (2007). - DOI - PubMed
    1. Jenuwein T & Allis CD Translating the histone code. Science 293, 1074–1080, doi:10.1126/science.1063127 293/5532/1074 [pii] (2001). - DOI - PubMed
    1. Strahl BD & Allis CD The language of covalent histone modifications. Nature 403, 41–45, doi:10.1038/47412 (2000). - DOI - PubMed
    1. Lauberth SM et al. H3K4me3 interactions with TAF3 regulate preinitiation complex assembly and selective gene activation. Cell 152, 1021–1036, doi:10.1016/j.cell.2013.01.052 (2013). - DOI - PMC - PubMed
    1. Vermeulen M et al. Selective anchoring of TFIID to nucleosomes by trimethylation of histone H3 lysine 4. Cell 131, 58–69, doi:10.1016/j.cell.2007.08.016 (2007). - DOI - PubMed

Publication types

MeSH terms