. 2019 Mar;567(7748):405-408.
doi: 10.1038/s41586-019-1018-5. Epub 2019 Mar 13.

Small-molecule ion channels increase host defences in cystic fibrosis airway epithelia

Affiliations

Small-molecule ion channels increase host defences in cystic fibrosis airway epithelia

Katrina A Muraglia et al. Nature. 2019 Mar.

Abstract

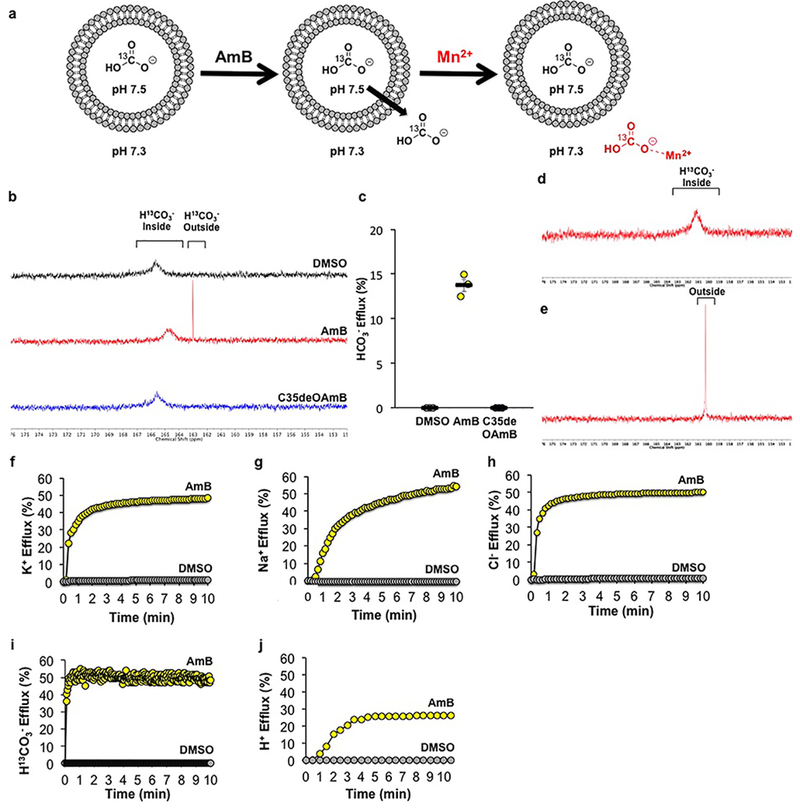
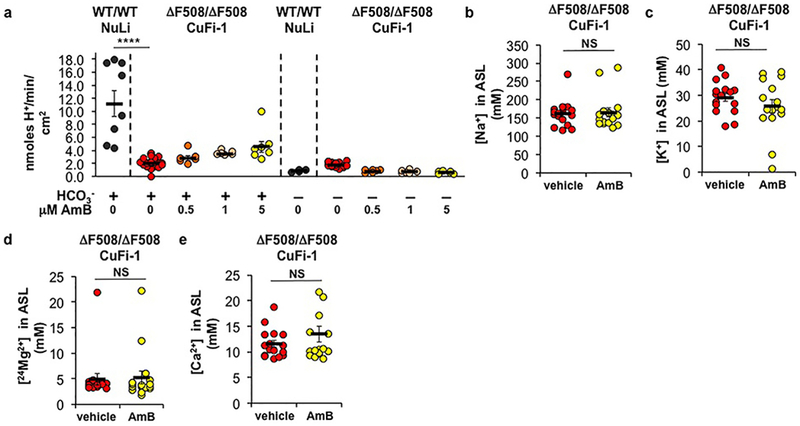
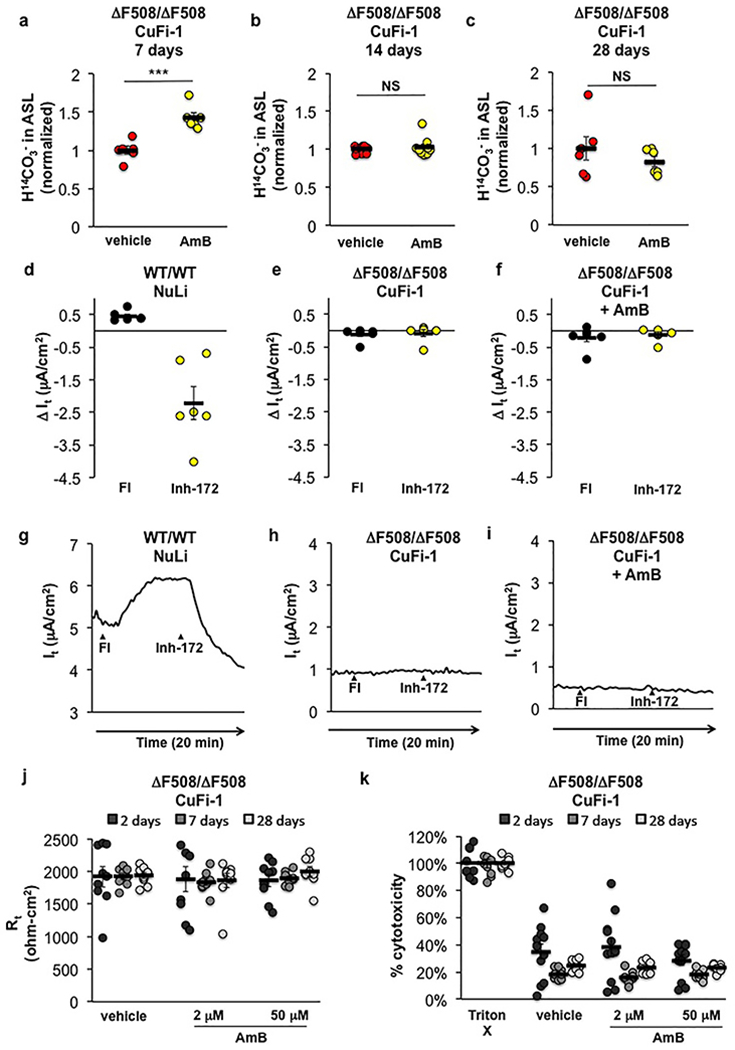
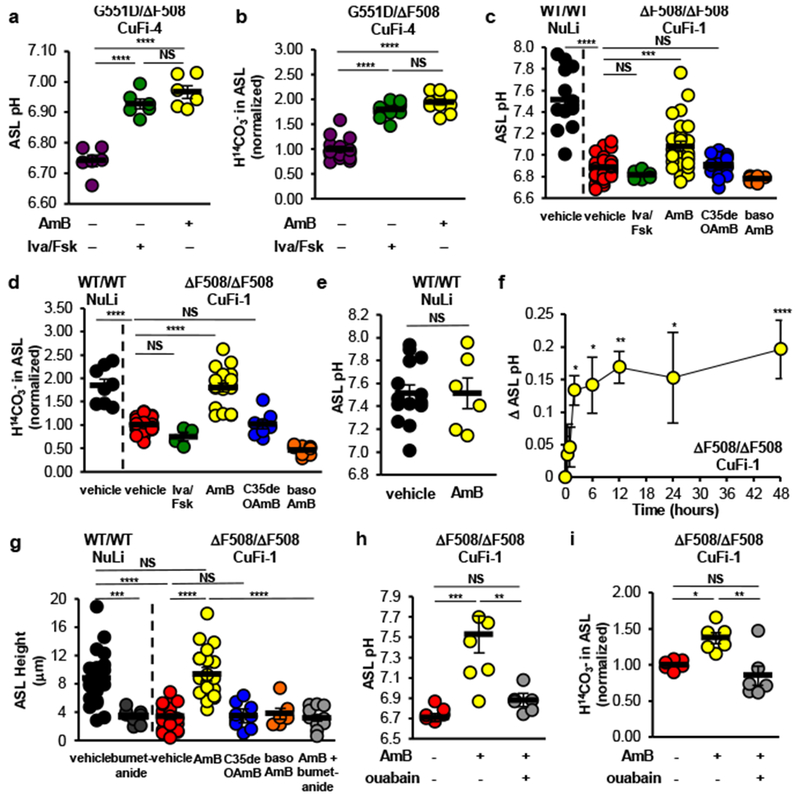
Loss-of-function mutations in the cystic fibrosis transmembrane conductance regulator (CFTR) compromise epithelial HCO3- and Cl- secretion, reduce airway surface liquid pH, and impair respiratory host defences in people with cystic fibrosis1-3. Here we report that apical addition of amphotericin B, a small molecule that forms unselective ion channels, restored HCO3- secretion and increased airway surface liquid pH in cultured airway epithelia from people with cystic fibrosis. These effects required the basolateral Na+, K+-ATPase, indicating that apical amphotericin B channels functionally interfaced with this driver of anion secretion. Amphotericin B also restored airway surface liquid pH, viscosity, and antibacterial activity in primary cultures of airway epithelia from people with cystic fibrosis caused by different mutations, including ones that do not yield CFTR, and increased airway surface liquid pH in CFTR-null pigs in vivo. Thus, unselective small-molecule ion channels can restore host defences in cystic fibrosis airway epithelia via a mechanism that is independent of CFTR and is therefore independent of genotype.


Figures

Extended Data Figure 1 |
Extended Data Figure 1 |. AmB can transport potassium, sodium, chloride, protons and bicarbonate across a lipid membrane.
Traces indicate percent of maximum ion efflux after Triton-X addition. a) Schematic for the 13C-NMR bicarbonate efflux experiment. (b) 13C-NMR spectra of H13CO3-loaded POPC/10% cholesterol liposomes treated with AmB, C35deOAmB, or DMSO vehicle. NaH13CO3 was loaded inside the liposomes and the intravesicular solution was buffered to pH 7.5, while the extravesicular solution was buffered to pH 7.3. Due to this pH difference, intravesicular HCO3 displays a more downfield chemical shift relative to extravesicular HCO3. Addition of AmB (1:4,000 AmB:POPC) produces an upfield 13C signal corresponding to extravesicular HCO3, while the addition C35deOAmB or DMSO vehicle does not, demonstrating that AmB is able to facilitate HCO3 efflux. (c) Percent efflux of bicarbonate mediated by DMSO, AmB, or C35deOAmB quantified 10 minutes after addition to POPC liposomes (n = 3 biologically independent samples). The data from each run was normalized to the percent of total ion release from 0 to 100%. After lysis of the liposome suspension, the integration of the signal corresponding to extravesicular HCO3 relative to the integration of a 13C glucose standard was scaled to correspond to 100% efflux. (d) To confirm that the upfield signal corresponds to extravesicular HCO3, Mn2+, which binds to HCO3 and quenches the observed 13C signal via paramagnetic relaxation enhancement (PRE), was added to the extravesicular solution. Because Mn2+ is impermeable to the POPC bilayer, Mn2+ can only affect the signal corresponding to HCO3 outside of the liposomes. Addition of Mn2+ quenched the upfield signal produced with the addition of AmB but not the signal corresponding to intravesicular HCO3 confirming that AmB causes efflux of HCO3. (e) To effect complete ion release, the POPC liposomes were lysed with Triton X-100 at the conclusion of the experiment. (f) Potassium efflux from POPC/10% cholesterol liposomes after addition of [AmB] equivalent to 1:1000 AmB:lipid, or DMSO vehicle. (g) Sodium efflux from POPC/10% cholesterol liposomes after addition of [AmB] equivalent to 1:1000 AmB:lipid, or DMSO vehicle. (h) Chloride efflux from POPC/10% cholesterol liposomes after addition of [AmB] equivalent to 1:1000 AmB:lipid, or DMSO vehicle. (i) Bicarbonate efflux from POPC/10% cholesterol liposomes after addition of [AmB] equivalent to 1:1000 AmB:lipid, or DMSO vehicle. Kinetics of efflux were measuring using rapid injection NMR to add AmB to liposomes. (j) Proton efflux from POPC/10% cholesterol liposomes after addition of [AmB] equivalent to 1:1000 AmB:lipid, or DMSO vehicle. In (b,d-j), a representative spectrum or graph from at least three independent experiments is shown. In all panels, measurements were taken from distinct samples. In panel (c), graph depicts mean ± SEM.
Extended Data Figure 2 |
Extended Data Figure 2 |. AmB-mediated pH changes are HCO3-dependent and do not alter major cation concentrations in the ASL.
(a) Base secretion and acid absorption rates in NuLi (HCO3 +: n = 8 biologically independent samples; HCO3 -: n = 4 biologically independent samples) or CuFi-1 (ΔF508/ΔF508) epithelia (HCO3 +: n = 23 biologically independent samples, p < 0.0001; HCO3 -: n = 18 biologically independent samples) over 20 minutes after acute addition of increasing [AmB], as measured by pH-stat titration (All n are biologically independent samples. HCO3 +: 0.5,1 μM, n = 6; 5 μM, n = 7. 0.5 μM p = 0.9663, 1 μM p = 0.7328, 5 μM p = 0.1459. HCO3 -: 0.5,1,5 μM, n = 6). The apical pH was titrated to a target pH of 6.0. The effect of AmB (2 μM) or FC-72 vehicle after 48 hours on (b) Na+ (p = 0.7855), (c) K+ (p = 0.2892), (d) 24Mg2+ (p = 0.8339) and (e) Ca2+ (p = 0.2708 with Welch’s correction) concentrations in the ASL in CuFi-1 (ΔF508/ΔF508) as measured by ICP-MS (n = 16 biologically independent samples). In panel (a), ANOVA was used to assess statistical significance. In panels (b-d), two-sided unpaired Student’s t test was used to assess statistical significance. In panel (e), two-sided unpaired Student’s t test with Welch’s correction was used. Graph depicts means ± SEM; NS, not significant; ****P ≤ 0.0001. In all panels, measurements were taken from biologically independent samples.
Extended Data Figure 3 |
Extended Data Figure 3 |. AmB treatment is sustained, ineffective on wild type, not due to increased CFTR activity, does not disturb membrane integrity, and is non-toxic.
The effect of AmB (2 μM) or FC-72 vehicle left on the surface of CuFi-1 (ΔF508/ΔF508) epithelia for (a) 7 (n = 6 biologically independent samples, p = 0.0004), (b) 14 (n = 9 biologically independent samples, p = 0.5138), or (c) 28 days (n = 6 biologically independent samples, p = 0.3421) on H14CO3 movement from the basolateral buffer to the ASL over 10 minutes post-radiolabel addition, as normalized to FC-72 vehicle addition. Changes in transepithelial current (It) after treatment with 10 μM forskolin/100 μM IBMX (FI) to activate CFTR and 1 μM CFTRinh-172 to inhibit CFTR in (d,g) NuLi (CFTR+/+) epithelia, (e,h) CuFi-1 (ΔF508/ΔF508) epithelia, and (f,i) CuFi-1 epithelia treated with AmB (2 μM; 48 hours) (n = 6 biologically independent samples). In (g) to (i), a representative graph from 6 independent experiments repeated with similar results is shown. (j) Transepithelial electrical resistance (Rt) in CuFi-1 epithelia did not differ between treatment with vehicle or increasing doses of AmB over increasing time periods after a single treatment (n = 9 biologically independent samples). (k) Cytotoxicity as measured by detection of lactase dehydrogenase in CuFi-1 epithelia over increasing time periods after a single AmB or vehicle treatment, represented as percent of total cellular lysis by Triton X-100. AmB treatment did not cause increased cytotoxicity as compared to vehicle (n = 12 biologically independent samples). In (a) to (c), two-sided unpaired Student’s t test was used to assess statistical significance. In (a) to (f) and (j) to (k), graphs depict means ± SEM; NS, not significant; ***P ≤ 0.001 relative to vehicle control. In all panels, measurements were taken from biologically independent samples.
Extended Data Figure 4 |
Extended Data Figure 4 |. AmB increases ASL height.
ASL height, as imaged by confocal microscopy, in (a) NuLi (CFTR+/+) epithelia, (b) CuFi-1 epithelia, (c) CuFi-1 epithelia with apical addition of AmB, (d) CuFi-1 epithelia with apical addition of C35deOAmB, (e) CuFi-1 epithelia with basolateral addition of AmB, and (f) NuLi and (g) AmB-treated CuFi-1 epithelia with basolateral addition of bumetanide (500 μM). Representative images from at least 6 independent experiments are shown. In all panels, measurements were taken from biologically independent samples. Scale bar represents 10 microns.
Extended Data Figure 5 |
Extended Data Figure 5 |. AmB restores ASL pH and antibacterial activity in primary cultures of human airway epithelia from donors with CF.
(a) Genotypes and Δ pH measurements of patient donors in ASL pH assay. (b) The effects of AmB (2 μM, 48 hours; n = 9 biologically independent samples, p = 0.446), C35deOAmB (2 μM, 48 hours; n = 5 biologically independent samples, p = 0.9994) and basolateral addition of AmB (2 μM, 48 hours; n = 3 biologically independent samples, p = 0.6359) on the average ASL pH of primary cultured airway epithelia derived from CF humans with different CFTR mutations. (c) The effect of AmB (2 μM, 48 hours; n = 7 biologically independent samples, p = 0.4866) on ASL pH in non-CF epithelia. (d) Genotypes of patient donors in ASL viscosity assay. (e) Genotypes of patient donors in ASL antibacterial activity assay. (f) The effect of AmB (2 μM, 48 hours; n = 8 biologically independent samples, p = 0.0042) and C35deOAmB (2 μM, 48 hours; n = 5 biologically independent samples, p = 0.9626) on the average ASL antibacterial activity of primary cultured airway epithelia derived from CF humans with different CFTR mutations. Antibacterial activity is measured by the % of S. aureus killed after exposure to ASL. (g) The ability of AmB (2 μM) alone to kill S. aureus as compared to saline (n = 36 biologically independent samples, p = 0.1569). Representative FRAP traces for measuring ASL viscosity from 6 independent experiments repeated with similar results are shown in (h) non-CF, (i) CF, and (j) AmB-treated CF epithelia. In panels (b) and (f), ANOVA was used to assess statistical significance. In panel (c), two-sided unpaired Student’s t test with Welch’s correction was used. In panel (g), two-sided unpaired Student’s t test was used to assess statistical significance. Graphs depict means ± SEM; NS, not significant; *P ≤ 0.05; **P ≤ 0.01. In all panels, measurements were taken from biologically independent samples.
Extended Data Figure 6 |
Extended Data Figure 6 |. AmBisome® increases transepithelial H14CO3 secretion and ASL pH in a time and dose-dependent manner.
(a) The effect of AmBisome® (1:1000 AmB:lipid ratio), AmB:Chol (1:1000 AmB:lipid ratio in DMSO), and sterile water or DMSO vehicle on H13CO3 transport across a POPC/10% cholesterol lipid membrane. (b) The effect of AmBisome® (1 mg/mL, 48 hours; n = 16 biologically independent samples, p = 0.0477) or FC-72 vehicle on H14CO3 movement from the basolateral buffer to the ASL over 10 minutes post-radiolabel addition in CuFi-1 (ΔF508/ΔF508) as normalized to FC-72 vehicle addition. (c) The effect of increasing [AmBisome®] (1 mg/mL, 48 hours; all concentrations, n = 9 biologically independent samples. 0.25 μM p = 0.0106, 2 μM p < 0.0001, 25 μM p = 0.0002, 50 μM p < 0.0001, 100 μM p < 0.0001) on ASL pH in CuFi-1 epithelia as compared to vehicle control. In panel (a), a representative graph from at least three independent experiments is shown. In panel (b), two-sided unpaired Student’s t test was used to assess statistical significance. In panel (c), ANOVA was used to assess statistical significance; delta and statistics are compared to FC-72 vehicle control. Graphs depict means ± SEM; NS, not significant; *P ≤ 0.05; ****P ≤ 0.0001 relative to vehicle control. In (a), the same sample for each replicate was measured repeatedly over time. In (b) and (c), measurements were taken from biologically independent samples.
Figure 1 |
Figure 1 |. AmB increased H14CO3 secretion and ASL pH in cultured CF airway epithelia.
(a) Effects of ivacaftor/forskolin or AmB on ASL pH in CuFi-4 (G551D/∆F508) epithelia (n = 6). (b) Effect of ivacaftor/forskolin (n = 12) or AmB (n = 10) on basolateral-to-apical H14CO3 secretion (n = 16). (c) Effect of vehicle (FC-72), ivacaftor/forskolin (n = 6), AmB (n = 28), C35deOAmB (n = 14), or basolateral AmB (n = 6) on ASL pH in NuLi (CFTR+/+) (n = 14) or CuFi-1 (∆F508/∆F508) epithelia (n = 37). (d) Effect of vehicle, ivacaftor/forskolin (n = 4), AmB (n = 18), C35deOAmB (n = 8), or basolateral AmB (n = 8) on H14CO3 secretion in NuLi (n = 8) or CuFi-1 epithelia (n = 37). (e) Effect of AmB (n = 6) on ASL pH in NuLi epithelia (n = 16). (f) Average difference in ASL pH after AmB treatment in CuFi-1 epithelia as a function of time (0, 0.5, 1, 2, 12 hours, n = 6; 6 hours, n = 9; 24 hours, n = 12; 48 hours, n = 28). (g) ASL height in NuLi (n = 21) or CuFi-1 epithelia (n = 21) after treatment with apical AmB (n = 21), C35deOAmB (n = 9), basolateral AmB (n = 6), or AmB with bumetanide (n = 12). ASL pH (h) and H14CO3 secretion (i) in CuFi-1 epithelia (n = 6) after addition of vehicle, apical AmB, or AmB with ouabain. n are biologically independent samples from at least two independent experiments with similar results. Graphs depict means ± SEM. Panels (a-d, g-i): one-way ANOVA with Tukey test for multiple comparisons. Panels (e,f): two-sided unpaired Student’s t test. Panel (d): * indicate difference versus vehicle. NS, not significant; *P ≤ 0.05; **P ≤ 0.01; ***P ≤ 0.001; ****P ≤ 0.0001. Exact P values in Source Data.
Figure 2 |
Figure 2 |. AmB improved host defenses in primary cultured airway epithelia derived from genetically diverse humans with CF.
(a) Effect of AmB on ASL pH on primary cultured airway epithelia derived from 9 humans with CF with different CFTR mutations (n = 9). (b) Average difference in ASL pH after AmB treatment as a function of time (t = 0, 0.5, 2 hours, n = 6; t = 6, 12, 24 hours, n = 3; t = 1, 48 hours, n = 9). Effect of apical AmB treatment on (c) ASL viscosity (τASLsaline) (n = 6) and (d) ASL antibacterial activity (n = 8) in primary CF epithelia. Graphs depict means ± SEM. Panels (a,b,d): each data point represents an average of 1-3 epithelia samples from each human donor. Panels (a,c,d): n are biologically independent samples from at least three independent experiments with similar results. Panel (b): the same samples for each donor were measured repeatedly over time and ** indicate differences versus vehicle; data is from at least three independent experiments with similar results. All panels: two-sided unpaired Student’s t test. *P ≤ 0.05; **P ≤ 0.01; ***P ≤ 0.001. Exact P values in Source Data.
Figure 3
Figure 3. AmBisome® increased ASL pH in cultured CF airway epithelia and in CFTR−/− pigs.
(a) Concentration-dependent effect of a pre-formed AmB:cholesterol complex on ASL pH (0 μM, n = 37; 0.25 μM, n = 15; 0.5, 50, 100 μM, n = 9; 2 μM, n = 28; 5, 10 μM, n = 16; 20, 25 μM, n = 12) in CuFi-1 (∆F508/∆F508) epithelia. The effect of AmBisome® on (b) ASL pH in CuFi-1 epithelia as a function of time (n = 9) and (c) H14CO3 secretion after 2 h (n = 20). (d) Effect of AmBisome® treatment on ASL pH of CFTR−/− pigs as compared to baseline (n = 4). n are biologically independent samples from at least three independent experiments with similar results. Graphs depict means ± SEM. Panels (a-c): two-sided unpaired Student’s t test (Welch’s correction used for a: 2, 5, 20 μM and b: 60 min). Panel (a), * indicate difference in AmB versus AmB:Chol. Panel (c): * indicate difference versus vehicle. Panel (d): the same pig was measured before and after AmBisome® as indicated by symbols joined by lines; paired Student’s t test. *P ≤ 0.05; **P ≤ 0.01; ***P ≤ 0.001. Exact P values in Source Data.

Comment in

References

    1. Ratjen F et al. Cystic fibrosis. Nat. Rev. Dis. Primers 1, 15010 (2015). - PMC - PubMed
    1. Quinton PM The neglected ion: HCO3−. Nat. Med. 7, 292–293 (2001). - PubMed
    1. Shah VS et al. Airway acidification initiates host defense abnormalities in cystic fibrosis mice. Science 351, 503–507 (2016). - PMC - PubMed
    1. Ramsey , B. W. et al. A CFTR potentiator in patients with cystic fibrosis and the G551D mutation. N. Engl. J. Med. 365, 1663–1672 (2011). - PMC - PubMed
    1. Wainwright CE et al. Lumacaftor–Ivacaftor in patients with cystic fibrosis Homozygous for Phe508del CFTR. N. Engl. J. Med. 373, 220–231 (2015). - PMC - PubMed

Methods References

    1. Zabner J et al. Development of cystic fibrosis and noncystic fibrosis airway cell lines. Am. J. Physiol. Lung Cell Mol. Physiol 284, L844–854 (2003). - PubMed
    1. Karp PH et al. An in vitro model of differentiated human airway epithelia. Methods for establishing primary cultures. Methods Mol. Biol. 188, 115–137 (2002). - PubMed
    1. Chen PS, Toribara TY & Warner H Microdetermination of Phosphorus. Anal. Chem. 28, 1756–1758 (1956).
    1. Andrews NJ et al. Structurally simple lipid bilayer transport agents for chloride and bicarbonate. Chem. Sci. 2, 256–260 (2011).
    1. Busschaert N et al. Tripodal transmembrane transporters for bicarbonate. Chem. Commun. (Camb.) 46, 6252–6254 (2010). - PubMed

Publication types

MeSH terms

Substances