. 2019 Mar;17(3):2004-2012.
doi: 10.3892/etm.2019.7204. Epub 2019 Jan 25.

Comparison of different cell culture plates for the enrichment of non-adherent human mononuclear cells

Affiliations

Comparison of different cell culture plates for the enrichment of non-adherent human mononuclear cells

Annett Klinder et al. Exp Ther Med. 2019 Mar.

Abstract

While tissue-resident monocytes and macrophages are considered to be vital players in the in vivo interaction between biomaterials and surrounding tissue, their isolation is limited. In order to establish in vitro models elucidating implant and tissue interactions, peripheral blood mononuclear cells (PBMCs) represent a viable source for bone marrow-derived monocytes and an alternative to tissue-resident cells. The aim of present study was to analyse different adhesion-preventing tissue culture plates for their potential to facilitate the culture of monocytes without differentiation into macrophages. Freshly isolated PBMCs were seeded into four commercially available tissue culture plates with different adhesive properties and were tested for surface CD14 and CD68 expression using flow cytometry following 7 days in culture. When PBMCs were cultivated in RPMI on Cellstar® Cell culture plates with Cell-Repellent Surface, a significant increase in CD14-positive cells was observed compared with cultivation in standard tissue culture-treated plates. This was accompanied by elevated cytokine production of interleukin-6 (IL6) and interleukin-8 (IL8); however, overall cell growth was not affected. When PBMCs were pre-cultured in cell-repellent plates, there was a higher yield of adherent cells after subsequent transfer into standard tissue culture-treated plates. Cultivation of PBMCs on cell-repellent culture plates favoured a monocytic phenotype and thus, represents an alternative to increase the fraction of monocytes yielded from PBMCs.

Keywords: adhesion; differentiation; hydrophilic; hydrophobic; monocytes; peripheral blood mononuclear cells.


Figures
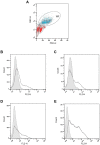
Figure 1.
Figure 1.
(A-E) Representative depiction of CD14 staining. (A) FSC and SSC gated MF overlaid with CD14 staining shown as blue dots (donor 14). Examples of comparison of CD14 stained cells in different cell culture media DMEM F12 (B and D) and RPMI (C and E) between TCPS control plates (B and C) and Repellent plates (D and E) analysed in the gated MF. Stained cells are shown as dark grey line against the background of the light grey shaded isotype control (all suspension cells, donor 14). Measurement was carried out with the BD FACS Calibur Flow Cytometer and data were analysed with the FlowJo 10 program. CD, cluster of differentiation; FSC, forward scatter; SSC, sideward scatter; MF, monocyte fraction; DMEM F12, Dulbecco's modified Eagle's medium nutrient mixture F-12; RPMI, Roswell Park Memorial Institute Medium; TCPS, tissue culture plates; BD, Becton Dickinson; FACS, fluorescence-activated cell sorting.
Figure 2.
Figure 2.
Percentage of cells in the monocyte fraction as gated with FSC and SSC after cultivation in different cell culture plates with (A) DMEM F12 or (B) RPMI. Measurement was carried out with the BD FACS Calibur Flow Cytometer and data were analysed with the FlowJo 10 program. Values are depicted as box plots with minimum, 25th percentile, median, 75th percentile and maximum of the gated cell number of the individual donors and experiments (n≥4). Statistical analysis was performed using Two-way ANOVA followed by Tukey's multiple comparisons as post test. *P<0.05, **P<0.01. FSC, forward scatter; SSC, sideward scatter; DMEM F12, Dulbecco's modified Eagle's medium nutrient mixture F-12; RPMI, Roswell Park Memorial Institute Medium; BD, Becton Dickinson; FACS, fluorescence-activated cell sorting, ANOVA, analysis of variance.
Figure 3.
Figure 3.
Percentage of CD14+ cells per total cells as determined by flow cytometry after cultivation in different cell culture plates with (A) DMEM F12 or (B) RPMI. Cells (1×10⁵) were stained with 0.1 µg of CD14 antibodies as well as the isotype control IgG1 and measured with the BD FACS Calibur Flow Cytometer. Data were analysed with the FlowJo 10 program and values are depicted as box plots with minimum, 25th percentile, median, 75th percentile and maximum of CD14 positive cells per total cells for the individual donors and experiments (n≥4). Statistical analysis was performed using Kruskal-Wallis test with Dunn's multiple comparisons test as post hoc test. *P<0.05. CD, cluster of differentiation; DMEM F12, Dulbecco's modified Eagle's medium nutrient mixture F-12; RPMI, Roswell Park Memorial Institute Medium; IgG1, immunoglobulin G1; BD, Becton Dickinson; FACS, fluorescence-activated cell sorting; TCPS, tissue culture plates.
Figure 4.
Figure 4.
(A-D) CD68 stained cells. Comparisons of CD68-stained cells in different cell culture media [(A and C) DMEM F12 and (B and D) RPMI] between TCPS control plates (C and D) and Repellent plates (A and B) analysed in the gated MF. Stained cells are shown as dark grey line against the background of the light grey shaded isotype control (all suspension cells, donor 14). Measurement was carried out with the BD FACS Calibur Flow Cytometer and data were analysed with the FlowJo 10 program. CD, cluster of differentiation; DMEM F12, Dulbecco's modified Eagle's medium nutrient mixture F-12; RPMI, Roswell Park Memorial Institute Medium; TCPS, tissue culture plates; MF, monocyte fraction; BD, Becton Dickinson; FACS, fluorescence-activated cell sorting.
Figure 5.
Figure 5.
Percentage of CD68+ cells per total cells as determined by flow cytometry after cultivation in different cell culture plates with (A) DMEM F12 or (B) RPMI. Cells (1×10⁵) were stained with 0.1 µg of CD68 antibodies as well as the isotype control IgG2 and measured with the BD FACS Calibur Flow Cytometer. Data were analysed with the FlowJo 10 program and values are depicted as box plots with minimum, 25th percentile, median, 75th percentile and maximum of CD68 positive cells per total cells for the individual donors and experiments (n≥4). Statistical analysis was performed using Kruskal-Wallis test with Dunn's multiple comparisons test as post hoc test. CD, cluster of differentiation; DMEM F12, Dulbecco's modified Eagle's medium nutrient mixture F-12; RPMI, Roswell Park Memorial Institute Medium; IgG2, immunoglobulin G2; BD, Becton Dickinson; FACS, fluorescence-activated cell sorting; TCPS, tissue culture plates.
Figure 6.
Figure 6.
Cell number of (A) suspension and (B) adherent cells (PBMCs) after 1, 3 and 7 days of cultivation in Repellent and TCPS control plates with RPMI. Freshly isolated PBMCs were seeded at a concentration of 1×10⁷ cells per well and harvested after 24 h, 3 days and 7 days. The number of cells was counted using a Thoma haemocytometer and Trypan Blue staining. Values are depicted as box plots with minimum, 25th percentile, median, 75th percentile and maximum of numbers of PBMCs from four different donors. Statistical analysis was performed using Repeated measures two-way ANOVA. *P<0.05; ***P<0.0001. PBMCs, peripheral blood mononuclear cells; TCPS, tissue culture plates; RPMI, Roswell Park Memorial Institute Medium.
Figure 7.
Figure 7.
Protein concentrations of (A) IL-6, (B) IL-8 and (C) MCP-1 in the supernatant of PBMCs after 7 days of cultivation in in Repellent and TCPS control plates with RPMI. Values are depicted as mean ± SD of three different donors. Statistical analysis was performed using either paired t-test. *P<0.05. IL, interleukin; MCP-1, monocyte chemoattractant protein-1; TCPS, tissue culture plates; RPMI, Roswell Park Memorial Institute Medium.
Figure 8.
Figure 8.
Comparison of metabolic activity of cells between repellent and control TCPS after transfer into normal TCPs as measured by (A) WST-1 assay and (B) live/dead staining of cells after transfer from cell-repellent culture plates into normal TCPs. Scale bar, 100 µm. Values are depicted as mean ± SD of three different donors. Statistical analysis was performed using paired t-test. ***P<0.001. TCPS, tissue culture plates; WST-1, water-soluble tetrazolium salt 1.

Similar articles

Cited by

References

    1. Ziegler-Heitbrock L, Ancuta P, Crowe S, Dalod M, Grau V, Hart DN, Leenen PJ, Liu YJ, MacPherson G, Randolph GJ, et al. Nomenclature of monocytes and dendritic cells in blood. Blood. 2010;116:e74–e80. doi: 10.1182/blood-2010-02-258558. - DOI - PubMed
    1. Ginhoux F, Guilliams M. Tissue-resident macrophage ontogeny and homeostasis. Immunity. 2016;44:439–449. doi: 10.1016/j.immuni.2016.02.024. - DOI - PubMed
    1. Yang J, Zhang L, Yu C, Yang XF, Wang H. Monocyte and macrophage differentiation: Circulation inflammatory monocyte as biomarker for inflammatory diseases. Biomark Res. 2014;2:1. doi: 10.1186/2050-7771-2-1. - DOI - PMC - PubMed
    1. Geissmann F, Manz MG, Jung S, Sieweke MH, Merad M, Ley K. Development of monocytes, macrophages, and dendritic cells. Science. 2010;327:656–661. doi: 10.1126/science.1178331. - DOI - PMC - PubMed
    1. Mosser DM, Edwards JP. Exploring the full spectrum of macrophage activation. Nat Rev Immunol. 2008;8:958–969. doi: 10.1038/nri2448. - DOI - PMC - PubMed