Near infrared imaging of epidermal growth factor receptor positive xenografts in mice with domain I/II specific antibody fragments
- PMID: 30867810
- PMCID: PMC6401412
- DOI: 10.7150/thno.30835
Near infrared imaging of epidermal growth factor receptor positive xenografts in mice with domain I/II specific antibody fragments
Abstract
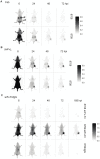
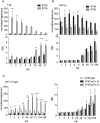
Epidermal growth factor receptor (EGFR) is a transmembrane cell surface receptor that is frequently overexpressed and/or mutated in many cancers. Therapies targeting EGFR have poor outcomes due to the lack of reliable diagnostic tests to monitor EGFR. Current in vitro EGFR diagnostic methods are invasive, requiring biopsies, which limits tumor sampling and availability. EGFR molecular imaging provides non-invasive whole-body images capable of detecting primary tumors and metastases, which can be used to diagnose and monitor response to therapy. Methods: We evaluated properties of two anti-EGFR fragments, 8708 and 8709, as molecular-targeted imaging probes. 8708 and 8709 are anti-EGFR antigen binding fragments (Fabs) that recognize domain I/II of EGFR, which is distinct from epitopes recognized by current anti-EGFR therapeutic antibodies. We used complementarity determining region sequences from 8708 and 8709 Fabs to generate an anti-EGFR IgG and (scFv)2 and scFv-Fc antibody fragments. We expressed, purified, and labeled the IgG and fragments with IRDye800CW and used them to image EGFR-positive and -negative xenografts in CD-1 nude mice. 8709 scFv-Fc was also tested for competitive binding with the therapeutic anti-EGFR antibody nimotuzumab and for quantifying ratios of EGFR and EGFRvIII deletion mutant. Results: IRDye800CW-labeled 8708 (scFv)2 and 8709 scFv-Fc imaging probes showed high levels of accumulation and good retention in EGFR-positive xenografts, with peak accumulation occurring at 24 and 48 hours post injection, respectively. IRDye680RD-labeled 8709 scFv-Fc did not compete with IRDye800CW-labeled nimotuzumab for EGFR binding as assayed by flow cytometry using an EGFR-positive cell line. IRDye680RD-labeled 8709 scFv-Fc and IRDye800CW-labeled nimotuzumab used in combination were able to determine the ratio of cells expressing EGFR and a deletion mutant EGFRvIII. Conclusion: IRDye800CW-labeled 8708 (scFv)2 and 8709 scFv-Fc had desirable binding affinities, clearance times, and tumor accumulation to be used for imaging in combination with current EGFR targeted therapies. This study highlights the potential for using 8708 (scFv)2 and 8709 scFv-Fc as EGFR diagnostic and therapy monitoring tools.
Keywords: EGFR; IRDye800CW; antibody fragments; near infrared fluorescence imaging.
Conflict of interest statement
Competing Interests: The authors have declared that no competing interest exists.
Figures


Similar articles
-
Evaluation of antibody fragment properties for near-infrared fluorescence imaging of HER3-positive cancer xenografts.Theranostics. 2018 Sep 9;8(17):4856-4869. doi: 10.7150/thno.24252. eCollection 2018. Theranostics. 2018. PMID: 30279742 Free PMC article.
-
Site-Specific Fluorescent Labeling of Antibodies and Diabodies Using SpyTag/SpyCatcher System for In Vivo Optical Imaging.Mol Imaging Biol. 2019 Feb;21(1):54-66. doi: 10.1007/s11307-018-1222-y. Mol Imaging Biol. 2019. PMID: 29948640
-
Near infrared fluorescence imaging of EGFR expression in vivo using IRDye800CW-nimotuzumab.Oncotarget. 2017 Dec 21;9(5):6213-6227. doi: 10.18632/oncotarget.23557. eCollection 2018 Jan 19. Oncotarget. 2017. PMID: 29464066 Free PMC article.
-
Single-chain anti-epidermal growth factor receptor antibody fragment conjugated to functionalized quantum dots.2009 Jan 22 [updated 2009 Mar 11]. In: Molecular Imaging and Contrast Agent Database (MICAD) [Internet]. Bethesda (MD): National Center for Biotechnology Information (US); 2004–2013. 2009 Jan 22 [updated 2009 Mar 11]. In: Molecular Imaging and Contrast Agent Database (MICAD) [Internet]. Bethesda (MD): National Center for Biotechnology Information (US); 2004–2013. PMID: 20641427 Free Books & Documents. Review.
-
L36-Cy5 anti-laminin trimerbody.2009 Jun 11 [updated 2009 Aug 18]. In: Molecular Imaging and Contrast Agent Database (MICAD) [Internet]. Bethesda (MD): National Center for Biotechnology Information (US); 2004–2013. 2009 Jun 11 [updated 2009 Aug 18]. In: Molecular Imaging and Contrast Agent Database (MICAD) [Internet]. Bethesda (MD): National Center for Biotechnology Information (US); 2004–2013. PMID: 20641540 Free Books & Documents. Review.
Cited by
-
Endoscopic Molecular Imaging plus Photoimmunotherapy: A New Strategy for Monitoring and Treatment of Bladder Cancer.Mol Ther Oncolytics. 2020 Aug 5;18:409-418. doi: 10.1016/j.omto.2020.07.010. eCollection 2020 Sep 25. Mol Ther Oncolytics. 2020. PMID: 32913890 Free PMC article. Review.
-
89Zr-Labeled Domain II-Specific scFv-Fc ImmunoPET Probe for Imaging Epidermal Growth Factor Receptor In Vivo.Cancers (Basel). 2021 Feb 1;13(3):560. doi: 10.3390/cancers13030560. Cancers (Basel). 2021. PMID: 33535661 Free PMC article.
-
Design, synthesis, and biological evaluation of Osimertinib-Cy7 (OSA-Cy7) conjugate as potential theranostic agent targeting activating EGFR mutations.BMC Biotechnol. 2025 Aug 26;25(1):87. doi: 10.1186/s12896-025-01025-w. BMC Biotechnol. 2025. PMID: 40855276 Free PMC article.
-
Noninvasive quantification of target availability during therapy using paired-agent fluorescence tomography.Theranostics. 2020 Sep 14;10(24):11230-11243. doi: 10.7150/thno.45273. eCollection 2020. Theranostics. 2020. PMID: 33042280 Free PMC article.
-
Fundamentals and developments in fluorescence-guided cancer surgery.Nat Rev Clin Oncol. 2022 Jan;19(1):9-22. doi: 10.1038/s41571-021-00548-3. Epub 2021 Sep 7. Nat Rev Clin Oncol. 2022. PMID: 34493858 Review.
References
-
- Wolff AC, Hammond ME, Hicks DG. et al. Recommendations for human epidermal growth factor receptor 2 testing in breast cancer: American society of clinical oncology/college of American pathologists clinical practice guideline update. J Clin Oncol. 2013;31:3997–4013. - PubMed
-
- Pereira PMR, Abma L, Henry KE. et al. Imaging of human epidermal growth factor receptors for patient selection and response monitoring - from PET imaging and beyond. Cancer Lett. 2018;419:139–51. - PubMed
-
- clinicaltrials.gov (NCT00691548, NCT01691391, NCT01987375, NCT02736578, NCT02855086, NCT03134846, NCT03384238, NCT03405142, NCT03510208, NCT03582124, NCT03733210, NCT03764137, NCT02415881). Accessed 24 December 2018. https://clinicaltrials.gov/
Publication types
MeSH terms
Substances
LinkOut - more resources
Full Text Sources
Other Literature Sources
Molecular Biology Databases
Research Materials
Miscellaneous

