. 2019 Jan 30;9(4):986-1000.
doi: 10.7150/thno.30199. eCollection 2019.

Collaborative ISL1/GATA3 interaction in controlling neuroblastoma oncogenic pathways overlapping with but distinct from MYCN

Affiliations

Collaborative ISL1/GATA3 interaction in controlling neuroblastoma oncogenic pathways overlapping with but distinct from MYCN

Qitong Zhang et al. Theranostics. .

Abstract

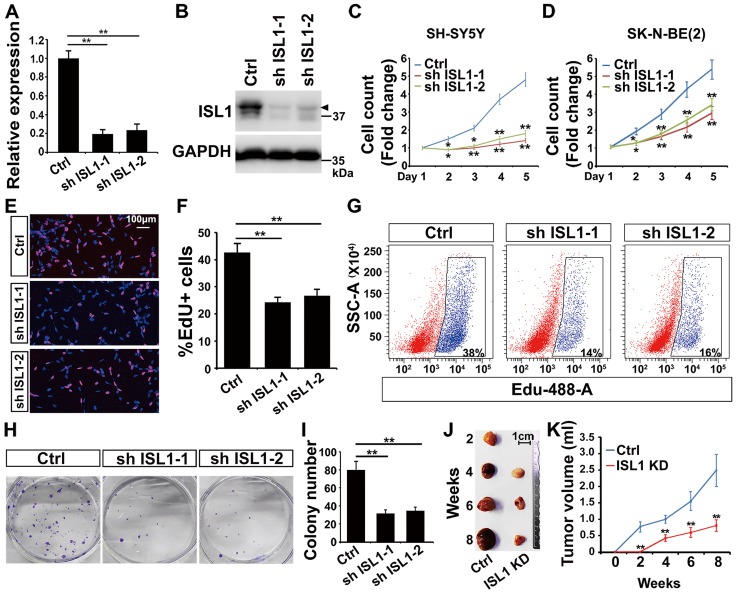
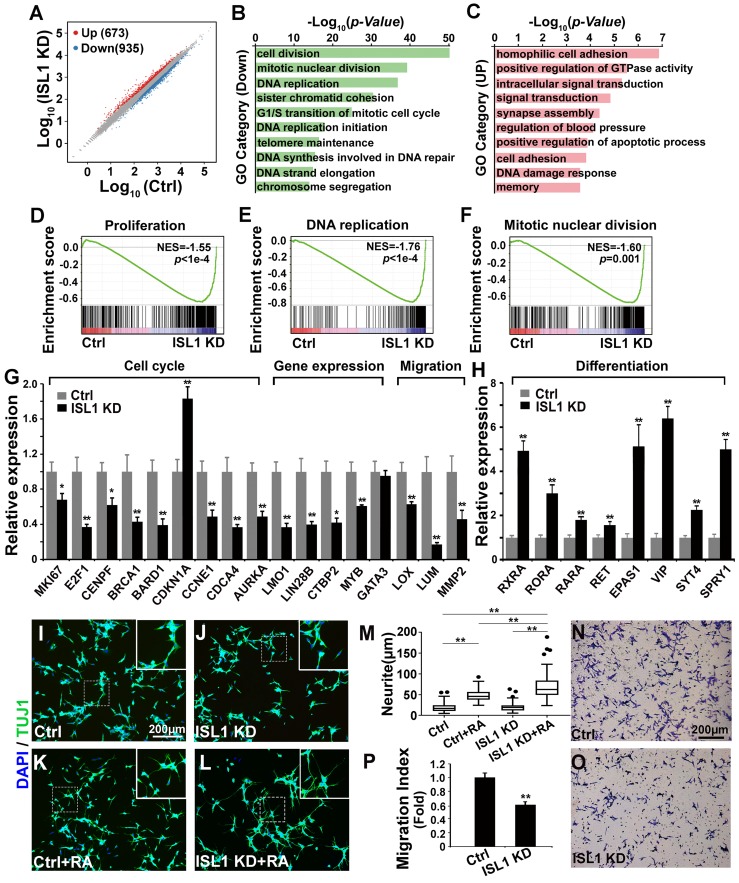
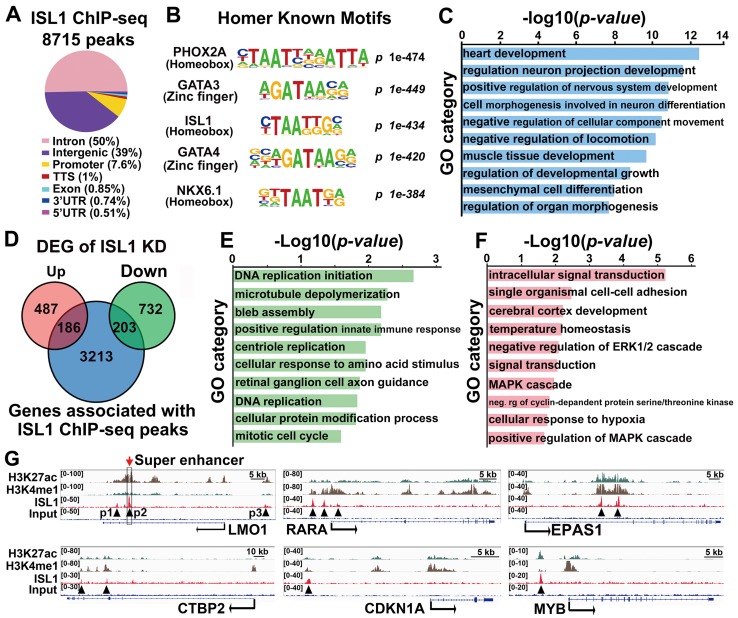
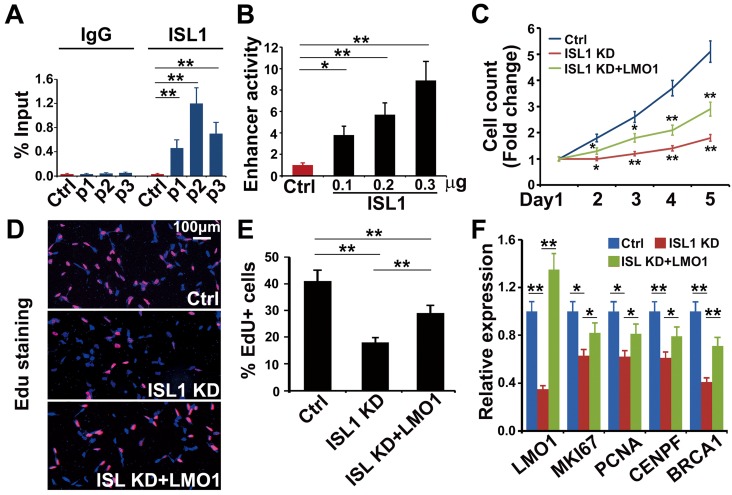
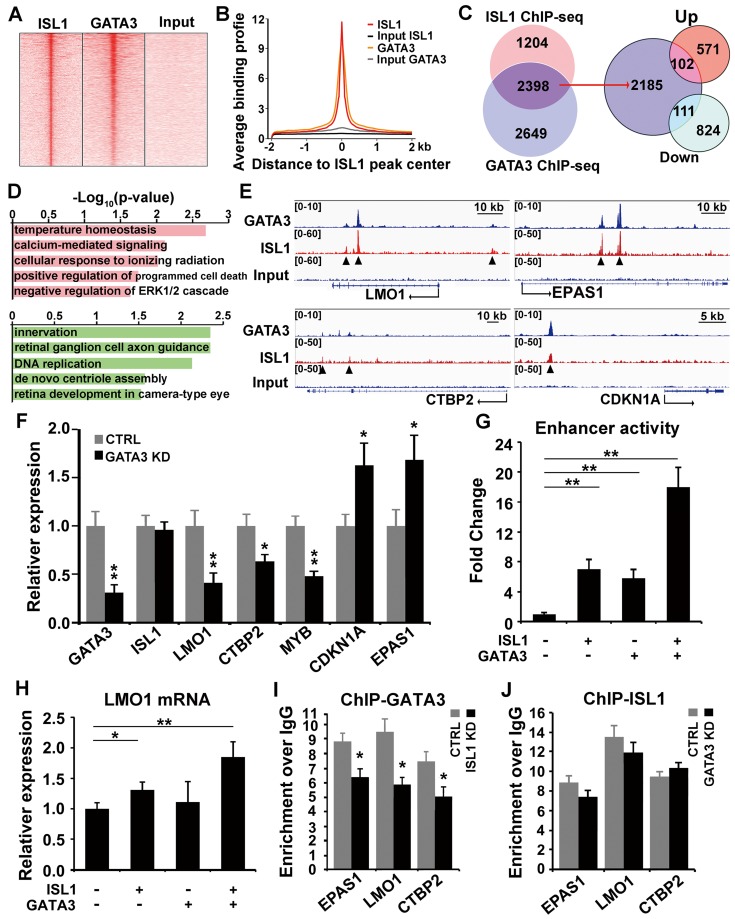
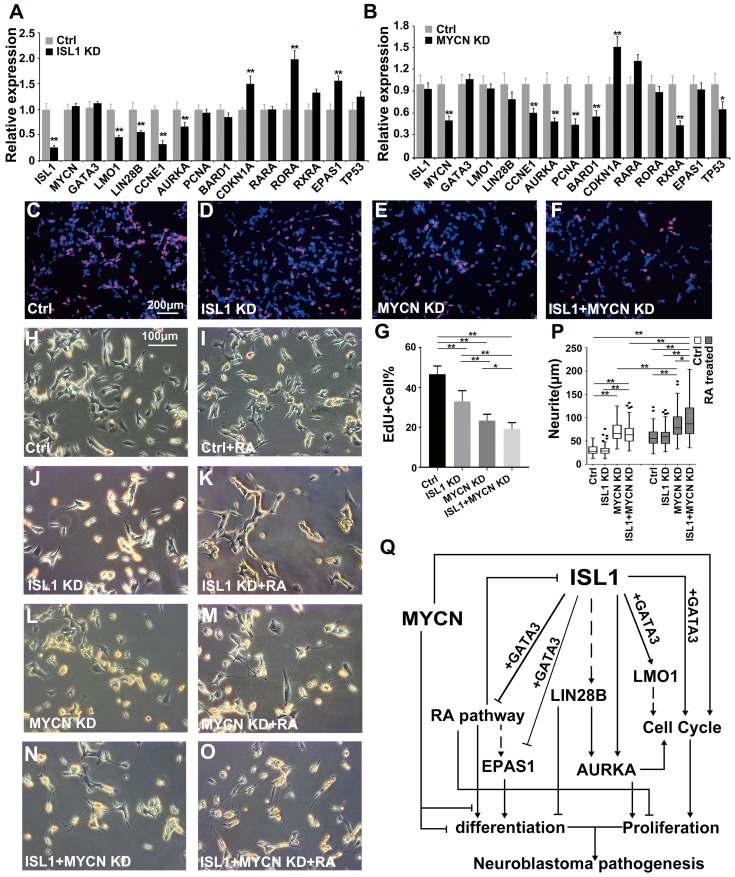
Background: Transcription factor ISL1 plays a critical role in sympathetic neurogenesis. Expression of ISL1 has been associated with neuroblastoma, a pediatric tumor derived from sympatho-adrenal progenitors, however the role of ISL1 in neuroblastoma remains unexplored. Method: Here, we knocked down ISL1 (KD) in SH-SY5Y neuroblastoma cells and performed RNA-seq and ISL1 ChIP-seq analyses. Results: Analyses of these data revealed that ISL1 acts upstream of multiple oncogenic genes and pathways essential for neuroblastoma proliferation and differentiation, including LMO1 and LIN28B. ISL1 promotes expression of a number of cell cycle associated genes, but represses differentiation associated genes including RA receptors and the downstream target genes EPAS1 and CDKN1A. Consequently, Knockdown of ISL1 inhibits neuroblastoma cell proliferation and migration in vitro and impedes tumor growth in vivo, and enhances neuronal differentiation by RA treatment. Furthermore, genome-wide mapping revealed a substantial co-occupancy of binding regions by ISL1 and GATA3, and ISL1 physically interacts with GATA3, and together they synergistically regulate the aforementioned oncogenic pathways. In addition, analyses of the roles of ISL1 and MYCN in MYCN-amplified and MYCN non-amplified neuroblastoma cells revealed an epistatic relationship between ISL1 and MYCN. ISL1 and MYCN function in parallel to regulate common yet distinct oncogenic pathways in neuroblastoma. Conclusion: Our study has demonstrated that ISL1 plays an essential role in neuroblastoma regulatory networks and may serve as a potential therapeutic target in neuroblastoma.

Keywords: GATA3; ISL1; RA signaling; genetic pathways; neuroblastoma.


Conflict of interest statement

Competing Interests: The authors have declared that no competing interest exists.

Figures

Figure 1
Figure 1
Knockdown of ISL1 results in inhibition of neuroblastoma growth. (A, B) Validation of shRNA-mediated knockdown ISL1 by qPCR and Western blot (Arrow head) in SH-SY5Y cells. Error bars represent standard deviation (±SD), n=3, *p<0.05, **p<0.01, 2-tailed t-test. (C, D) Knockdown of ISL1 with sh ISL1-1 and sh ISL1-2 results in inhibition of cell expansion in both SH-SY5Y and SK-N-BE(2) neuroblastoma cells. Error bars represent ±SD, n=6, *p<0.05, **p<0.01, 2-tailed t-test). (E) EdU staining of ISL1 KD and control SH-SY5Y cells. (F) Quantification of EdU-positive cell percentage. Error bars represent ±SD; ** p<0.01, n=5, 2-tailed t-test. (G) Flow cytometric analysis of EdU-positive cells in ISL1 KD and control SH-SY5Y cells. (H, I) Colony formation of ISL1 KD and control SH-SY5Y cells. Quantification of the total number of colonies in ISL1 KD and control cultures. Error bars represent ±SD; n=4, ** p<0.01, 2-tailed t-test. (J, K) Tumor formation following subcutaneous injection of ISL1 KD and control SH-SY5Y cells. Images of SH-SY5Y-derived tumors presented (J), and tumor volume size monitored at indicated days post-injection (K). Error bars represent ±SD; n=3; *p<0.05, **p<0.01, 2-tailed t-test.
Figure 2
Figure 2
Essential role of ISL1 in regulating genes required for neuroblastoma pathogenesis. (A) Scatterplot of RNA-seq showing relative gene expression of mRNA in ISL1 KD and control SH-SY5Y cells. Red and blue represent genes upregulated or downregulated, respectively. (B, C) Gene Ontology (GO) functional clustering of genes down- and upregulated in ISL1 KD SH-SY5Y cells, highlighting pathways most significantly affected in ISL1 KD neuroblastoma cells (top 10 categories are shown). (D-F) Gene Set Enrichment Analysis (GSEA) showing downregulation of genesets involved in cell proliferation, DNA replication and mitotic nuclear division in ISL1 KD SH-SY5Y cells. (G. H) qPCR validation of selected downregulated and upregulated genes in ISL1 KD neuroblastoma, respectively Error bars represent ±SD, n=3 per group, *p<0.05; **p<0.01; 2-tailed t-test). (I-K) Increased RA-induced neurite outgrowth in ISL1 KD neuroblastoma cells. All images were taken at 72 hours after RA or DMSO treatment. The extended neurites were stained with TUJ1. (M) Quantification of the length of neurites. The images from three biological replicates were pooled, and the length of longest neurite of individual cells was measured. The number of measured cells (n) per treatment group is 100. (*p<0.05; **p<0.01; 2-tailed t-test). (N-P) Transwell migration assay showing significantly reduced invasion and migration of ISL1 KD cells compared to control cells. The cells that have migrated through the membrane are stained and counted (P). Error bars represent ±SD, n=5 per group, *p<0.05; **p<0.01; 2-tailed t-test).
Figure 3
Figure 3
ISL1 directly regulates genes involved in neuroblastoma proliferation and differentiation. (A) Genome-wide distribution of ISL1 ChIP-Seq peaks mapped relative to their nearest TSS (transcription start site). Annotation indicates the positions of peaks are in TTS (transcription termination site, defined as from -100bp to +1Kb), exon, 5'UTR, 3'UTR, intronic or intergenic. (B) Top motifs enriched in ISL1-bound regions. (C) GO analysis of genes associated with ISL1 ChIP-seq peaks (top 10 categories are shown). (D) Intersection of ISL1 ChIP-seq and ISL1 KD RNA-seq datasets revealed 389 direct downstream targets of ISL1 (186 upregulated and 203 downregulated) in neuroblastoma (DEG: differentially expressed genes). (E, F) Enriched GO terms of direct targets of ISL1 downregulated (E) and upregulated (F) in neuroblastoma (top 10 categories are shown). (G) Integrative Genomics Viewer (IGV) showing ChIP-seq tracks for H3K4me1, H3K27ac, and ISL1 at the loci of representative ISL1 target genes in neuroblastoma (arrowhead showing binding peaks).
Figure 4
Figure 4
LMO1 is a direct downstream target of ISL1 in neuroblastoma. (A) ChIP-qPCR showing binding of ISL1 at P1, P2 and P3 enhancer regions of LMO1. Error bars represent ±SD; n=3, **p<0.01, 2-tailed t-test. (B) Luciferase assay showing LMO1 superenhancer activity in the presence of ISL1. Error bars represent ±SD; n=3, **p<0.01, 2-tailed t-test. (C) Re-expression of LMO1 partially restores cell growth of ISL1 KD neuroblastoma cells. Error bars represent ±SD, n=6, *p<0.05; **p<0.01; 2-tailed t-test). (D) EdU staining showing re-expression of LMO1 partially restores proliferation of ISL1 KD neuroblastoma cells. (E) Quantification of EdU-positive cells. Error bars represent ±SD, n=5, *p<0.05; **p<0.01. (G) qPCR showing restored proliferation gene expression. Error bars represent ±SD, n=3, *p<0.05; **p<0.01, 2-tailed t-test).
Figure 5
Figure 5
ISL1 and Gata3 synergistically activate downstream genes in neuroblastoma. (A. B) Heatmap (A) and aggregation plot (B) of ChIP-Seq mapped reads of Gata3 and ISL1 at all ISL1 binding sites. (C) Overlay of ISL1 ChIP-seq and GATA3 ChIP-seq datasets in SH-SY5Y (left). Overlay of the common target genes of ISL1 and GATA3 with genes differentially expressed in ISL1 KD neuroblastoma cells. (right). (D) GO terms enriched in common direct targets of ISL1 and GATA3 upregulated or downregulated in ISL1 KD neuroblastoma (top 5 not redundant categories are shown). (E) Integrative Genomics Viewer (IGV) showing ChIP-seq tracks for ISL1 and GATA3 at the loci of representative common target genes in neuroblastoma (arrowhead showing binding peaks). (F) qPCR analysis of GATA3 KD SH-SY5Y cells, showing similar alterations in expression of selected ISL1 target genes, noting that ISL1 expression is not altered. Error bars represent ±SD, n=3, *p<0.05; **p<0.01, 2-tailed t-test. (G) LMO1 enhancer Luciferase analysis in the presence of ISL1 and/or GATA3. Error bars represent ±SD, n=3, **p<0.01, 2-tailed t-test). (H) LMO1 mRNA expression in 293T cells transfected with ISL1 and/or GATA3. Error bars represent ±SD; n=3; *p<0.05, **p<0.01, 2-tailed t-test. (I, J) GATA3 ChIP-qPCR analysis of ISL1 KD neuroblastoma cells (I) and ISL1 ChIP-qPCR of GATA3 KD neuroblastoma cells (J) on selected common targets of ISL1 and GATA3. Error bars represent ±SD; n=3; *p<0.05, **p<0.01, 2-tailed t-test.
Figure 6
Figure 6
ISL1 and MYCN act in parallel to regulate common yet distinct oncogenic pathways in neuroblastoma. (A, B) Relative mRNA expression of ISL1, MYCN, GATA3 and selected ISL1 or MYCN downstream genes in ISL1 KD and MYCN KD SK-N-BE(2) neuroblastoma cells. Error bars represent ±SD; n=3; *p<0.05, **p<0.01, 2-tailed t-test. (C-G) EdU staining of control, ISL1 KD, MYCN KD and MYCN/ISL1 double-KD SK-N-BE(2) cells, and quantification of EdU-positive cells. Error bars represent ±SD; ** p<0.01, n=5, 2-tailed t-test. (H-P) neurite outgrowth of ISL1 KD, MYCN KD, ISL1/MYCN-double KD and control SK-N-BE(2) cells with or without RA. All images were taken at 72 hours after RA or DMSO treatment. The images from three biological replicates were pooled, and the length of longest neurite of individual cells was measured (P). In RA untreated groups, the number of measured cells (n) in Ctrl, ISL1 KD, MYCN KD and ISL1/MYCN double-KD group is 100, 98, 95 and 95, respectively. In RA treated groups, the number of measured cells (n) in Ctrl, ISL1 KD, MYCN KD and ISL1/MYCN double-KD group is 105, 121, 96 and 95, respectively. (*p<0.05; **p<0.01; 2-tailed t-test). (Q) The regulatory network controlling neuroblastoma pathogenesis. ISL1, together with GATA3, acts upstream of multiple oncogenic pathway essential for neuroblastoma proliferation and differentiation. In MYCN-amplified SK-N-BE(2) neuroblastoma cells, MYCN acts in parallel with ISL1 to control the cell cycle and RA-mediated differentiation. In addition, MYCN can suppress differentiation (neurite outgrowth) independent of RA pathways.

Similar articles

Cited by

References

    1. Cheung NKV, Dyer MA. Neuroblastoma: developmental biology, cancer genomics and immunotherapy. Nat Rev Cancer. 2013;13:397–411. - PMC - PubMed
    1. Maris JM. Recent advances in neuroblastoma. N Engl J Med. 2010;362:2202–11. - PMC - PubMed
    1. Pinto NR, Applebaum MA, Volchenboum SL, Matthay KK, London WB, Ambros PF. et al. Advances in Risk Classification and Treatment Strategies for Neuroblastoma. J Clin Oncol. 2015;33:3008–U105. - PMC - PubMed
    1. Schleiermacher G, Janoueix-Lerosey I, Delattre O. Recent insights into the biology of neuroblastoma. International journal of cancer. 2014;135:2249–61. - PubMed
    1. Olsen RR, Otero JH, Garcia-Lopez J, Wallace K, Finkelstein D, Rehg JE. et al. MYCN induces neuroblastoma in primary neural crest cells. Oncogene. 2017;36:5075–82. - PMC - PubMed

Publication types

MeSH terms

Substances