. 2019 Jan 30;9(4):1125-1143.
doi: 10.7150/thno.29566. eCollection 2019.

Microporous polysaccharide multilayer coated BCP composite scaffolds with immobilised calcitriol promote osteoporotic bone regeneration both in vitro and in vivo

Affiliations

Microporous polysaccharide multilayer coated BCP composite scaffolds with immobilised calcitriol promote osteoporotic bone regeneration both in vitro and in vivo

Qian Tang et al. Theranostics. .

Erratum in

Abstract

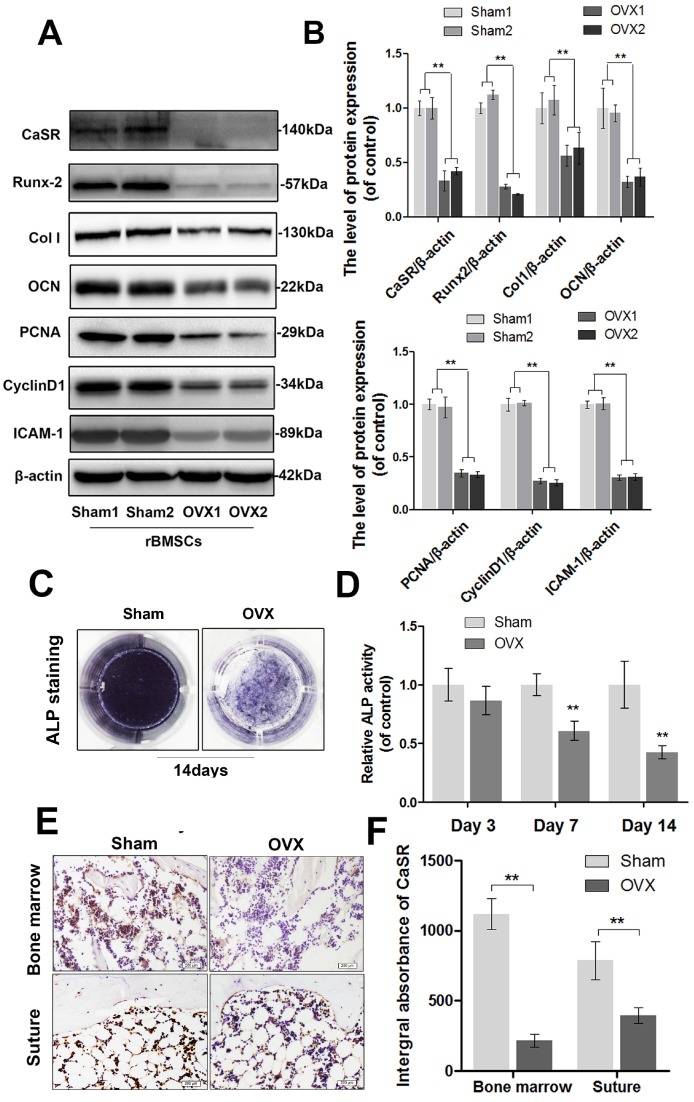
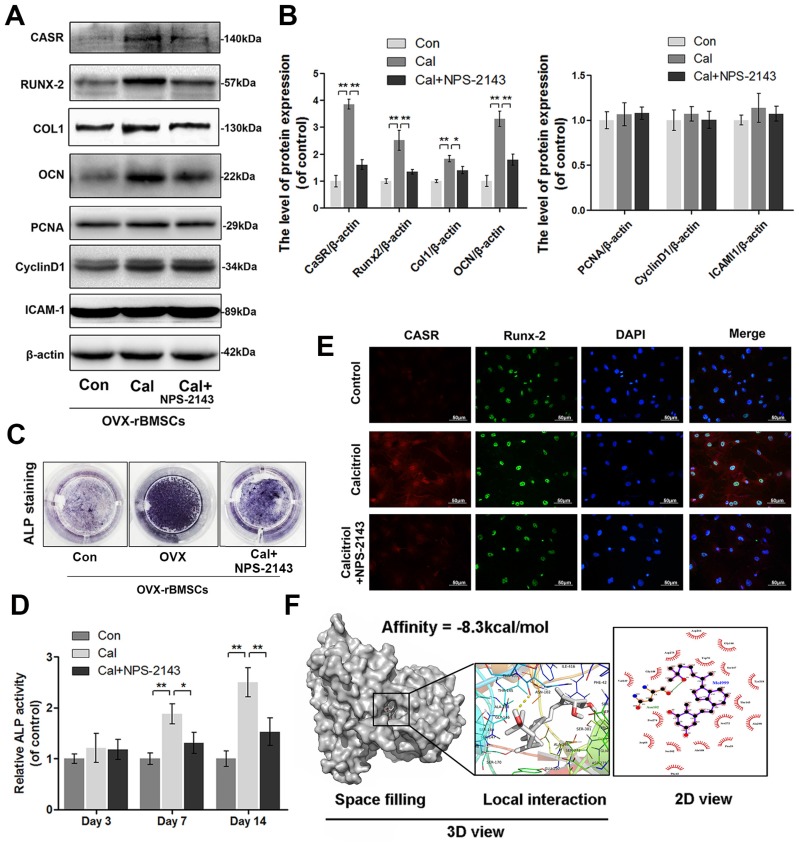
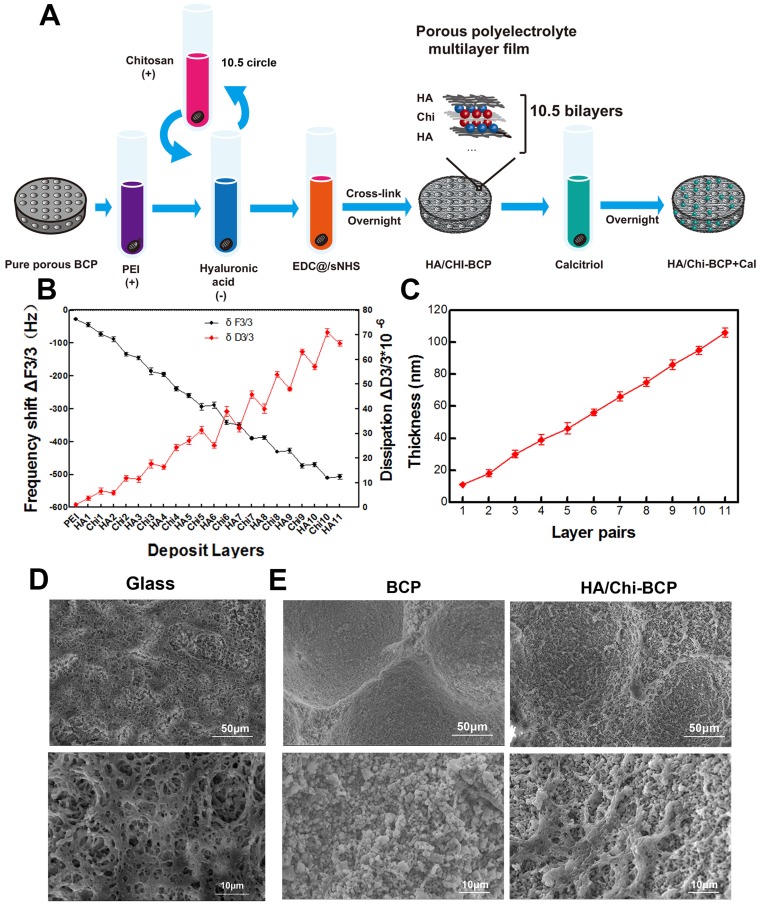
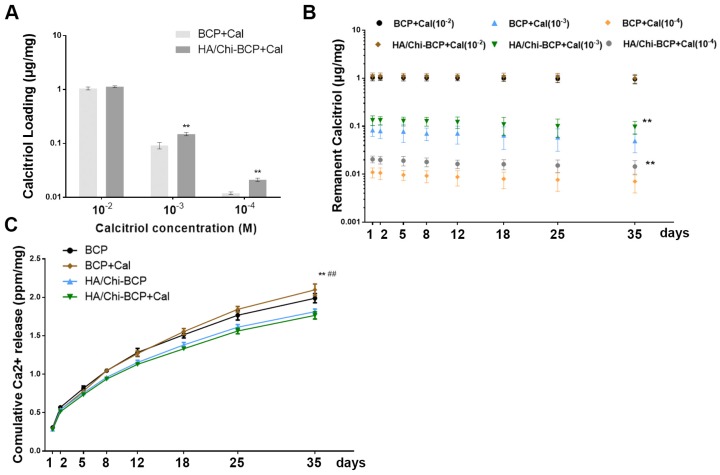
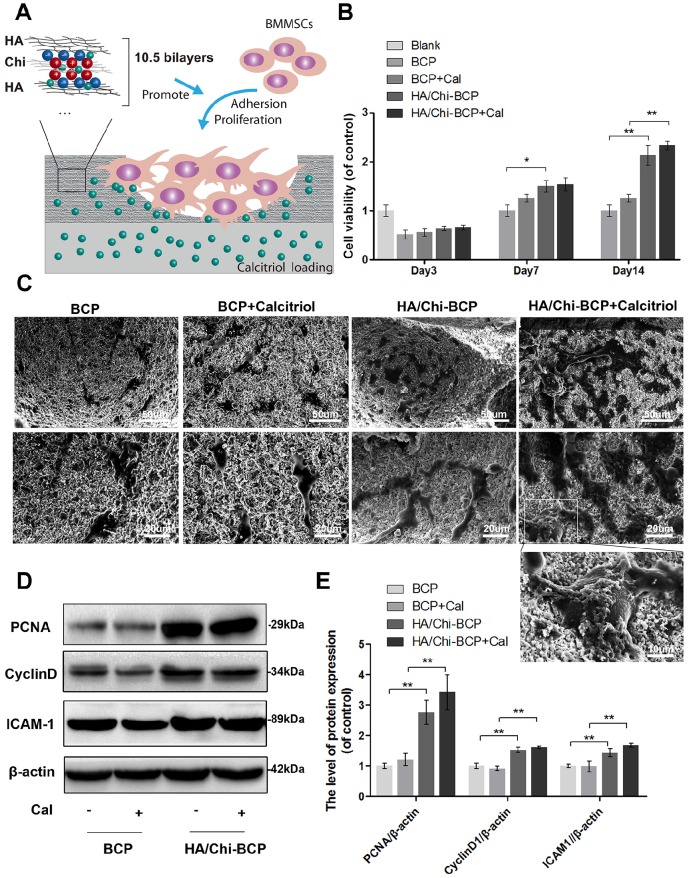
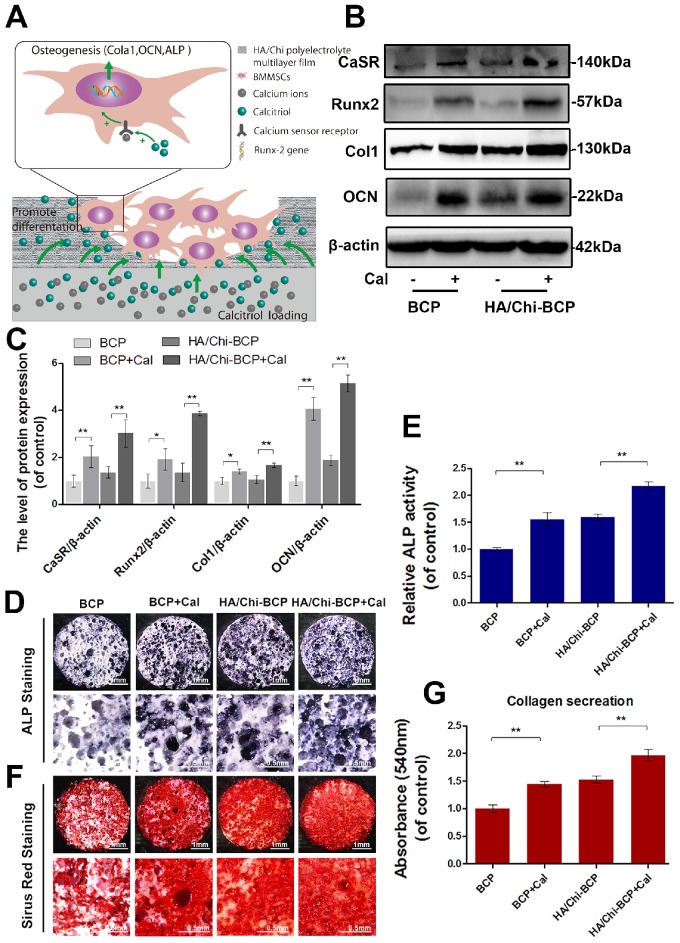
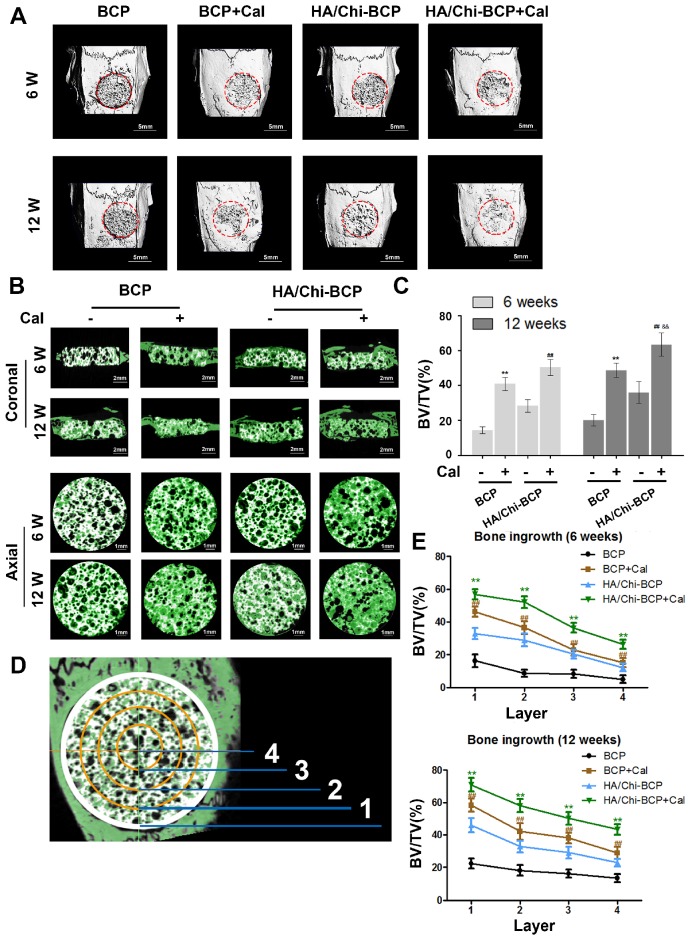
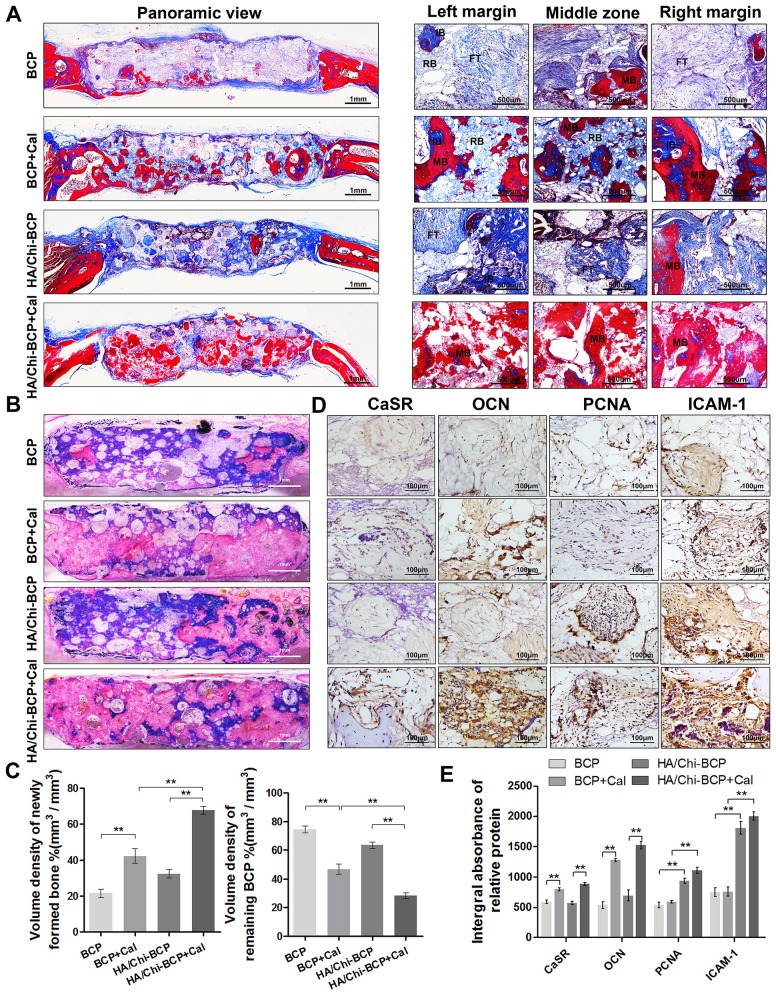
Incorporating a biomimetic coating and integrating osteoinductive biomolecules into basic bone substitutes are two common strategies to improve osteogenic capabilities in bone tissue engineering. Currently, the underlying mechanism of osteoporosis (OP)-related deficiency of osteogenesis remains unclear, and few treatments target at OP-related bone regeneration. Herein, we describe a self-assembling polyelectrolyte multilayered (PEM) film coating with local immobilisation of calcitriol (Cal) in biphasic calcium phosphate (BCP) scaffolds to promote osteoporotic bone regeneration by targeting the calcium sensing receptor (CaSR). Methods: The ovariectomy-induced functional changes in bone marrow mesenchymal stem cells (BMSCs), protective effects of Cal, and the potential mechanism were all verified. A PEM film composed of hyaluronic acid (HA) and chitosan (Chi) was prepared through layer-by-layer self-assembly. The morphology, growth behaviour, and drug retention capability of the composite scaffolds were characterised, and their biocompatibility and therapeutic efficacy for bone regeneration were systematically explored in vitro and in vivo.Results: The osteogenic differentiation, adhesion, and proliferation abilities of ovariectomised rat BMSCs (OVX-rBMSCs) decreased, in accordance with the deficiency of CaSR. Cal effectively activated osteogenesis in these OVX-rBMSCs by binding specifically to the active pocket of the CaSR structure, while the biomimetic PEM coating augmented OVX-rBMSCs proliferation and adhesion due to its porous surface structure. The PEM-coated scaffolds showed advantages in Cal loading and retention, especially at lower drug concentrations. HA/Chi PEM synergised with Cal to improve the proliferation, adhesion, and osteogenesis of OVX-rBMSCs and promote bone regeneration and BCP degradation in the critical-size calvarial bone defect model of OVX rats. Conclusion: A composite scaffold based on BCP, created by simply combining a biomimetic PEM coating and Cal immobilisation, could be clinically useful and has marked advantages as a targeted, off-the-shelf, cell-free treatment option for osteoporotic bone regeneration.

Keywords: calcitriol; critical-size bone defect; layer-by-layer assembly; osteoporosis; polysaccharide.


Conflict of interest statement

Competing Interests: The authors have declared that no competing interest exists.

Figures

Figure 1
Figure 1
Expression of CaSR and the osteogenic differentiation, proliferation, and adhesion capabilities of sham-rBMSCs and OVX-rBMSCs. (A) Representative western blot results of CaSR, Runx-2, collagen I, OCN, PCNA, cyclin D1, and ICAM-1 expression. (B) Quantification of western blot data shown in A. (C) Representative images of ALP staining of sham-rBMSCs and OVX-rBMSCs at day 14. (D) Quantitative analysis of ALP expression at days 3, 7, and 14. (E) Immunohistochemical staining of CaSR expression in the bone marrow and calvarial suture (original magnification 100×, scale bar: 200 μm). (F) Quantitative analysis of E. Data are presented as the mean ± S.D. Significant differences between the sham and OVX groups are indicated as ** P < 0.01, * P < 0.05, n = 5.
Figure 2
Figure 2
Expression of CaSR and the osteogenic differentiation, proliferation, and adhesion capabilities of OVX-rBMSCs after Cal administration. (A) Representative western blot results for CaSR, Runx-2, collagen I, OCN, PCNA, cyclin D1, and ICAM-1 expression. (B) Quantification of western blot data shown in A. (C) Representative image of ALP staining of OVX-rBMSCs with Cal and Cal+NPS-2143 treatments at day 14. (D) Quantitative analysis of ALP expression at days 3, 7, and 14. (E) Immunofluorescence staining of CaSR proteins (red), Runx-2 proteins (green), and DAPI-labelled nucleus (blue). Scale bars are 50 μm. (F) Cal docked with the CaSR structure. Docking studies were performed as described in the materials and methods section. A space-filling model showed the binding of Cal in the active binding pocket. The protein residues and hydrogen bonds are shown to have local interactions. Hydrogen bonds and hydrophobic bonds are shown in the 2D view. Data are presented as the mean ± S.D. Significant differences between the treatment and control groups are indicated as ** P < 0.01, * P < 0.05, n = 5.
Figure 3
Figure 3
Characters of PEM coating. (A) Schematic illustration of the preparation of a composite porous BCP scaffold coated with an HA/Chi multilayer and loaded with Cal. (B) QCM-D data of HA/Chi film build-up, frequency shifts, and dissipations of harmonic n = 3 are shown. (C) Film thickness versus layer pairs calculated by Qsoft. (D) SEM image of an HA/Chi film built on a glass slide (scale bars: 50 μm, 10 μm). (E) SEM image of BCP and HA/Chi-BCP (scale bars: 50 μm, 10 μm).
Figure 4
Figure 4
Drug loading and retention ability and ions releasing profile. (A) Cal loading amounts in BCP and HA/Chi-BCP were quantified through UPLC. (B) UPLC results of the retained amounts of Cal in BCP and HA/Chi-BCP loaded with drug concentrations of 10-2, 10-3, and 10-4 M at 1, 2, 5, 8, 12, 18, 25, and 35 days. (C) ICP-MS results of the cumulative release of calcium ions from various scaffolds. Data are presented as the mean ± S.D. Significant differences between the HA/Chi-BCP and bare BCP are indicated as ** P < 0.01; differences between the HA/Chi-BCP+Cal and BCP+Cal groups are indicated as ## P < 0.01; all n = 5.
Figure 5
Figure 5
Effects of different scaffolds on OVX-rBMSCs proliferation and adhesion. (A) Schematic illustration of the effects of porous HA/Chi film on cell proliferation and adhesion. (B) Cell viability on various scaffolds tested using the CCK-8 assay. (C) SEM images of the morphology of OVX-rBMSCs on different scaffolds at day 14 (scale bars: 50, 20, and 10 μm). (D-E) Representative western blot results and quantification data for PCNA, cyclin D1, and ICAM-1. Data are presented as the mean ± S.D. Significant differences among scaffold groups are indicated as ** P < 0.01, * P < 0.05, n = 5.
Figure 6
Figure 6
Effects of different scaffolds on OVX-rBMSCs osteogenic differentiation. (A) Schematic illustration of the effects of Cal loaded in BCP scaffolds on osteogenic differentiation of cells. (B-C) Representative western blot results and quantification of CaSR, Runx-2, Col I, and OCN expression. (D) Representative images of ALP staining results for rBMSCs after cultivation on scaffolds for 14 days. Original magnifications 7.5×, 30×; Scale bars: 1 mm, 0.5 mm. (E) Quantitative colourimetric results of ALP activities of cells on different BCP scaffolds. (F) Representative images of Sirius red staining results for rBMSCs after cultivation on scaffolds for 14 days. Original magnification 7.5×, 30×; Scale bars: 1 mm, 0.5 mm. (G) Quantitative results of collagen secretion by cells on various BCP scaffolds. Data are presented as the mean ± S.D. Significant differences among scaffold groups are indicated as ** P < 0.01, * P < 0.05, n = 5.
Figure 7
Figure 7
Micro-CT analysis of the effects of various BCP scaffolds on new bone formation in the critical-size bone defect model of OVX rats. (A) Three-dimensional reconstruction of micro-CT images of the various scaffolds implanted in the rat calvarium at 6 and 12 weeks (scale bars: 5 mm). (B) Two-dimensional reconstruction of micro-CT images of various scaffolds implanted in the rat calvarium at 6 and 12 weeks (the white colour component shows the remaining scaffold, bone that grew around and into the scaffolds is labelled in green) (scale bars: 2 mm for coronal images and 1 mm for axial images). (C) Regenerated bone volumes on the various scaffolds were quantified as bone volume divided by total volume (BV/TV). (D) General sketch of the scaffold, which was divided into four layers. (E) Percentages of bone volume regenerated into the scaffold in different layers from the edge to the centre. Data are presented as the mean ± S.D. Significant differences among scaffold groups are indicated as ** P < 0.01, * P < 0.05, compared with BCP; ## P < 0.01, # P < 0.05 compared with HA/Chi-BCP, and && P < 0.01, & P < 0.05 compared with BCP+Cal; for each group, n = 5.
Figure 8
Figure 8
Histological evaluation of new bone formation in the critical-size bone defect model of OVX rats after 12 weeks. (A) Masson's trichrome staining of decalcified bone including full-image and magnified views from different sites in the defect area. FT, fibrous tissue; IB, immature bone; MB, mature bone; and RB, resident BCP. Scale bars, 1 mm, 500 μm; magnification 50×, 200×. (B) Representative full image of undecalcified bone; the section was stained with McNeal's tetrachrome, basic fuchsine, and toluidine blue O. Pink staining represents bone tissue and blue staining represents remaining BCP (original magnification 10×; scale bar, 1 mm). (C) Histomorphometric measurements of the volume density of total newly formed bone (pink) and remaining BCP scaffold (blue) at 12 weeks after implantation according to McNeal's staining. Values are shown as the mean ± S.D. ** P < 0.01, * P < 0.05, indicating significant differences between groups. (D) Representative images showing immunohistochemical staining of CaSR, OCN, PCNA, and ICAM-1 expression in the defect area (original magnification, 100×; scale bar, 100 μm). (E) Quantification data for CaSR, OCN, PCNA, and ICAM-1 expression based on D. Data are presented as the mean ± S.D. Significant differences among groups are indicated as ** P < 0.01, * P < 0.05, n = 5.

References

    1. Rachner TD, Khosla S, Hofbauer LC. Osteoporosis: now and the future. Lancet. 2011;377:1276–87. - PMC - PubMed
    1. Verron E, Gauthier O, Janvier P, Pilet P, Lesoeur J, Bujoli B. et al. In vivo bone augmentation in an osteoporotic environment using bisphosphonate-loaded calcium deficient apatite. Biomaterials. 2010;31:7776–84. - PubMed
    1. Cooper C, Campion G, Melton LJ 3rd. Hip fractures in the elderly: a world-wide projection. Osteoporosis international: a journal established as result of cooperation between the European Foundation for Osteoporosis and the National Osteoporosis Foundation of the USA. 1992;2:285–9. - PubMed
    1. Wright NC, Looker AC, Saag KG, Curtis JR, Delzell ES, Randall S. et al. The recent prevalence of osteoporosis and low bone mass in the United States based on bone mineral density at the femoral neck or lumbar spine. Journal of bone and mineral research: the official journal of the American Society for Bone and Mineral Research. 2014;29:2520–6. - PMC - PubMed
    1. Bonn D. New ways with old bones. Osteoporosis researchers look for drugs to replace hormone replacement therapy. Lancet. 2004;363:786–7. - PubMed

Publication types

MeSH terms