

doi: 10.1257/app.20160404.
Do Low Levels of Blood Lead Reduce Children's Future Test Scores?
Affiliations
- PMID: 30867889
- PMCID: PMC6411080
- DOI: 10.1257/app.20160404
Item in Clipboard
Do Low Levels of Blood Lead Reduce Children's Future Test Scores?
Am Econ J Appl Econ.
2018 Jan.
Abstract
We construct a unique individual-level dataset linking preschool blood lead levels with third grade test scores for Rhode Island children born 1997-2005. Using two identification strategies, we show for the first time that reductions of lead from even historically low levels have significant positive effects. A one-unit decrease in average blood lead levels reduces the probability of being substantially below proficient in reading (math) by 0.96 (0.79) percentage points on a baseline of 12 (16) percent. Since disadvantaged children have greater exposure to lead, lead poisoning may be one of the causes of continuing disparities in test scores.
Figures
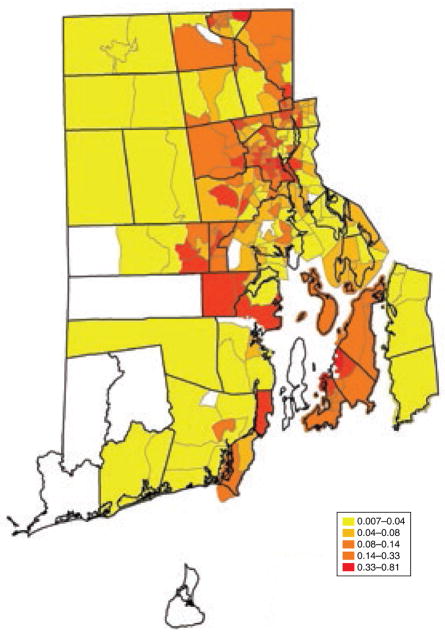
Total Certifications per Pre-1979 Unit

Certificates per 1,000 Population and 1997 Tract Characteristics Notes: Each observation is a census tract. The linear fit and 95 percent confidence interval is generated from a simple regression of the number of certificates per capita in 2010 on characteristics of the tract as measured in 1997. No additional controls are included. Prewar housing share poor and share black come from census data.

Figure 3A. Certificates per 1,000 Population in 2010 and Changing Tract Characteristics 1990–2000 Notes: Each observation is a census tract. The linear fit and 95 percent confidence interval is generated from a simple regression of the number of certificates per capita in 2010 on the ratio of the tract characteristic in 1997 to 1990. No additional controls are included. All values on the x-axis come from census data. Figure 3B. Certificates per 1,000 Population in 2010 and Changing Tract Characteristics, 1997–2010 Notes: Each observation is a census tract. The linear fit and 95 percent confidence interval is generated from a simple regression of the number of certificates per capita in 2010 on the ratio of the tract characteristic 2010 to 1997. No additional controls are included. All values on the x-axis come from census data except housing values which come from Zillow.
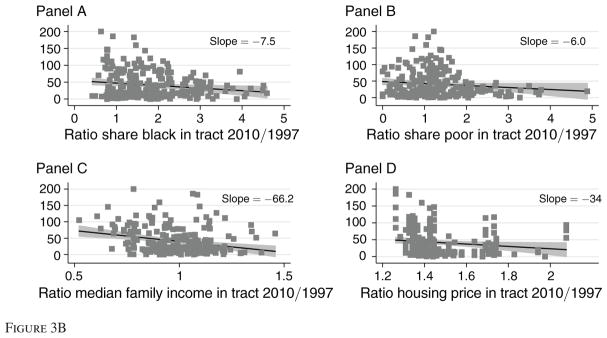
Figure 3A. Certificates per 1,000 Population in 2010 and Changing Tract Characteristics 1990–2000 Notes: Each observation is a census tract. The linear fit and 95 percent confidence interval is generated from a simple regression of the number of certificates per capita in 2010 on the ratio of the tract characteristic in 1997 to 1990. No additional controls are included. All values on the x-axis come from census data. Figure 3B. Certificates per 1,000 Population in 2010 and Changing Tract Characteristics, 1997–2010 Notes: Each observation is a census tract. The linear fit and 95 percent confidence interval is generated from a simple regression of the number of certificates per capita in 2010 on the ratio of the tract characteristic 2010 to 1997. No additional controls are included. All values on the x-axis come from census data except housing values which come from Zillow.

Certificates per 1,000 and the Ratio of Children Screened by Tract for Birth Cohorts 2005/1997 Notes: Each observation is a census tract. The x-axis represents the ratio of the number of children born in 2005 with a lead screen to the number of children born in 1997 with a lead screen.
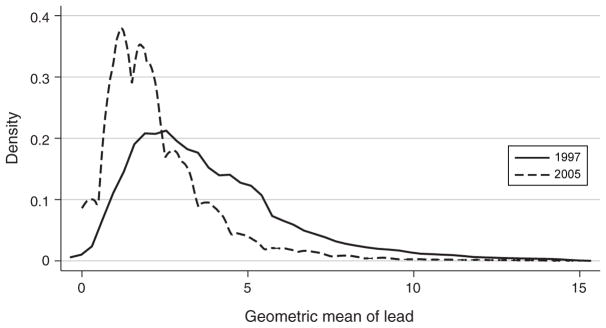
Distribution of Average Lead by Birth Cohort Note: Kernel = Epanechnikov, bandwidth = 0.3378.
References
-
- Ashenfelter Orley, Krueger Alan. Estimates of the Economic Return to Schooling from a New Sample of Twins. American Economic Review. 1994;84(5):1157–73.
-
- Bellinger David C, Stiles Karen M, Needleman Herbert L. Low-Level Lead Exposure, Intelligence and Academic Achievement: A Long-term Follow-up Study. Pediatrics. 1992;90(6):855–61. - PubMed
-
- Berney Barbara. Round and Round It Goes: The Epidemiology of Childhood Lead Poisoning, 1950–1990. Milbank Quarterly. 1993;71(1):3–39. - PubMed
-
- Billings Stephen B, Schnepel Kevin T. Life Unleaded: Effects of Early Interventions for Children Exposed to Lead. 2015 http://www.sole-jole.org/15416.pdf.
Grants and funding
LinkOut - more resources
Full Text Sources