. 2019 Mar 11;6(1):ENEURO.0337-18.2019.
doi: 10.1523/ENEURO.0337-18.2019. eCollection 2019 Jan-Feb.

Different Inhibitory Interneuron Cell Classes Make Distinct Contributions to Visual Contrast Perception

Affiliations

Different Inhibitory Interneuron Cell Classes Make Distinct Contributions to Visual Contrast Perception

Jackson J Cone et al. eNeuro. .

Abstract

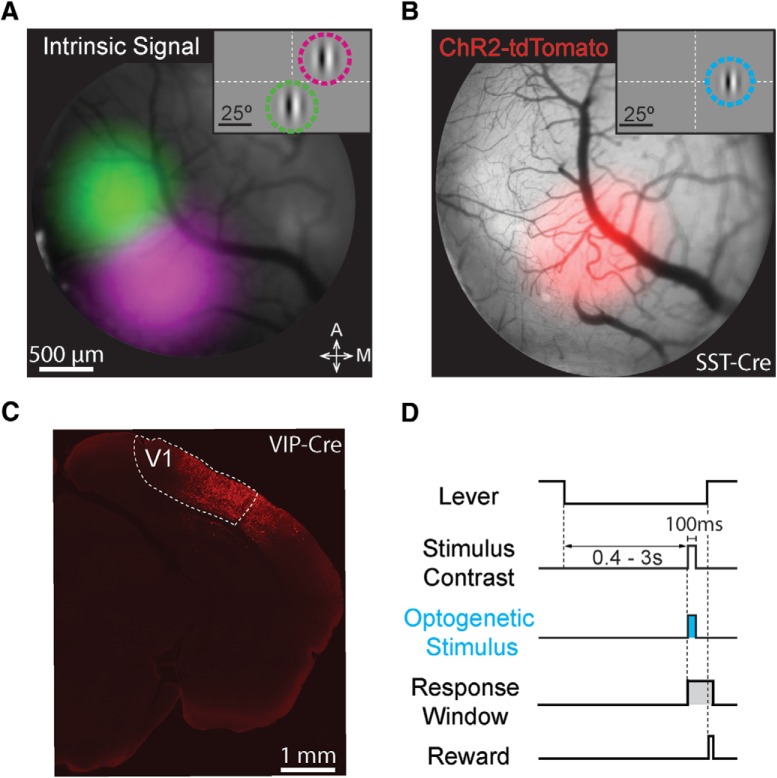
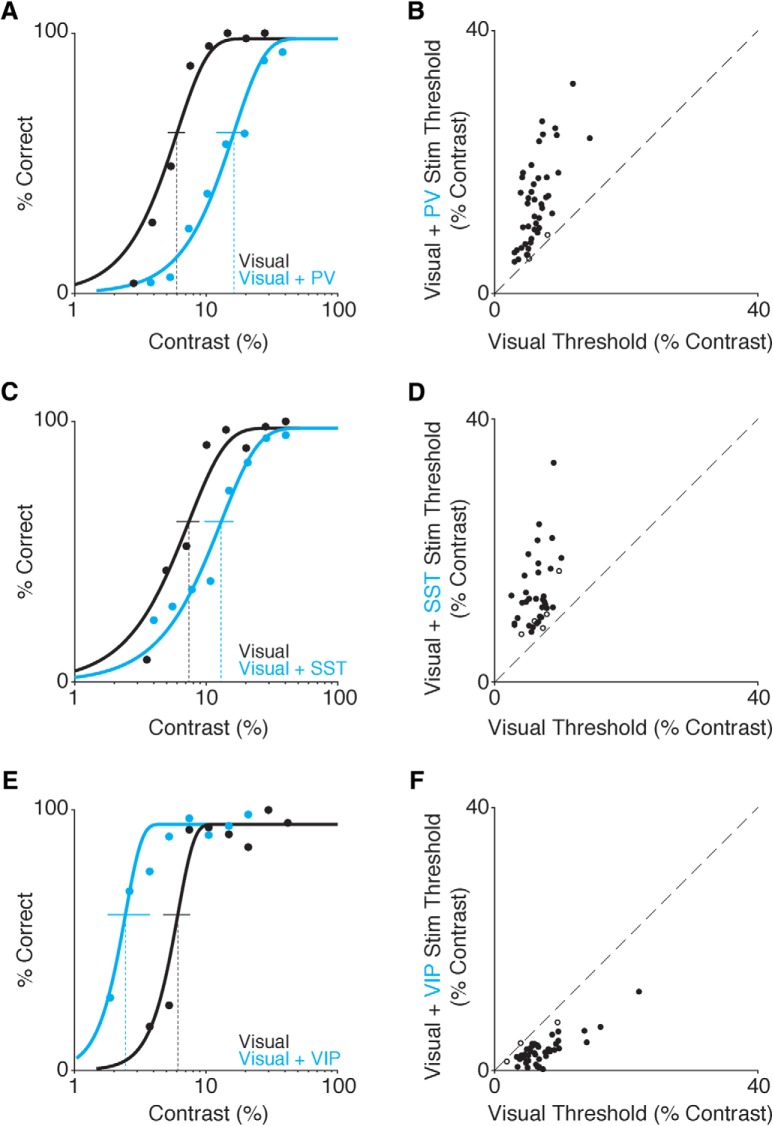
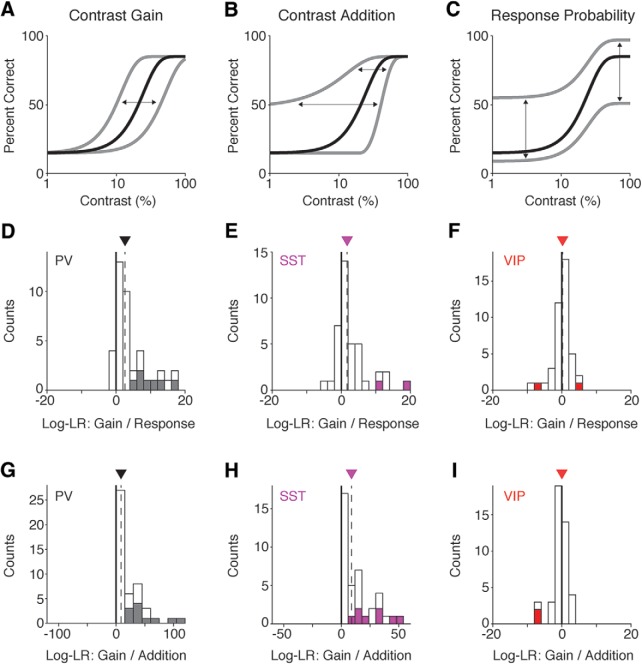
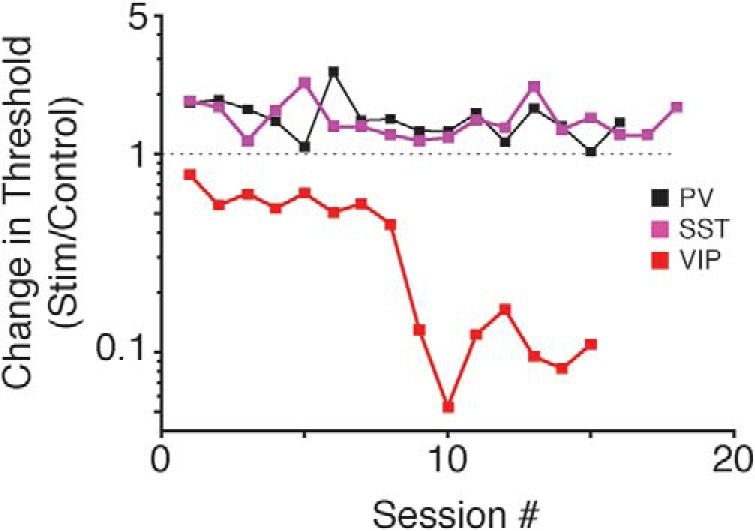
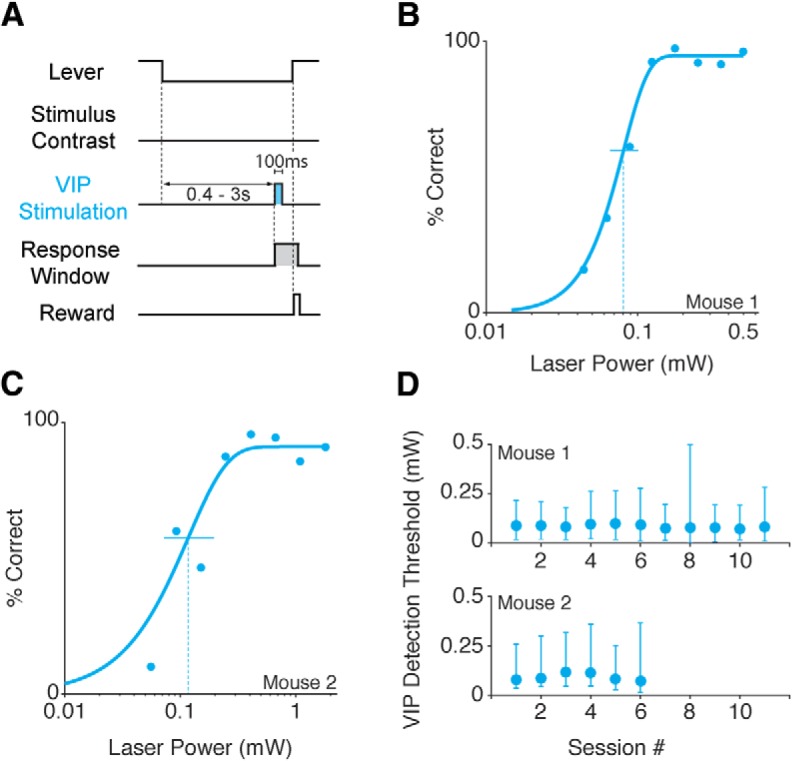
While recent work has revealed how different inhibitory interneurons influence responses of cortical neurons to sensory stimuli, little is known about their distinct contributions to sensory perception. Here, we optogenetically activated different genetically defined interneurons [parvalbumin (PV), somatostatin (SST), vasoactive intestinal peptide (VIP)] in visual cortex (V1) of mice working at threshold in a contrast increment detection task. The visual stimulus was paired with optogenetic stimulation to assess how enhancing V1 inhibitory neuron activity during visual processing altered task performance. PV or SST activation impaired, while VIP stimulation improved, contrast increment detection. The impairment produced by PV or SST activation persisted over several weeks of testing. In contrast, mice learned to reliably detect VIP activation in the absence of any natural visual stimulus. Thus, different inhibitory signals make distinct contributions to visual contrast perception.

Keywords: inhibition; interneurons; mouse; psychophysics; vision; visual contrast.


Figures

Figure 1.
Figure 1.
Targeting ChR2 to retinotopically defined areas of visual cortex. A, Pseudo-colored intrinsic autofluorescence responses to visual stimuli presented in two locations in a SST-Cre mouse. Magenta and green features represent 2D-Gaussian fits of responses to stimuli at visual field locations depicted in the inset (green: 0° azimuth, –20° elevation; magenta: 25° azimuth, +20° elevation; Gabor SD = 10°). Dashed lines represent horizontal and vertical meridians. A: anterior; M: medial. B, ChR2-tdTomato fluorescence (2D-Gaussian fit) from the same cortical region shown in A. The retinotopic location corresponding to maximal expression was used in all behavioral sessions (shown in inset; 25° azimuth, 0° elevation; Gabor SD = 6.75°). Conventions as in A. C, Representative confocal image of ChR2-tdTomato expression in the visual cortex (V1) of a VIP-Cre mouse. D, Trial schematic of the contrast increment detection task. Following the intertrial interval, a trial begins when the mouse depresses the lever. A visual stimulus could appear from 400–3000 ms following trial onset. The mouse had to release the lever within 700–900 ms after stimulus onset to receive reward. On a randomly selected half of the trials, ChR2-expressing interneurons were illuminated with blue light for 100 ms concurrent with the visual stimulus.
Figure 2.
Figure 2.
PV and SST stimulation impairs, while VIP stimulation improves, contrast increment detection. A, Representative PV mouse behavioral performance from a single contrast increment session. Data are false-alarm corrected performance for trials with (blue) and without (black) activation of PV interneurons as stimulus contrast is varied. Curves are best-fitting Weibull functions that were used to determine detection thresholds (dotted vertical lines) and 95% confidence intervals (solid horizontal lines). B, Summary of PV stimulation effects. Circles depict the contrast increment detection thresholds from individual sessions with (y-axis) and without (x-axis) PV neuron stimulation (five mice, 47 sessions). Filled circles indicate a significant shift in threshold (44/47; bootstrap). C, Representative behavioral performance from a single session in a SST mouse. Same format as A. D, Summary of SST stimulation effects (three mice, 39 sessions; significant threshold difference in 34/39 sessions). Same format as B. E, Representative single session behavioral performance from a VIP mouse. Conventions as in A and C. F, Summary of VIP stimulation effects (three mice 43 sessions; significant threshold difference in 40/43 sessions). Same format as B, D.
Figure 3.
Figure 3.
Optogenetic effects on detection performance are well described by changes in perception rather than response probability. A–C, Hypothetical examples of how optogenetic stimulation of interneurons could impact detection performance. Black line = performance on trials without stimulation. Gray line = impairment/enhancement in performance resulting from interneuron stimulation. Arrows indicate direction and magnitude of shifts in detection performance resulting from optogenetic stimulation. Lapse and false alarm rates have been exaggerated to highlight differences in model predictions. A, If stimulation impacts sensory evidence by causing a multiplicative change in contrast, the psychometric function should shift along the horizontal axis. B, If stimulation adds a fixed increment or decrement to the contrast of the stimulus, the psychometric function should shift primarily at low contrasts. C, If stimulation affects performance by changing the response probability, the psychometric function should shift above the lapse rate or below the false alarm rate. D, Distribution of log-likelihood ratios from individual sessions comparing the contrast gain model to the response probability model in PV mice. E, Same as in D but for SST mice. F, Same as in D but for VIP mice. G, Distribution of log-likelihood ratios from individual sessions comparing the contrast gain model to the contrast addition model in PV mice. H, Same as in G but for SST mice. I, Same as in G but for VIP mice. Thick black lines mark 0, where neither model had a higher likelihood. Downward pointing triangles and dashed lines denote the median of each distribution. Filled boxes are sessions for which the log-likelihood of one model is significantly better than the other model (p < 0.05, bootstrap). Log-LR = log-likelihood ratio. Note the differences in scale for G–I.
Figure 4.
Figure 4.
Stability of optogenetic effects on contrast detection performance. Data from three representative mice showing that extended training does little to mitigate the impairment induced by PV (black) or SST (magenta) stimulation, while VIP (red) performance improves further with training. Squares depict the ratio of thresholds from visual + optogenetic stimulus trials relative to visual only trials for each session. Values greater than one represent a performance impairment and values less than one represent performance improvement.
Figure 5.
Figure 5.
Mice can reliably report optogenetic stimulation of VIP neurons in the absence of a visual stimulus. A, Trial schematic of the optogenetic stimulation detection task. The visual display contained a blank gray screen throughout the session. At a random time 400–3000 ms after trial onset a 100-ms square pulse of blue light was delivered to ChR2-expressing VIP neurons, and the mouse was required to release the lever within the reaction time window to receive reward. B, Representative psychometric performance of optogenetic stimulation detection in a VIP mouse. Dots represent false-alarm corrected performance as the intensity of VIP stimulation varied across trials. The curve is the best-fitting Weibull function, which was used to determine detection threshold (dotted vertical line) and 95% confidence interval (solid horizontal line). C, Same as in B for a second VIP mouse. D, Thresholds are stable across sessions. Top, VIP detection thresholds (95% CI) for 11 sessions from the mouse shown in B. Bottom, VIP detection thresholds (95% CI) for six sessions from the mouse shown in C.

Similar articles

Cited by

References

    1. Adesnik H, Bruns W, Taniguchi H, Huang ZJ, Scanziani M (2012) A neural circuit for spatial summation in visual cortex. Nature 490:226–230. 10.1038/nature11526 - DOI - PMC - PubMed
    1. Aizenberg M, Mwilambwe-Tshilobo L, Briguglio JJ, Natan RG, Geffen MN (2015) Bidirectional regulation of innate and learned behaviors that rely on frequency discrimination by cortical inhibitory neurons. PLoS Biol 13:e1002308. 10.1371/journal.pbio.1002308 - DOI - PMC - PubMed
    1. Andermann ML, Kerlin AM, Roumis DK, Glickfeld LL, Reid RC (2011) Functional specialization of mouse higher visual cortical areas. Neuron 72:1025–1039. 10.1016/j.neuron.2011.11.013 - DOI - PMC - PubMed
    1. Atallah BV, Bruns W, Carandini M, Scanziani M (2012) Parvalbumin-expressing interneurons linearly transform cortical responses to visual stimuli. Neuron 73:159–170. 10.1016/j.neuron.2011.12.013 - DOI - PMC - PubMed
    1. Carandini M, Heeger DJ (2011) Normalization as a canonical neural computation. Nat Rev Neurosci 13:51–62. 10.1038/nrn3136 - DOI - PMC - PubMed

Publication types

LinkOut - more resources