

Hospitalisations with infections related to antimicrobial-resistant bacteria from the French nationwide hospital discharge database, 2016
- PMID: 30869047
- PMCID: PMC6518510
- DOI: 10.1017/S0950268819000402
Hospitalisations with infections related to antimicrobial-resistant bacteria from the French nationwide hospital discharge database, 2016
Abstract
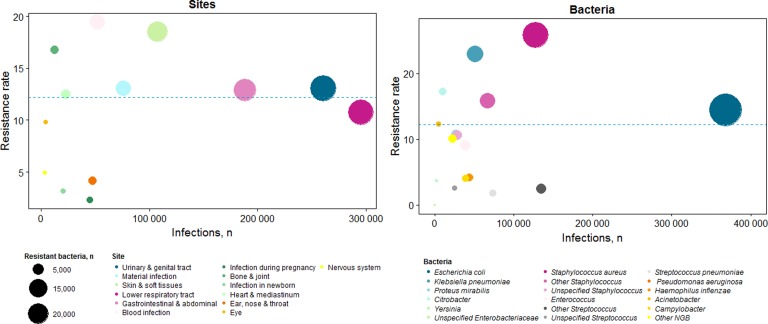
Massive use of antibiotics has led to increased bacterial resistance to these drugs, making infections more difficult to treat. Few studies have assessed the overall antimicrobial resistance (AMR) burden, and there is a paucity of comprehensive data to inform health policies. This study aims to assess the overall annual incident number of hospitalised patients with AMR infection in France, using the National Hospital Discharge database. All incident hospitalisations with acute infections in 2016 were extracted. Infections which could be linked with an infecting microorganism were first analysed. Then, an extrapolation of bacterial species and resistance status was performed, according to age class, gender and infection site to estimate the total number of AMR cases. Resistant bacteria caused 139 105 (95% CI 127 920-150 289) infections, resulting in a 12.3% (95% CI 11.3-13.2) resistance rate. ESBL-producing Enterobacteriaceae and methicillin-resistant Staphylococcus aureus were the most common resistant bacteria (>50%), causing respectively 49 692 (95% CI 47 223-52 142) and 19 493 (95% CI 15 237-23 747) infections. Although assumptions are needed to provide national estimates, information from PMSI is comprehensive, covering all acute bacterial infections and a wide variety of microorganisms.
Conflict of interest statement
None.
Figures

References
-
- Van Boeckel TP et al. (2014) Global antibiotic consumption 2000 to 2010: an analysis of national pharmaceutical sales data. The Lancet Infectious Diseases 14, 742–750. - PubMed
Publication types
MeSH terms
LinkOut - more resources
Full Text Sources
Medical
Miscellaneous
