. 2019 Mar 14:8:e42413.
doi: 10.7554/eLife.42413.

Quantitative regulation of the dynamic steady state of actin networks

Affiliations

Quantitative regulation of the dynamic steady state of actin networks

Angelika Manhart et al. Elife. .

Abstract

Principles of regulation of actin network dimensions are fundamentally important for cell functions, yet remain unclear. Using both in vitro and in silico approaches, we studied the effect of key parameters, such as actin density, ADF/Cofilin concentration and network width on the network length. In the presence of ADF/Cofilin, networks reached equilibrium and became treadmilling. At the trailing edge, the network disintegrated into large fragments. A mathematical model predicts the network length as a function of width, actin and ADF/Cofilin concentrations. Local depletion of ADF/Cofilin by binding to actin is significant, leading to wider networks growing longer. A single rate of breaking network nodes, proportional to ADF/Cofilin density and inversely proportional to the square of the actin density, can account for the disassembly dynamics. Selective disassembly of heterogeneous networks by ADF/Cofilin controls steering during motility. Our results establish general principles on how the dynamic steady state of actin network emerges from biochemical and structural feedbacks.

Keywords: ADF/Cofilin; actin; actin disassembly; actin network length; cell biology; none.


Conflict of interest statement

AM, TI, CG, TK, RB, MT, LB, AM No competing interests declared

Figures

Figure 1.
Figure 1.. Actin density determines network growth speed.
(A) The growth kinetics of reconstituted lamellipodia (LMs) depend on the density of the grafted NPFs (Human WASp-pVCA). Conditions: 6 µM actin monomers Alexa-568 labeled, 18 µM profilin, 120 nM Arp2/3 complex, 20 nM capping proteins. LMs of variable actin filament density (low, medium, high) were initiated by bar-shaped patterns of different NPF-spot densities (see Figure 1—figure supplement 1) and their growth was followed using the fluorescence of the actin networks. Snapshots of the growing lamellipodium were taken 0, 20 and 60 min after addition of Alexa-568-labeled actin monomers. (B) Denser patterns generate denser actin networks. The network density was measured across the LMs (for low density networks, n = 25 from three experiments, for medium-density networks, n = 41 from three experiments and for high-density networks, n = 38 from three experiments). (C) Denser patterns generate longer actin networks. The lengths of the LMs were measured after 60 min and plotted according to the pattern density.
Figure 1—figure supplement 1.
Figure 1—figure supplement 1.. Laser micropatterning method and growth rates.
(A) Laser patterning method to locally control the density of proteins on a surface. Adhesive patterns made of arrays of spots of different density generated by a 355 nm pulse Laser (left) were coated with 400 nM of NPFs (middle) before addition of a polymerization mix made of 6 µM actin monomers, 18 µM Profilin, 120 nM Arp2/3 complex and 20 nM capping proteins (see also Boujemaa-Paterski et al., 2017). (B) Geometry of the growing reconstituted actin networks. The growing network is shown in red, the bottom and top of the experimental chamber in grey. (C) Relationship between pattern and protein densities. The density of NPFs on the pattern measured by the fluorescence of the alexa488-labeled pWA increases with the density of the spots on the patterned surface (Boujemaa-Paterski et al., 2017). (D) Variation of the rate of single filament elongation k+ in dependence on the NPF (Human-WASp-pVCA) pattern density. The rate of elongation at the barbed end of single filament is not significantly affected by the Human-WASp-pVCA pattern density. See also Figure 1—video 1.
Figure 2.
Figure 2.. Actin network density and width set the equilibrium state of LMs.
(A) The growth kinetics of LMs in the presence of ADF/Cofilin. The experiment conditions are similar to Figure 1A but with addition of variable concentrations of ADF/Cofilin as indicated. Snapshots of the growing lamellipodium were taken 0, 20 and 60 min after addition of actin monomers. Actin monomers are Alexa-568 labeled (red), ADF/Cofilin is labeled with Alexa-488 (green). Scale bar is 15 µm. (B) The length of the actin networks as a function of the ADF/Cofilin concentrations were measured after 20 min. Colored bars (red for low, blue for medium and green for high actin density) at 20 min are averages (± standard deviations). Solid lines with corresponding colors are the model prediction according to Sec. Equilibrium length of actin network as a function of biochemical and geometric parameters. The horizontal lines for the model predictions indicate that the networks have not yet reached equilibrium (0 nM ADF/Cofilin, n = 33 for low, n = 41 for medium, n = 38 for high from three experiments; 125 nM ADF/Cofilin, n = 15 for low, medium and high from three experiments; 250 nM ADF/Cofilin, n = 26 for low, n = 27 for medium and n = 27 for high from three experiments; 400 nM ADF/Cofilin, n = 19 for low, medium and high from three experiments). (C) Growth of LMs from patterns of different sizes. Biochemical conditions are identical to Figure 2A and Figure 1A. Top panel, LMs in the absence of ADF/Cofilin were initiated from pattern of three different sizes (15 × 3, 30 × 3 and 90 × 3 µm2). Snapshots were taken at 36 min after addition of actin monomers (15 µm n = 50 from three experiments, 30 µm n = 59 from 11 experiments and 90 µm, n = 43 from 10 experiments). See Figure 2—video 1 for full dynamics. Bottom panel, LMs in presence of 200 nM ADF/Cofilin were initiated from pattern of three different sizes (15 × 3, 30 × 3 and 90 × 3 µm2). Snapshots were taken at 38 min after addition of actin monomers. Scale bar is 15 µm. See Figure 2—video 2 for the full dynamics. (D) Measured actin network lengths as a function of ADF/Cofilin concentration. Colored bars are the average length (±38 standard deviation) min after the addition of actin monomers. Lines show the model prediction of Sec. Equilibrium length of actin network as a function of biochemical and geometric parameters. Horizontal lines for the model predictions indicate that the networks have not yet reached equilibrium.
Figure 2—figure supplement 1.
Figure 2—figure supplement 1.. Growth of networks of varying widths.
Shown is the network length as a function of time for networks from Figure 2C–D of 15, 30 and 90 µm width in the absence of ADF/Cofilin (solid lines) and in the presence of 200 nM ADF/Cofilin (dashed lines).
Figure 3.
Figure 3.. ADF/Cofilin dynamics.
(A) Measurement procedure. Left: Example kymograph of the bound ADF/Cofilin density as a function of space and time. Colored lines show three example paths in time and space along which the amount of bound ADF/Cofilin was measured. Inset: Schematic of the growing network at different time points, Right: The measurements of the bound ADF/Cofilin density along the paths shown on the left. Dotted lines show initial increase. (B) Normalized (to have mean one) values of the initial increase as a function of starting time for all networks. Colors represent different starting times, compare red, green and blue paths in the example network in Figure 3A. Inset: Predictions for local depletion and no local depletion of free ADF/Cofilin. (C) Simulation of (1 - 2). Snapshot at time t = 40 min showing the concentration of free ADF/Cofilin. Parameters: V = 1.16 µm/min, rB=0.5/min/µM, rU=0.31/min, A = 50 µM, C0=125nM. Inset left: Concentration of free ADF/Cofilin along the dotted line. Inset right: Zoom around the network. Colors represent concentration of free ADF/Cofilin. (D) Time snapshots of the same simulation showing the concentration of free ADF/Cofilin, colors as in Figure 3C. Below: Average amount of free ADF/Cofilin in the area covered by the network (black rectangle in Figure 3D).
Figure 3—figure supplement 1.
Figure 3—figure supplement 1.. Comparing simulated and measured amounts of bound ADF/Cofilin.
(A) Using the measured actin density data (left column) at 20 min as input into the model (i.e. A=A(y) in the model), we compare the measured (middle column) and simulated (right column) ADF/Cofilin density along the network (the x-axis represents the distance to the leading edge). Shown are examples of networks of varying width (top row: 15 µ30 µm, bottom row: 90 µm) with varying amounts of initial ADF/Cofilin (dotted lines: 200–250 nM, solid lines: 400–500 nM); colors help distinguish between different networks. Concentrations of actin and ADF/Cofilin were averaged across the network width. (B) Concentration of bound ADF/Cofilin averaged along the network width for an example network, measured (top) and simulated (bottom). Line color and line thickness represent different time points. Simulation details can be found in Appendix 1.
Figure 4.
Figure 4.. Network fragmentation.
(A) Snapshots of experimental measurements of actin density (red) at three consecutive time points. The yellow arrow shows a hole in the network, the dotted outline and blue arrow the breakage of a large piece of network. The network width is 90 µm, the ADF/Cofilin concentration 200 nM, the bar is 10 µm. See Figure 4—video 1, right for the full time dynamics. (B) Simulation snapshots for three consecutive time steps. Colors and arrows as in Figure 4A, dotted lines show the shifted outline of the network in the previous time step. The same network width and speed and initial actin concentration as those measured for the network shown in Figure 4A, were used as model parameters in the simulation. See Figure 4—video 1, left for the full time dynamics. (C) Shown is the simulation setup. Effective nodes (branching and crosslinking points) are the vertices of the square lattice, while actin filaments are the edges of the square lattice. At every time step, the network is shifted in the growth direction. At each node, the breakage rate is a function of the local actin and global bound cofilin densities. The three circles show three different breakage events and their effects. (D) Comparison between the simulated equilibrium length and the analytical prediction using Equation (4) for different values of the initial actin density and exponent α. Inset: The fluctuating network lengths as functions of time for various values of initial actin density for α=2. (E) Comparison between the actin density in the stochastic fragmentation simulation (thin lines) and the analytical approximation (thick black line). (F) Fit of the predicted quadratic dependence of the network equilibrium length on the actin density to the measurements of the equilibrium network length (L) normalized by the network speed (V) and the average concentration of bound cofilin (CB). B, D, E: For details and parameters see Appendix 1.
Figure 5.
Figure 5.. Model explanation.
(A) Explanation of the two effects determining equilibrium network length: Feedback 1 (Equation (5), blue equation and curve) shows the effect of the disassembly. Feedback 2 (Equation (6), red equation and curve) shows the effect of ADF/Cofilin binding dynamics. Right: The intersection of the two curves in the (L,CB) plane determines the equilibrium network length marked by L*. (B-D) Effect of varying the ADF/Cofilin concentration, the network width and the network density on the equilibrium network length.
Figure 6.
Figure 6.. ADF/Cofilin controls the steering of heterogeneous actin network.
(A-C) Modeling steering without ADF/Cofilin. (A) Model predictions of how differences in density influence the curvature and length of the heterogeneous LM. Darker colors signify denser networks, in all cases the left LM grows half as fast as the right LM. (B,C) Dependence of the curvature radius and speed of the heterogeneous LM on the elasticity ratio σ. The dashed line shows reference values, a-e mark the examples shown in Figure 6A. (D-F) Influence of ADF/Cofilin on the heterogeneous LM for concentrations 0, 250 nM and 500 nM. D. A pattern was generated with an array of spots of two distinct densities (left: low density, right: high density) both coated with the same concentration of NPFs. The heterogeneous pattern induces the growth of a heterogeneous actin network that steers toward the actin network with the lower density (left panel). Addition of 200 nM ADF/Cofilin selectively disassembles the low-density networks (middle panel). Addition of 500 nM ADF/Cofilin fully disassembles the low-density actin network and disassembles partially the high-density network (right panel). Snapshots were taken at 30 min after the addition of the actin monomers. (E) Simulated network shapes and network densities, darker colors signify denser networks. (F) Measured curvature radius, experimental (small blue circles) and simulated (large black circles). For the simulations we calculated an average curvature radius. (G) ADF/Cofilin induces steering within heterogeneous actin networks. We generated complex patterns made of heterogeneous spots density (medium and high spot densities) that are connected (right) or not (left) by a low-density pattern. Addition of 200 nM ADF/Cofilin selectively disassembles the low-density actin network induces the steering of the medium/high heterogeneous actin networks. See Figure 6—video 1 for full time dynamics. (A-C), E: Details in Appendix 1.
Figure 7.
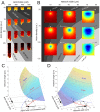
Figure 7.. Phase diagram.
(A) Depicted are the predicted equilibrium networks lengths, if ADF/Cofilin concentration and actin density are varied. Gray colors represent regions of similar equilibrium network length. Shadings of red show actin density (black = high, yellow = low). The network shapes were calculated using the fragmentation model. (B) Depicted are the predicted equilibrium networks lengths, if network width and actin density are varied. Gray colors in the background represent regions of similar equilibrium network length. Colored insets show the simulated amount of free ADF/Cofilin (blue = low, red = high). (C-D) Depiction of how different combinations of control variables can lead to the same network length. See text for details.
Appendix 1—figure 1.
Appendix 1—figure 1.. Scaling of ADF/Cofilin binding rate.
(A) Correlation of CB˙ and C0 using only networks with an actin density between 120 and 180 (a.u.). (B) Correlation of CB˙ and A using only networks with an initial ADF/Cofilin concentration between 200 and 250 nM. (C) Correlation of CB˙ and C0A using networks of varying initial ADF/Cofilin concentration and actin density.
Appendix 1—figure 2.
Appendix 1—figure 2.. Modeling of heterogeneous, elastic networks.
(A) Schematic of the experimental set-up. Different shading is used for the two sub-networks. The curve Γ represents their interface. (B) Spring-based model of one network segment.
Appendix 1—figure 3.
Appendix 1—figure 3.. Density-elasticity scaling.
(A) Variation of the actin density in heterogeneous patterns in Figure 6D, control. (B) Actin density ratio in heterogeneous patterns generated by the low and high density patterns in Figure 6D, control. (C) Showing the calculated ratio of sub-network speeds V2/V1 as function of the scaling exponent τ. The relation is obtained from Equation (7) using an actin density ratio of 0.78 as measured in B as well as a curvature radius of 75 µm as measured in Figure 6F.

Similar articles

Cited by

References

    1. Achard V, Martiel JL, Michelot A, Guérin C, Reymann AC, Blanchoin L, Boujemaa-Paterski R. A "primer"-based mechanism underlies branched actin filament network formation and motility. Current Biology. 2010;20:423–428. doi: 10.1016/j.cub.2009.12.056. - DOI - PubMed
    1. Aizawa H, Sutoh K, Yahara I. Overexpression of cofilin stimulates bundling of actin filaments, membrane ruffling, and cell movement in dictyostelium. The Journal of Cell Biology. 1996;132:335–344. doi: 10.1083/jcb.132.3.335. - DOI - PMC - PubMed
    1. Akin O, Mullins RD. Capping protein increases the rate of actin-based motility by promoting filament nucleation by the Arp2/3 complex. Cell. 2008;133:841–851. doi: 10.1016/j.cell.2008.04.011. - DOI - PMC - PubMed
    1. Almo SC, Pollard TD, Way M, Lattman EE. Purification, characterization and crystallization of acanthamoeba profilin expressed in Escherichia coli. Journal of Molecular Biology. 1994;236:950–952. doi: 10.1006/jmbi.1994.1200. - DOI - PubMed
    1. Amberg D, Leadsham JE, Kotiadis V, Gourlay CW. Cellular ageing and the actin cytoskeleton. Aging Research in Yeast. 2011:331–352. doi: 10.1007/978-94-007-2561-4_15. - DOI - PubMed

Publication types