. 2019 Jun;286(12):2295-2310.
doi: 10.1111/febs.14812. Epub 2019 Mar 26.

Differential regulation of myc homologs by Wnt/β-Catenin signaling in the early metazoan Hydra

Affiliations

Differential regulation of myc homologs by Wnt/β-Catenin signaling in the early metazoan Hydra

Markus Hartl et al. FEBS J. 2019 Jun.

Abstract

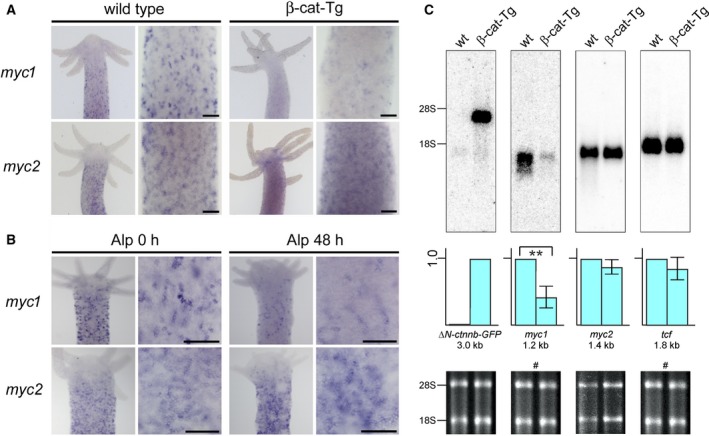
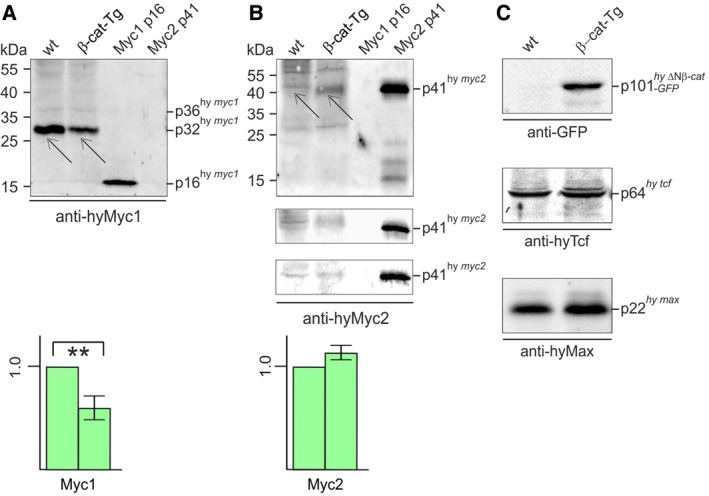
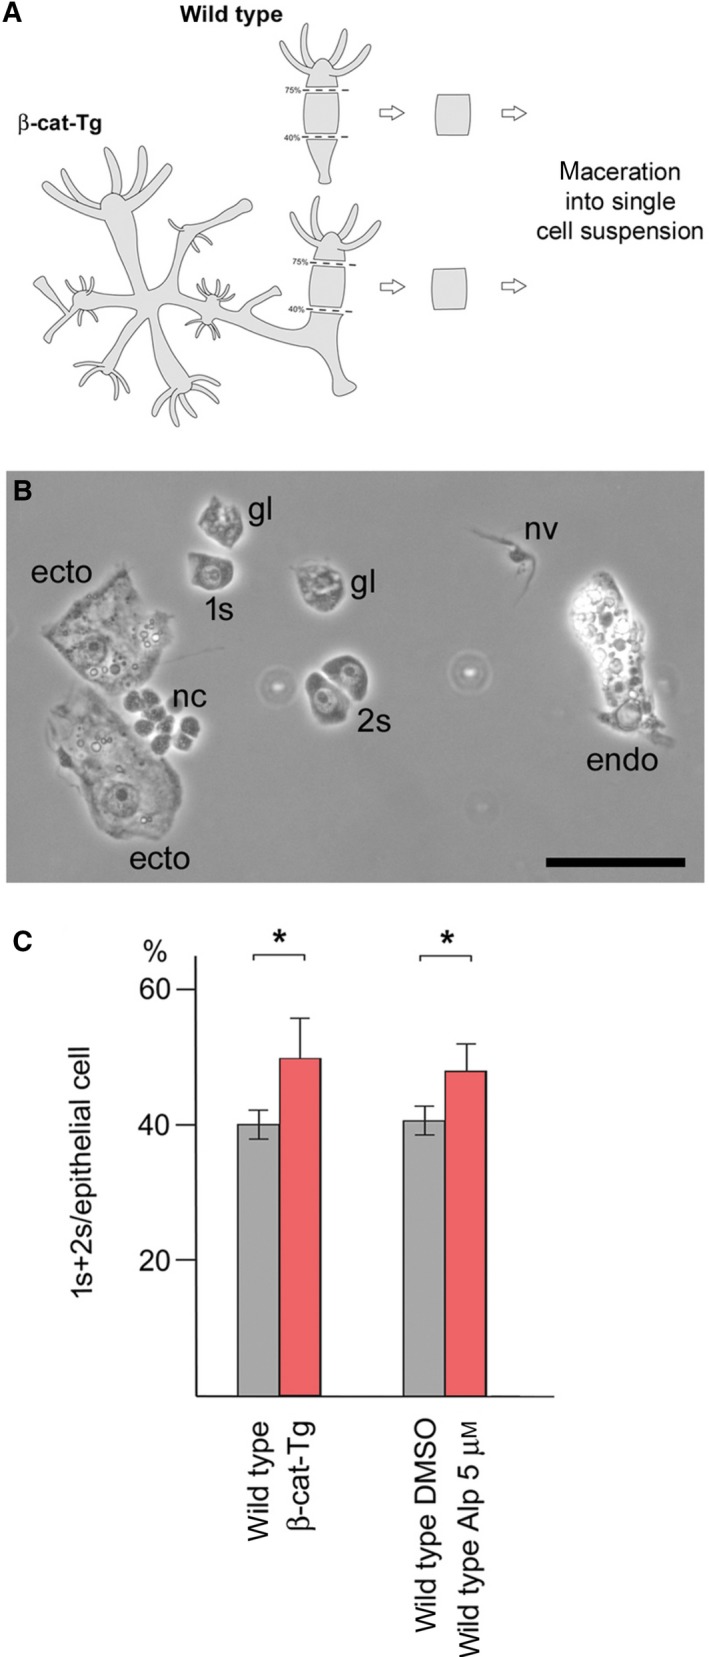
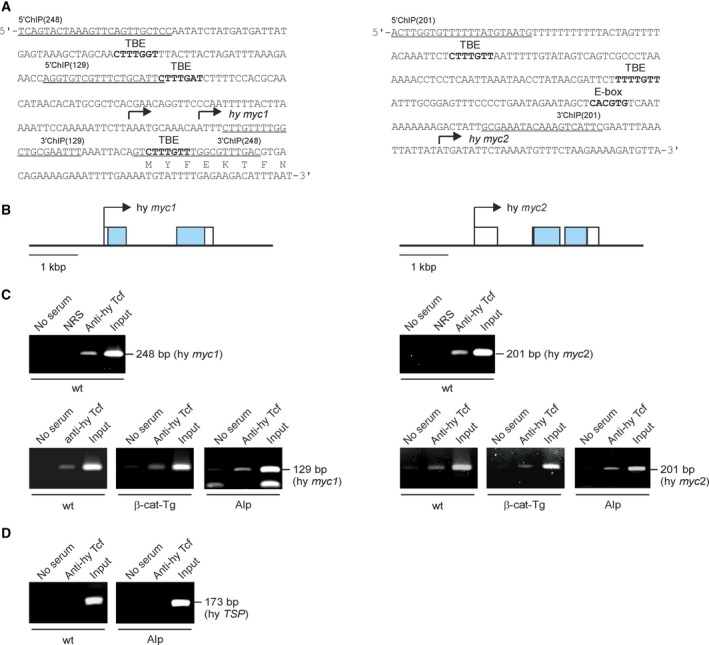
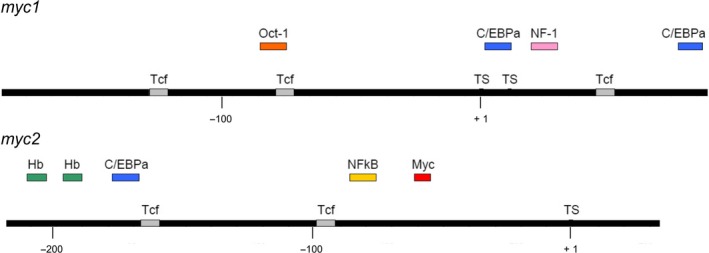
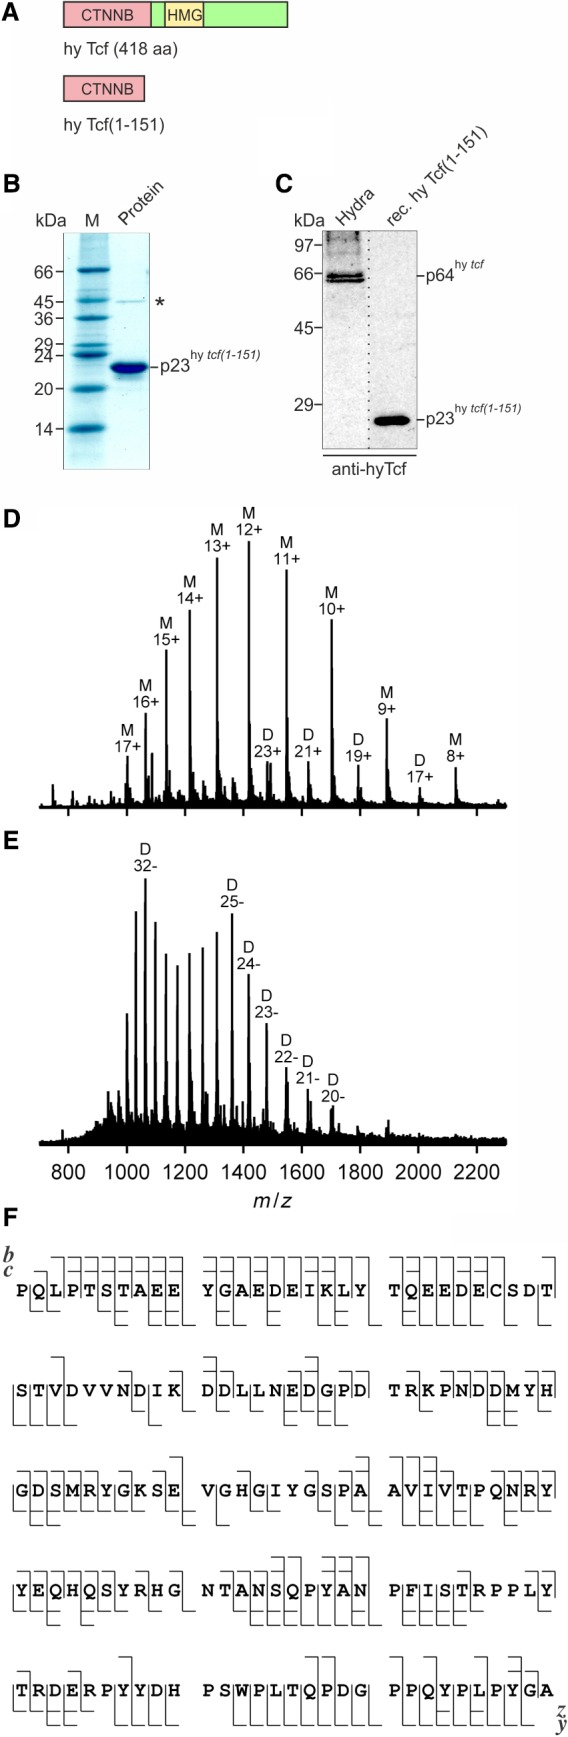
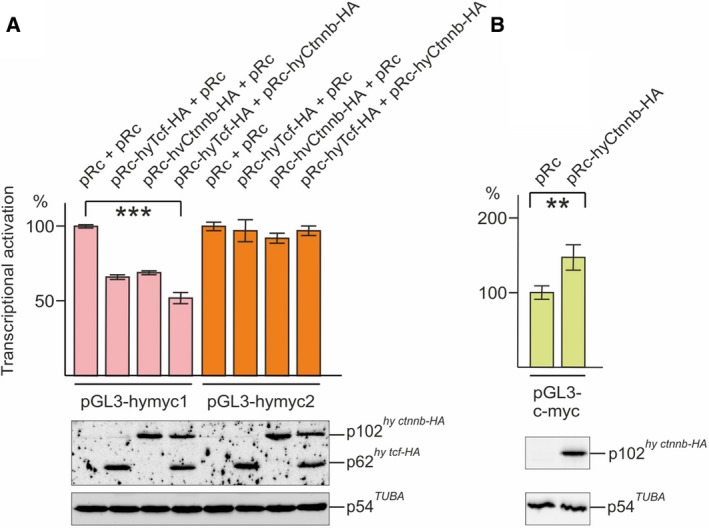
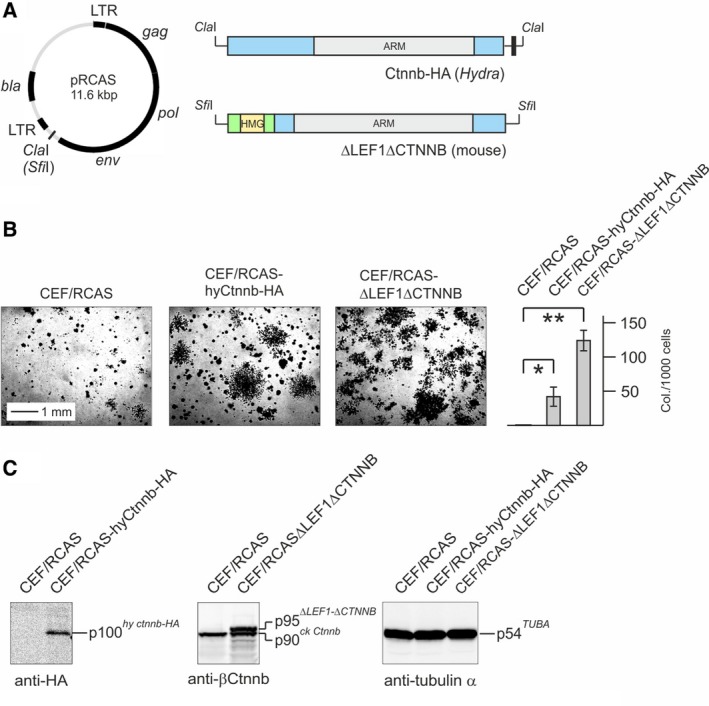
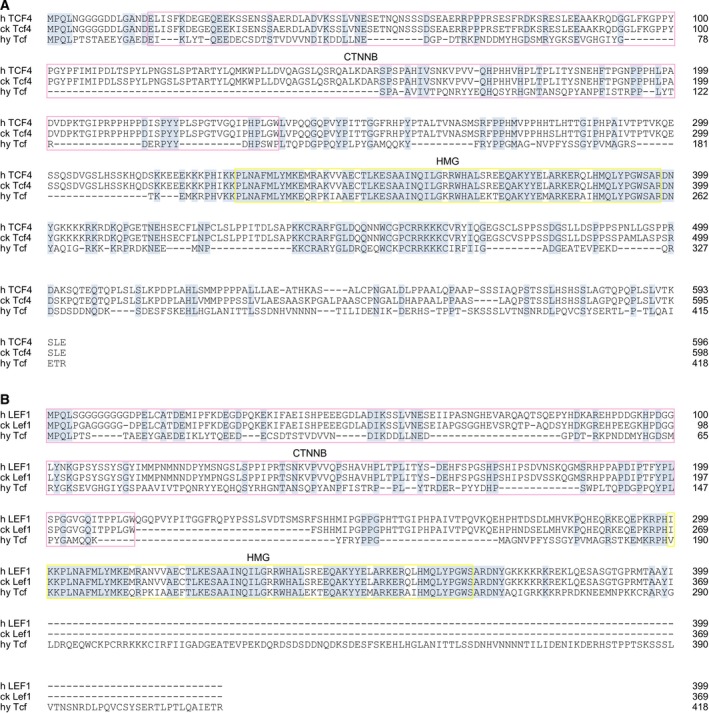
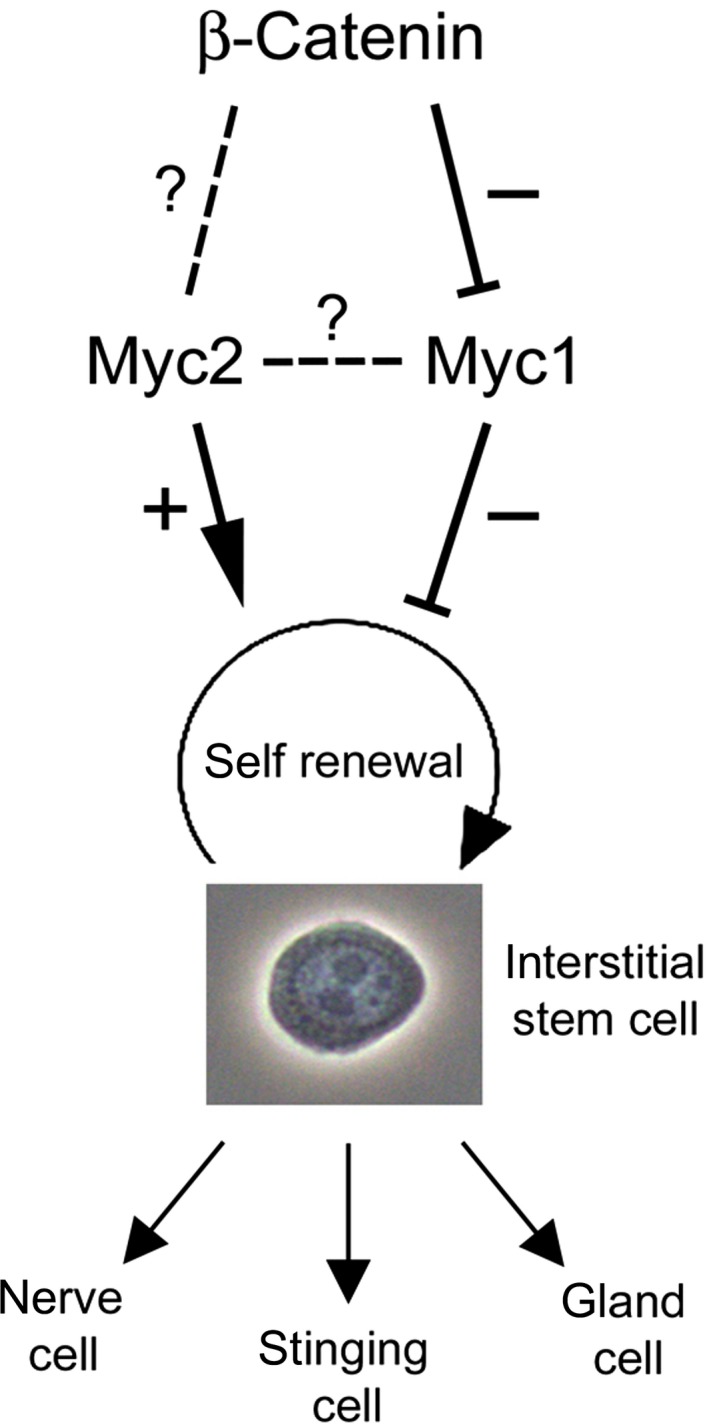
The c-Myc protein is a transcription factor with oncogenic potential controlling fundamental cellular processes. Homologs of the human c-myc protooncogene have been identified in the early diploblastic cnidarian Hydra (myc1, myc2). The ancestral Myc1 and Myc2 proteins display the principal design and biochemical properties of their vertebrate derivatives, suggesting that important Myc functions arose very early in metazoan evolution. c-Myc is part of a transcription factor network regulated by several upstream pathways implicated in oncogenesis and development. One of these signaling cascades is the Wnt/β-Catenin pathway driving cell differentiation and developmental patterning, but also tumorigenic processes including aberrant transcriptional activation of c-myc in several human cancers. Here, we show that genetic or pharmacological stimulation of Wnt/β-Catenin signaling in Hydra is accompanied by specific downregulation of myc1 at mRNA and protein levels. The myc1 and myc2 promoter regions contain consensus binding sites for the transcription factor Tcf, and Hydra Tcf binds to the regulatory regions of both promoters. The myc1 promoter is also specifically repressed in the presence of ectopic Hydra β-Catenin/Tcf in avian cell culture. We propose that Hydra myc1 is a negative Wnt signaling target, in contrast to vertebrate c-myc, which is one of the best studied genes activated by this pathway. On the contrary, myc2 is not suppressed by ectopic β-Catenin in Hydra and presumably represents the structural and functional c-myc ortholog. Our data implicate that the connection between β-Catenin-mediated signaling and myc1 and myc2 gene regulation is an ancestral metazoan feature. Its impact on decision making in Hydra interstitial stem cells is discussed.

Keywords: cnidarian; development; gene regulation; oncogene; signal transduction.


Conflict of interest statement

The authors declare no conflict of interest.

Figures

Figure 1
Figure 1
Specific repression of myc1 mRNA expression upon β‐Catenin activation. (A) Expression patterns of Hydra myc1 and myc2 in β‐Catenin transgenic animals (β‐cat‐Tg) compared to wild‐type polyps. Whole wild‐type and transgenic polyps have myc1 and myc2 expressed throughout their body columns, but not in head and foot structures. myc1 is downregulated in the transgenic polyps, whereas myc2 levels are not significantly changed. (B) Differential expression of Hydra myc1 and myc2 48 h after onset of treatment with the GSK‐3β inhibitor Alp. Inhibition of GSK‐3β results in activation of β‐Catenin in the canonical Wnt signaling pathway, and as a result in a reduction of the myc1 expression level. Upper halves of polyps and magnified views from gastric regions are shown. Bars in the magnified views represent 25 μm. (C) Northern analysis using aliquots (2.0 μg) of poly(A)+‐selected RNAs from whole wild‐type (wt) and transgenic Hydra animals, and Hydra myc1, myc2, or tcf‐specific cDNA probes derived from the relevant coding regions. Positions of residual ribosomal RNAs (28S, 18S) are given on the left site. Ethidium bromide‐stained RNAs used for blot analysis are shown below. The blot, which was hybridized to a second probe after filter washing is indicated by a hash sign (#). For transgenic mRNA detection, a GFP‐specific probe (ΔN‐ctnnb‐GFP) was applied (arbitrary expression level 1.0). Representative blots from three independent experiments are shown where myc1, myc2, and tcf levels from wild‐type animals were arbitrarily set to 1.0. Standard deviations (SD, n = 3) are shown by vertical bars. Statistical significance was assessed by using a paired Student t‐test (**P < 0.01).
Figure 2
Figure 2
Specific repression of Myc1 protein expression upon β‐Catenin activation. (A, B) Expression of Hydra Myc1 (A) and Myc2 (B) proteins in β‐catenin transgenic animals (β‐cat‐Tg) compared to wild‐type (wt) polyps. (C) Expression control of the transgenic fusion protein ΔN‐Ctnnb‐GFP, and of Hydra Tcf or Hydra Max in β‐cat‐Tg compared to wt polyps. Protein expression was tested by immunoblot analysis using each 10 μg of cell extract. Proteins were resolved by SDS/PAGE (10%, wt/vol) and detected using antibodies directed against recombinant Myc1, Myc2, Max, or Tcf proteins, or against the green fluorescent protein (GFP). As specificity control, each 10 ng of recombinant Myc1 p16 or full‐length Myc2 (p41) were used in panels A and B. Representative blots from three independent experiments are shown, where Myc1 and Myc2 levels from wild‐type animals were arbitrarily set to 1.0. Thin arrows depict the endogenous Hydra Myc1 or Myc2 protein bands. Standard deviations (SD, n = 3) are shown by vertical bars. Statistical significance was assessed by using a paired Student t‐test (**P < 0.01). In case of Myc2, which is hardly detectable by immunoblotting, all three blots used for quantification are shown (P = 0.08).
Figure 3
Figure 3
Interstitial stem cell densities in the body columns of β‐Catenin‐activated and wild‐type polyps. (A) Scheme of the position of macerated tissue pieces. Tissue samples representing roughly half of the tissue mass of a budless control polyp were excised from the mid body column. Equivalent tissue pieces were excised from the body columns of β‐cat‐Tg transgenes and polyps treated with Alp for 60 h. The tissue pieces were macerated, spread as single‐cell suspensions onto microscope slides, and analyzed using a phase contrast microscope. (B) Representative phase contrast image of macerated cells from a β‐cat‐Tg polyp. 1s: single interstitial stem cell; 2s: interstitial stem cell pair; ecto: ectodermal epithelial cell; endo: endodermal epithelial cell; nv: nerve cell; nc: nest of differentiating nematocytes; gl: gland cell. Bar: 25 μm. (C) Quantification of macerated tissue pieces reveals higher interstitial stem cell (1s+2s) densities in β‐Catenin‐activated tissues as compared with wild‐type controls. 1s+2s density is defined as the numbers of 1s+2s per epithelial cells. Bars represent the mean ± SD of three independent experiments. Statistical significance was assessed by using a paired Student t‐test (*P < 0.1).
Figure 4
Figure 4
Structures of the Hydra myc1 and myc2 promoter regions and binding of Hydra Tcf. (A) Nucleotide sequences of the myc1 and myc2 regulatory regions. The transcription start sites mapped by 5′RACE (arrows), potential binding sites (in bold) for the transcription factors Tcf (TBE) or Myc (E‐box), and binding sites for 5′ and 3′ ChIP primers (underlined) are indicated. (B) Topographies of Hydra magnipapillata genomic loci (accession nos. NW_004167287, NW_004167363) containing the Hydra myc1 and myc2 genes. Exons are depicted by boxes with the coding regions shown in black. Arrows indicate the main transcription start sites. (C) ChIP of the Hydra myc1 and myc2 promoter regions using chromatin from whole Hydra wild type (wt) animals, from β‐catenin transgenic animals (β‐cat‐Tg), and from Alsterpaullone‐treated (Alp) Hydra. An antiserum directed against Hydra Tcf was used for precipitation, followed by PCR amplification of the indicated fragments from the myc1 or myc2 regulatory regions. Reactions with normal rabbit serum (NRS) or total chromatin (Input) were used as controls. (D) A fragment containing no Tcf binding site derived from the Hydra TSP regulatory region 36 was amplified as a control.
Figure 5
Figure 5
Promoter maps of Hydra myc1 and myc2. Bars represent the promoter regions. Positions of transcription factor binding sites were identified using the computer program AliBaba2 (gene‐regulation.com) and are depicted on or above the bars (Tcf, T‐cell‐specific transcription factor; C/EBPalpha, CCAAT enhancer‐binding protein alpha; NF‐1, nuclear factor 1; Hb, hunchback; NFkappaB, nuclear factor kappa B; Myc, myelocytomatosis viral oncogene protein product).
Figure 6
Figure 6
Analysis of the Hydra Tcf recombinant protein. (A) Schematic depiction of the Hydra (hy) Tcf protein product (GenBank accession no. XP_002159974). The positions of the high mobility group (HMG) representing the DNA binding domain, and the β‐Catenin binding site (CTNNB) are indicated. The amino‐terminal segment of Hydra Tcf [hy Tcf(1‐151)] was expressed in Escherichia coli and purified. (B) SDS/PAGE (12.5%, wt/vol) of 5 μg (Coomassie brilliant blue staining) purified recombinant Hydra Tcf(1‐151) p23. The upper faint band marked with an asterisk represents a cross‐linked dimer generated from p23hy tcf(1‐151) (see below). (C) Immunoblot analysis using 10 μg of cell extract from Hydra, and 5 ng of recombinant hy Tcf(1‐151). Proteins were resolved by SDS/PAGE (10%, wt/vol) and detected using an antiserum directed against recombinant hy Tcf(1‐151). The dotted line marks the splicing site in the blot image, from which one lane has been removed. (D–F) MS of recombinant hy Tcf(1‐151). The ESIMS of hy Tcf(1‐151) with a 7 Tesla Fourier transform ion cyclotron resonance (FTICR) instrument (Bruker, Vienna, Austria) gives a mass value for the most abundant isotopic peak of 17 014.868 ± 0.006 Da (theoretical mass without initiating methionine: 17 014.874 Da; error 0.4 p.p.m.) using polyethylene glycol 1000 as calibrant. (D) ESI mass spectrum of hy Tcf‐NT in positive ion mode showing mostly (~ 95%) monomeric protein (M) but also protein dimers whose mass values (measured mass for the most abundant isotopic peak 34 027.727 Da) indicate covalent dimerization by formation of an intermolecular disulfide bond (theoretical mass for the most abundant isotopic peak 34 027.732 Da). (E) ESI of hy Tcf‐NT in negative ion mode gives predominantly (> 80%) dimer ions from intermolecular disulfide bond formation. (F) Fragment ion maps for the Hydra Tcf(1‐151) p23 protein showing 85% sequence coverage.
Figure 7
Figure 7
Transcriptional regulation of the Hydra myc1 and myc2 promoters. (A) Aliquots (0.5 μg) of the pGL3‐hymyc1 or pGL3‐hymyc2 reporter constructs were co‐transfected in triplicate with aliquots (0.5 μg) of pRc‐derived expression vectors encoding the Hydra Tcf‐HA, Ctnnb‐HA, or the empty expression vector (pRc) into the chemically transformed quail cell line QT6. (B) Aliquots (1.0 μg) of the pGL3‐c‐myc reporter construct were co‐transfected in triplicate with aliquots (1.0 μg) of pRc‐hyCtnnb‐HA, or the empty pRc vector into QT6 cells. Luciferase activities and protein concentrations were determined from cell extracts prepared 24 h after transfection. Relative luciferase activities and standard errors of the mean (SEM, n = 3) are visualized by bars and vertical lines, respectively. Statistical significance was assessed by using a paired Student t‐test (**P < 0.01, ***P < 0.001). For control of protein expression (lower panels), equal amounts of cell extracts (20 μL) were analyzed by SDS/PAGE (10% wt/vol). The ectopic HA‐tagged Hydra Tcf and Ctnnb proteins, and endogenous tubulin α were detected by immunoblotting.
Figure 8
Figure 8
Oncogenic transforming activity of Hydra β‐Catenin. (A) Structures of the applied RCAS constructs (HA, hemagglutinin tag). (B) Agar colony formation of CEF transfected with the empty retroviral RCAS vector, or with RCAS constructs depicted under A. Each 1 × 104 cells were seeded in soft nutrient agar onto MP12 dishes and colonies were scored after 3 weeks. Untransformed control CEF infected with the empty RCAS vector produced very small background colonies, which has been also observed previously 37, 38. Colonies were counted from triplicate dishes. A representative experiment from two independent assays (n = 2) is shown. Vertical bars show standard deviations (SD). Statistical significance was assessed by using a paired Student t‐test (*P < 0.05, **P < 0.01). (C) Immunoblot analysis of ectopically expressed proteins using the indicated antibodies. The antibody directed against the mouse β‐Catenin portion present in the ΔLEFCTNNB fusion protein also detects the endogenous chicken (ck) Ctnnb (p90).
Figure 9
Figure 9
Amino acid sequence alignments of Hydra magnipillata (hy) Tcf with the Homo sapiens (h) and Gallus gallus (ck) homologs. (A) Alignment with human TCF4 (TCF7L2) and chicken Tcf4 (Tcf7l2). (B) Alignment with human LEF‐1 and chicken Lef1. GenBank accession numbers are: hy Tcf, NP_001296662; h TCF‐4, CAG38811; ck Tcf‐4, NP_001193439; h LEF‐1, Q9UJU2; ck Lef‐1, NP990344. Identical residues are shaded in blue, and gaps are indicated by dashes. The β‐Catenin (CTNNB) and DNA binding (HMG) domains are boxed in pink or yellow, respectively. Sequence identities between hy Tcf and h LEF1 or ck Lef1 are 29%, and between hy Tcf and h TCF4 or ck Tcf4 42%. The alignment was generated by using the computer program (omega) clustalw with additional manual adjustments.
Figure 10
Figure 10
Hydra β‐Catenin/Myc interaction model. Interstitial stem cells permanently undergo self‐renewal and differentiation into three somatic products: nerve cells, stinging cells (nematocytes), and gland cells. We propose that Myc2 acts as maintenance factor in interstitial stem cell self‐renewal and that this is complemented by a double‐negative action of β‐Catenin and Myc1. The detailed actions of β‐Catenin on Myc2 and the cross‐talk between Myc1 and Myc2 are not yet known.

Similar articles

Cited by

References

    1. Bister K & Jansen HW (1986) Oncogenes in retroviruses and cells: biochemistry and molecular genetics. Adv Cancer Res 47, 99–188. - PubMed
    1. Stefan E & Bister K (2017) MYC and RAF: key effectors in cellular signaling and major drivers in human cancer. Curr Top Microbiol Immunol 407, 117–151. - PMC - PubMed
    1. Eisenman RN (2001) Deconstructing myc. Genes Dev 15, 2023–2030. - PubMed
    1. Adhikary S & Eilers M (2005) Transcriptional regulation and transformation by Myc proteins. Nat Rev Mol Cell Biol 6, 635–645. - PubMed
    1. Conacci‐Sorrell M, McFerrin L & Eisenman RN (2014) An overview of MYC and its interactome. Cold Spring Harb Perspect Med 4, a014357. - PMC - PubMed

Publication types

MeSH terms