. 2019 Apr;18(8):795-808.
doi: 10.1080/15384101.2019.1591125. Epub 2019 Apr 4.

A checkpoint-oriented cell cycle simulation model

Affiliations

A checkpoint-oriented cell cycle simulation model

David Bernard et al. Cell Cycle. 2019 Apr.

Abstract

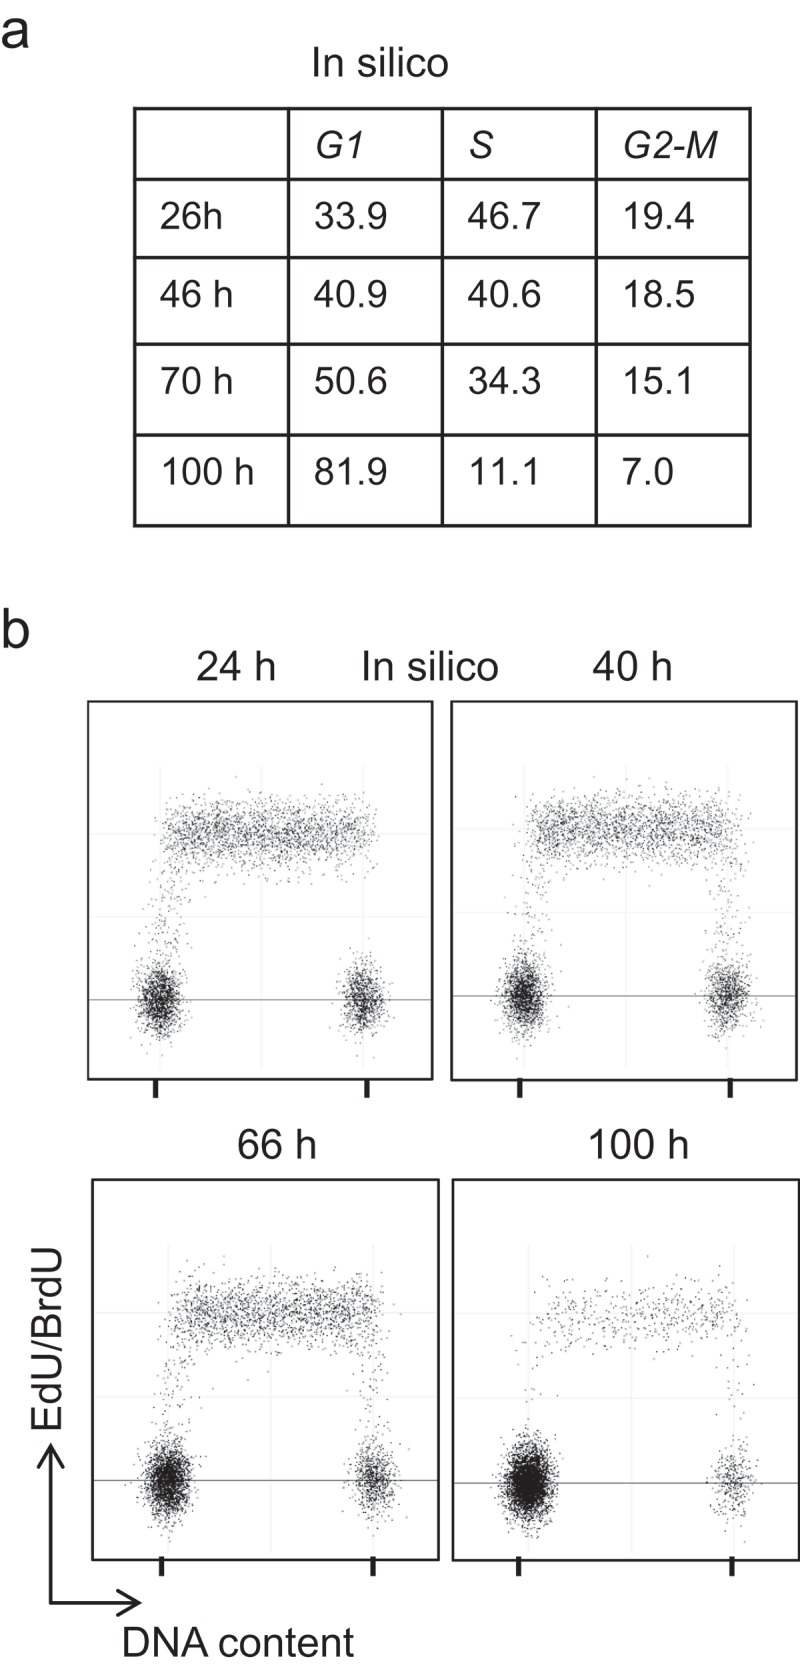
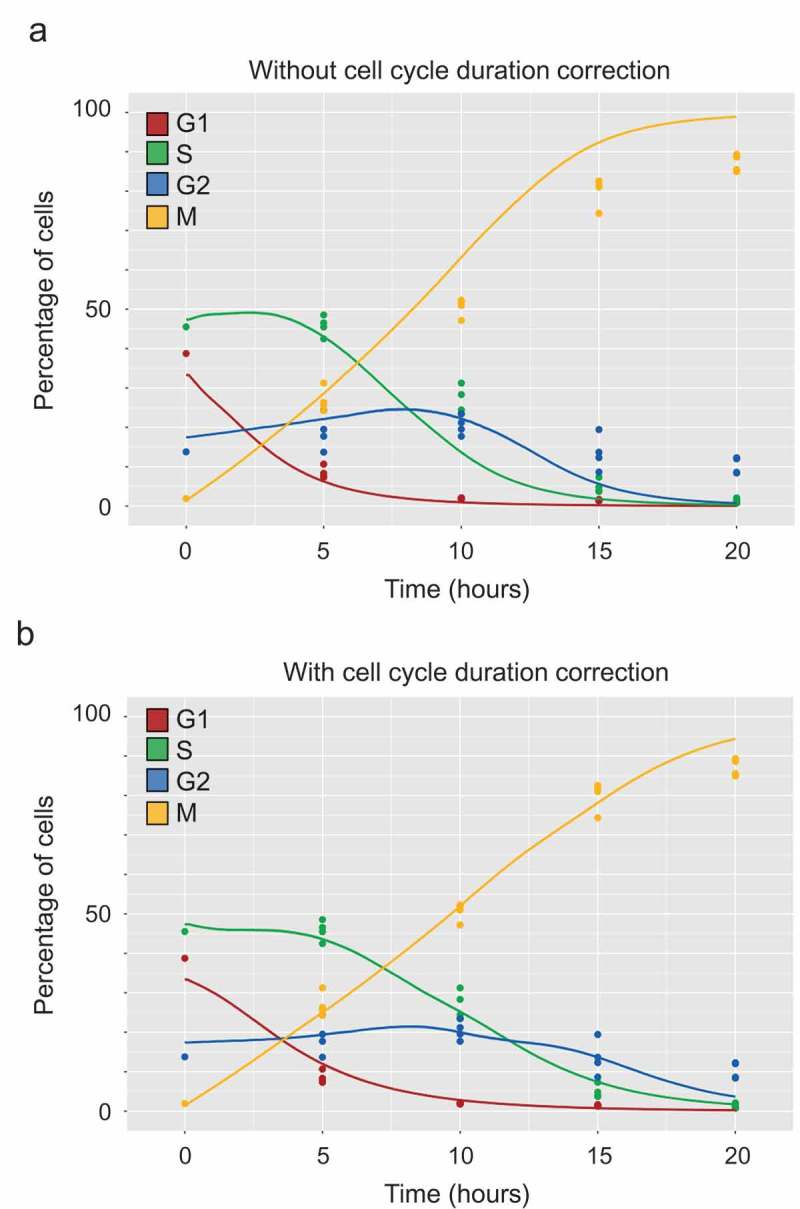
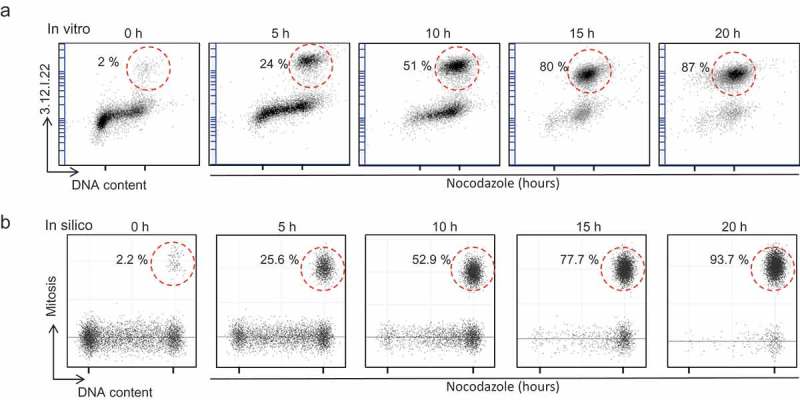
Modeling and in silico simulations are of major conceptual and applicative interest in studying the cell cycle and proliferation in eukaryotic cells. In this paper, we present a cell cycle checkpoint-oriented simulator that uses agent-based simulation modeling to reproduce the dynamics of a cancer cell population in exponential growth. Our in silico simulations were successfully validated by experimental in vitro supporting data obtained with HCT116 colon cancer cells. We demonstrated that this model can simulate cell confluence and the associated elongation of the G1 phase. Using nocodazole to synchronize cancer cells at mitosis, we confirmed the model predictivity and provided evidence of an additional and unexpected effect of nocodazole on the overall cell cycle progression. We anticipate that this cell cycle simulator will be a potential source of new insights and research perspectives.

Keywords: Cell cycle; agent-based modeling; in silico simulation; synchronization.


Figures

Figure 1.
Figure 1.
Schematic representation of the cell cycle model (a) Cell cycle model: the cell cycle is modeled by the succession of 10 Bernoulli processes; grey processes correspond to the checkpoints (R, G1/S, G2/M and intraMitotic, iM) and contain only one step. The duration of the other processes is discretized in fixed-time steps, and the number of the resulting steps corresponds to the number of Bernoulli trials that the cell will have to successfully perform to move to the next process. The probability Px is the probability of success of the Bernoulli draws associated with each process x. This allows the regulation of the progression speed in each of the sub-phases. (b) Model of the environment: each of the three panels shows the local environment of the central blue cell at different occupancy stages in its Moore neighborhood, with the corresponding local density Dc indicated.
Figure 2.
Figure 2.
Settings of the cell cycle model (a) Cell cycle distribution of exponentially growing HCT116 cells (experimental data). These input data were extracted from the data collected in the log phase of the experiment shown in Supplementary Figure S1. (b) Cell cycle and age distribution of an exponentially growing HCT116 cell population. The colored areas under the curve indicate the distribution of the cells in each phase (in percentage) according to [42]. On the lower line are indicated the deduced phase durations (in hours). (c) Table showing the duration of each cell cycle phase in exponentially growing HCT116 cells deduced from the representation presented in panel (b).
Figure 3.
Figure 3.
Experimental data from an exponentially growing HCT116 cell population Variation of the cell cycle distribution in HCT116 cells over time. At the indicated time points during culture, the cell cycle distribution was analyzed by flow cytometry after DNA staining with the DRAQ-5 fluorescent probe and labeling of S-phase cells with EdU (30 min pulse). (a) Percentage of cells in each cell cycle phase, and (b) dot plots showing the DNA content and EdU labeling at different time points.
Figure 4.
Figure 4.
In silico determination of G1 elongation Graphical representation of the G1 phase elongation induced by the increasing cell confluence. The percentage of cells in the G1 phase of the cell cycle can be converted into the duration of G1 phase elongation. It was assumed that the duration of the S, G2 and M phases did not change.
Figure 5.
Figure 5.
Simulation data of a growing HCT116 cell population In silico simulation of the variation of HCT116 cell cycle distribution. (a) Average percentage of cells in each phase from 50 simulations, and (b) Simulated dot plots of DNA content (with additive white Gaussian noise, SD = 0.05) and EdU-positive cells (with additive white Gaussian noise, SD = 0.1).
Figure 6.
Figure 6.
Comparison of in vitro and in silico results after nocodazole synchronization (a, b) Colored dots (experimental data): Exponentially growing HCT116 cells were incubated with 200 ng/ml nocodazole for 20 h. The cell cycle repartition was analyzed by flow cytometry after DNA labeling with DRAQ-5 and detection of mitotic cells using a specific monoclonal antibody [41]. The obtained triplicate results are represented by dots of different colors for each phase. Colored curves (in silico data): average phase distribution obtained from 50 simulations. (a) Comparison of the experimental (dots) and in silico results (curves) obtained by modeling nocodazole effect as a complete block of the iM checkpoint (PiM=0). (b) Comparison of the experimental (dots) and in silico results (curves) obtained by modeling nocodazole as a non-permissive block of the iM checkpoint (PiM=0) with the elongation of the other phases (EG1=1.4 h, ES=1.9 h, and EG2=0.2 h) that was determined by sampling the Bernoulli probabilities PG1, PS, PG2. The figure reports the parameters that best fit the experimental data (see Materials and Methods for additional explanations).
Figure 7.
Figure 7.
The cell cycle simulator reproduces the cell cycle arrest in mitosis of HCT116 cells incubated with nocodazole (a) In vitro data: Exponentially growing HCT116 cells were incubated with nocodazole for 20 h, like in Figure 4. Dot plot representation of the cell cycle distribution obtained by flow cytometry analysis after DNA staining with DRAQ-5 and labeling of mitotic cells with the 3.12.I.22 antibody. (b) In silico simulation: simulated dot plots of the DNA content and mitotic cell labeling.

References

    1. Hartwell LH. Cell division from a genetic perspective. J Cell Biol. 1978;77:627–637. - PMC - PubMed
    1. Hunt T. Maturation promoting factor, cyclin and the control of M-phase. Curr Opin Cell Biol. 1989;1:74–286. - PubMed
    1. Nurse P. Universal control mechanism regulating onset of M-phase. Nature. 1990;344:503–508. - PubMed
    1. Sherr CJ, Beach D, Shapiro GI. Targeting CDK4 and CDK6: from discovery to therapy. Cancer Discov. 2016;6:353–367. - PMC - PubMed
    1. Bell GI, Anderson EC. Cell growth and division. I. A mathematical model with applications to cell volume distributions in mammalian suspension cultures. Biophys J. 1967;7:329–351. - PMC - PubMed

Publication types