. 2019 Jun 1;33(7):1231-1240.
doi: 10.1097/QAD.0000000000002190.

A generalizable method for estimating duration of HIV infections using clinical testing history and HIV test results

Affiliations

A generalizable method for estimating duration of HIV infections using clinical testing history and HIV test results

Christopher D Pilcher et al. AIDS. .

Abstract

Objective: To determine the precision of new and established methods for estimating duration of HIV infection.

Design: A retrospective analysis of HIV testing results from serial samples in commercially available panels, taking advantage of extensive testing previously conducted on 53 seroconverters.

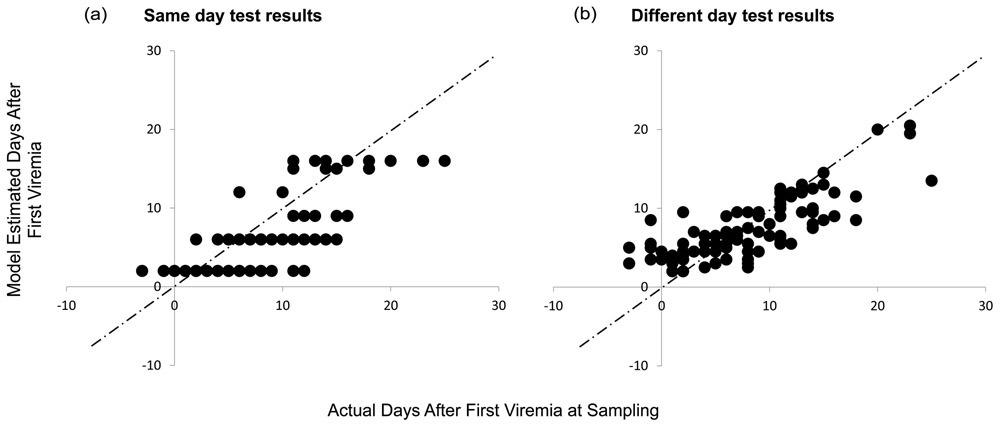
Methods: We initially investigated four methods for estimating infection timing: method 1, 'Fiebig stages' based on test results from a single specimen; method 2, an updated '4th gen' method similar to Fiebig stages but using antigen/antibody tests in place of the p24 antigen test; method 3, modeling of 'viral ramp-up' dynamics using quantitative HIV-1 viral load data from antibody-negative specimens; and method 4, using detailed clinical testing history to define a plausible interval and best estimate of infection time. We then investigated a 'two-step method' using data from both methods 3 and 4, allowing for test results to have come from specimens collected on different days.

Results: Fiebig and '4th gen' staging method estimates of time since detectable viremia had similar and modest correlation with observed data. Correlation of estimates from both new methods (3 and 4), and from a combination of these two ('two-step method') was markedly improved and variability significantly reduced when compared with Fiebig estimates on the same specimens.

Conclusion: The new 'two-step' method more accurately estimates timing of infection and is intended to be generalizable to more situations in clinical medicine, research, and surveillance than previous methods. An online tool is now available that enables researchers/clinicians to input data related to method 4, and generate estimated dates of detectable infection.


Figures

Figure 1.
Figure 1.. The testing history method.
The panels illustrate how an estimated date of detectable infection (EDDI), and a “plausible interval” for this estimate, can be inferred from HIV testing histories that include the dates and qualitative results on each HIV assay used. Testing history timelines are shown for three representative HIV seroconverters, with hypothetical dates of tests inputted and date of detectable infection (DDI) outputs shown along the x-axis as calendar days. Triangles represent HIV tests performed (solid=positive; empty=negative). The “diagnostic delay” from first detectable infection to initial positivity has been determined experimentally for most assays (see Table S1). For any result, the diagnostic delay for the assay used can be subtracted from the test date, to give an earlier date which is interpreted differently depending on whether the result is now negative or positive. If the result is negative, we infer that the patient’s actual DDI probably occurred sometime after that earlier date (else we would expect the assay result to now already be positive). If the result is positive, we infer that the DDI had probably already occurred by the earlier date (else, the result would still likely be negative). In the figures, white bars show ranges for the EDDI that are inconsistent with the particular result. Taken across all results in the history, these define the “earliest-and latest-plausible dates of detectable infection” (EP-DDI and LP-DDI). The “plausible interval” for the EDDI is bounded by these dates as shown by the black bar. The best estimate of the EDDI from the qualitative HIV testing history is then the midpoint of this plausible interval (shown by the circle). The method applies to discrepant qualitative HIV test results obtained on the same day (e.g., “antibody negative/RNA positive” (Panel A), but also applies when discrepant HIV results were obtained on two (Panel B) or multiple (Panel C) encounters: information from multiple test encounters may narrow the plausible interval and hence improve precision of the EDDI. Additional abbreviations: quant = quantitative; VL = viral load; RT = rapid test; WB = Western blot; Full = fully reactive assay.
Figure 2.
Figure 2.. Estimates obtained using alternative staging methods, plotted versus time since infection (days since DDI100).
In each figure, infection times predicted by each method (y axis) are compared with observed times (x axis) for 206 specimens from 31 seroconverters frequently donating blood plasma (all available data from all panels, including those used in model development and those used in model validation). Infection times are given as days since first viremia detected at the 100 RNA-copy/mL threshold (DDI100); timing of first viremia was estimated within <3.5 days. Black circles represent specimens that were negative on the Western blot, while specimens with indeterminate Western blots are shown with white (unfilled) circles. Plots (A) and (B) show the distributions of infection times predicted by Fiebig and 4th gen staging methods, respectively. Plot (C) shows the distribution of times for the seroconversion testing history method only, “step 2” of the 2-step method described in Figure 1, using the diagnostic delays in Table S1 for specimens with discrepant results occurring on the same day. Plot (D) shows the distribution of times for the 2-step method. While the testing history method can take all results into account, the plot again shows results limited to tests performed on the same day. In all four plots results were used from five assay types: viral load, p24 antigen ELISA, IgG-only, IgM/IgG antibody immunoassays and Western blot. In Plot (D), for antibody positive specimens only the qualitative results on the five assay types were used; for antibody negative specimens the method also used quantitative viral load information.
Figure 3.
Figure 3.. Estimates of infection duration obtained using discrepant, same-day qualitative test results (A) or using test results obtained from the same subjects on two different days (B).
Estimates of time since first viremia detectable at 100 RNA copies/mL (DDI100) are shown on the y axis for alternative scenarios of all panel observations using the testing history method, versus observed times on the x axis. In the first same-day scenario (Panel A), time was calculated based on results occurring on that day. In the serial testing scenario (Panel B), the data from that date were ignored and instead, test results from the visit prior to and after that visit were used to generate the DDI100. In both scenarios results were used from five assay types: viral load, p24 antigen ELISA, IgM-sensitive and recombinant IgG-sensitive antibody immunoassays, and Western blot, and analysis was limited to n=104 specimens from N=30 individuals with results for all 5 assay types.

References

    1. Fiebig EW, Wright DJ, Rawal BD, Garrett PE, Schumacher RT, Peddada L, et al. Dynamics of HIV viremia and antibody seroconversion in plasma donors: implications for diagnosis and staging of primary HIV infection. AIDS. 2003;17(13):1871–9. - PubMed
    1. Cohen MS, Gay CL, Busch MP, Hecht FM. The detection of acute HIV infection. The Journal of Infectious Diseases. 2010;202 Suppl 2:S270–7. - PubMed
    1. Ananworanich J, Fletcher JL, Pinyakorn S, van Griensven F, Vandergeeten C, Schuetz A, et al. A novel acute HIV infection staging system based on 4th generation immunoassay. Retrovirology. 2013;10:56. - PMC - PubMed
    1. Panel on Treatment of Pregnant Women with HIV Infection and Prevention of Perinatal Transmission. Recommendations for Use of Antiretroviral Drugs in Transmission in the United States; 2018.
    1. Priddy FH, Pilcher CD, Moore RH, Tambe P, Park MN, Fiscus SA, et al. Detection of acute HIV infections in an urban HIV counseling and testing population in the United States. Journal of Acquired Immune Deficiency Syndromes. 2007;44(2):196–202. - PubMed

Publication types