

Influence of Genetic Variants on Steady-State Etonogestrel Concentrations Among Contraceptive Implant Users
- PMID: 30870275
- PMCID: PMC6448146
- DOI: 10.1097/AOG.0000000000003189
Influence of Genetic Variants on Steady-State Etonogestrel Concentrations Among Contraceptive Implant Users
Abstract
Objective: To identify genetic variants that influence steady-state etonogestrel concentrations among contraceptive implant users.
Methods: We enrolled healthy, reproductive-age women in our pharmacogenomic study using etonogestrel implants for 12-36 months without concomitant use of hepatic enzyme inducers or inhibitors. We collected participant characteristics, measured serum etonogestrel concentrations, and genotyped each participant for 120 single nucleotide variants in 14 genes encoding proteins involved in steroid hormone (ie, estrogens, progestins) metabolism, regulation, or function. We performed generalized linear modeling to identify genetic variants associated with steady-state etonogestrel concentrations.
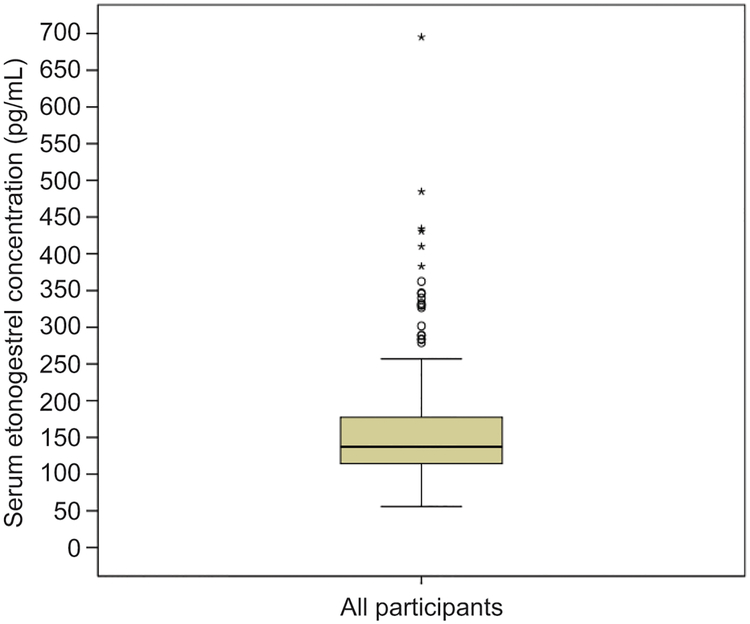
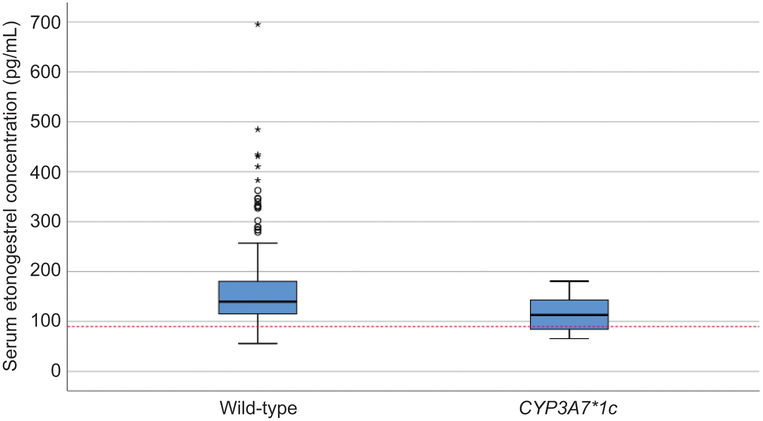
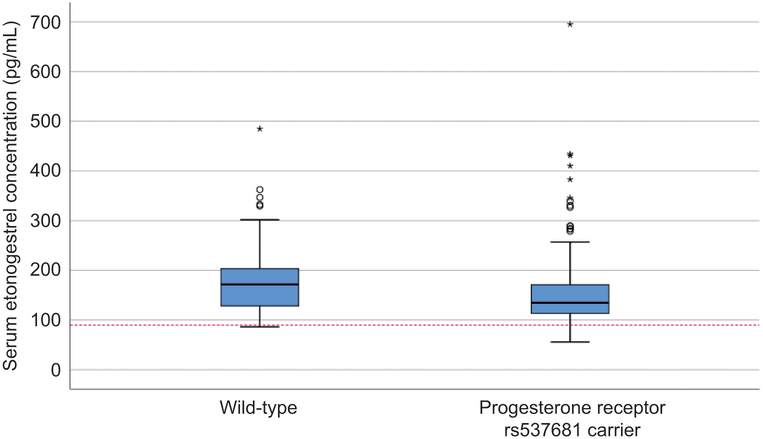
Results: We enrolled 350 women, who had a median serum etonogestrel concentration of 137.4 pg/mL (range 55.8-695.1). Our final generalized linear model contained three genetic variants associated with serum etonogestrel concentrations: NR1I2(PXR) rs2461817 (β=13.36, P=.005), PGR rs537681 (β=-29.77, P=.007), and CYP3A7*1C (β=-35.06, P=.025). Variant allele frequencies were 69.4%, 84.9%, and 5.1%, respectively. Our linear model also contained two nongenetic factors associated with etonogestrel concentrations: body mass index (BMI) (β=-3.08, P=7.0×10) and duration of implant use (β=-1.60, P=5.8×10); R for the model =0.17.
Conclusion: Only BMI and duration of implant use remained significantly associated with steady-state etonogestrel concentrations. Of the three novel genetic associations found, one variant associated with increased etonogestrel metabolism (CYP3A7*1C) causes adult expression of fetal CYP3A7 proteins and can consequently alter steroid hormone metabolism. Women with this variant may potentially have increased metabolism of all steroid hormones, as 27.8% (5/18) of CYP3A7*1C carriers had serum etonogestrel concentrations that fell below the threshold for consistent ovulatory suppression (less than 90 pg/mL). More pharmacogenomic investigations are needed to advance our understanding of how genetic variation can influence the effectiveness and safety of hormonal contraception, and lay the groundwork for personalized medicine approaches in women's health.
Clinical trial registration: ClinicalTrials.gov, NCT03092037.
Conflict of interest statement
Financial Disclosure
Dr. Teal has served on scientific advisory boards of Allergan and Bayer Healthcare, and serves on a Data Monitoring Board for a study funded by Merck and Co. Dr. Teal and Dr. Lazorwitz receive research funding from Merck and Co. for an Investigator Initiated Study on drug-drug interactions with the etonogestrel contraceptive implant. The University of Colorado Department of Obstetrics and Gynecology has received research funding from Bayer, Agile Therapeutics, Merck and Co, and Medicines360. Dr. Guiahi’s time was supported by the Society of Family Planning Junior Investigator Career Grant SFPRF10-JI1. The other authors did not report any potential conflicts of interest.
Figures


Similar articles
-
Relationship between patient characteristics and serum etonogestrel concentrations in contraceptive implant users.Contraception. 2019 Jul;100(1):37-41. doi: 10.1016/j.contraception.2019.03.045. Epub 2019 Apr 10. Contraception. 2019. PMID: 30980827 Free PMC article.
-
An exploratory analysis on the influence of genetic variants on weight gain among etonogestrel contraceptive implant users.Contraception. 2020 Sep;102(3):180-185. doi: 10.1016/j.contraception.2020.05.002. Epub 2020 May 12. Contraception. 2020. PMID: 32407811 Free PMC article.
-
An exploratory study on the association of lifestyle factors with serum etonogestrel concentrations among contraceptive implant users.Eur J Contracept Reprod Health Care. 2021 Aug;26(4):323-325. doi: 10.1080/13625187.2021.1887475. Epub 2021 Feb 17. Eur J Contracept Reprod Health Care. 2021. PMID: 33596152 Free PMC article.
-
Medical eligibility criteria for new contraceptive methods: combined hormonal patch, combined hormonal vaginal ring and the etonogestrel implant.Contraception. 2006 Feb;73(2):134-44. doi: 10.1016/j.contraception.2005.08.002. Epub 2005 Oct 20. Contraception. 2006. PMID: 16413844 Review.
-
Subdermal contraceptive implants.J Steroid Biochem Mol Biol. 1995 Jun;53(1-6):223-6. doi: 10.1016/0960-0760(95)00051-z. J Steroid Biochem Mol Biol. 1995. PMID: 7626459 Review.
Cited by
-
BET proteins: Investigating BRDT as a potential target for male contraception.Bioorg Med Chem Lett. 2020 Mar 15;30(6):126958. doi: 10.1016/j.bmcl.2020.126958. Epub 2020 Jan 21. Bioorg Med Chem Lett. 2020. PMID: 32019712 Free PMC article. Review.
-
Advances in Precision Health and Emerging Diagnostics for Women.J Clin Med. 2019 Sep 23;8(10):1525. doi: 10.3390/jcm8101525. J Clin Med. 2019. PMID: 31547515 Free PMC article. Review.
-
Protocol for the Endometriosis Research Queensland Study (ERQS): an integrated cohort study approach to improve diagnosis and stratify treatment.BMJ Open. 2022 Oct 14;12(10):e064073. doi: 10.1136/bmjopen-2022-064073. BMJ Open. 2022. PMID: 36241351 Free PMC article.
-
Letter to the Editor in Response to "Effect of Polymorphisms in CYP2C9 and CYP2C19 on the Disposition, Safety and Metabolism of Progesterone Administrated Orally or Vaginally".Adv Ther. 2020 Feb;37(2):963-964. doi: 10.1007/s12325-019-01195-y. Epub 2019 Dec 24. Adv Ther. 2020. PMID: 31875298 Free PMC article. No abstract available.
-
Drug interactions: not just for orally administered drugs.Lancet HIV. 2019 Sep;6(9):e563-e564. doi: 10.1016/S2352-3018(19)30185-7. Lancet HIV. 2019. PMID: 31498104 Free PMC article. No abstract available.
References
-
- Deininger KM, Vu A, Page RL 2nd, Ambardekar AV, Lindenfeld J, Aquilante CL. CYP3A pharmacogenetics and tacrolimus disposition in adult heart transplant recipients. Clin Transplant 2016. September;30(9):1074–81. - PubMed
-
- Sukasem C, Chamnanphon M, Koomdee N, Santon S, Jantararoungtong T, Prommas S, et al. Pharmacogenetics and clinical biomarkers for subtherapeutic plasma efavirenz concentration in HIV-1 infected Thai adults. Drug Metab Pharmacokinet 2014;29(4):289–95. - PubMed
Publication types
MeSH terms
Substances
Associated data
Grants and funding
LinkOut - more resources
Full Text Sources
Medical
Research Materials
