

Change in Second-Trimester Abortion After Implementation of a Restrictive State Law
- PMID: 30870293
- PMCID: PMC6435408
- DOI: 10.1097/AOG.0000000000003183
Change in Second-Trimester Abortion After Implementation of a Restrictive State Law
Abstract
Objective: To assess whether indicators of limited access to services explained changes in rates of second-trimester abortion after implementation of a restrictive abortion law in Texas.
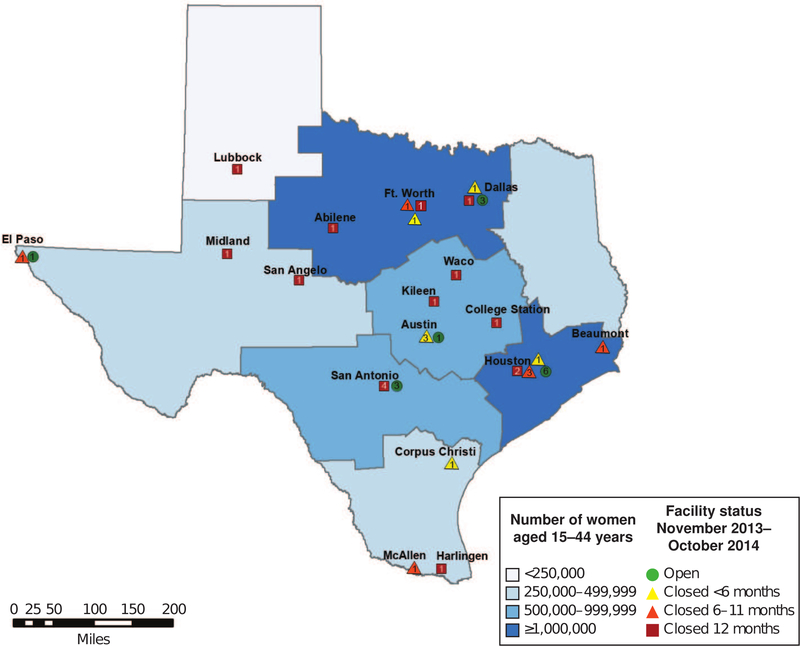
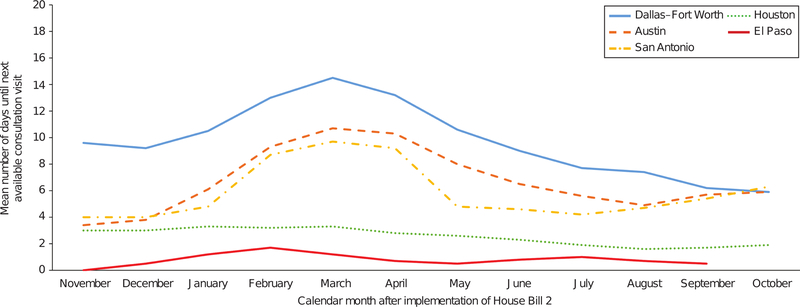
Methods: We used cross-sectional vital statistics data on abortions performed in Texas before (November 1, 2011-October 31, 2012) and after (November 1, 2013-October 31, 2014) implementation of Texas' abortion law. We conducted monthly mystery client calls for information about abortion facility closures and appointment wait times to calculate distance from women's county of residence to the nearest open Texas facility, the number of open abortion facilities in women's region of residence (facility network size), and days until the next consultation visit. We estimated mixed-effects logistic regression models to assess the association between obtaining abortion care after the law's implementation and having a second-trimester abortion (12 weeks of gestation or more), after adjustment for distance, network size, and wait times.
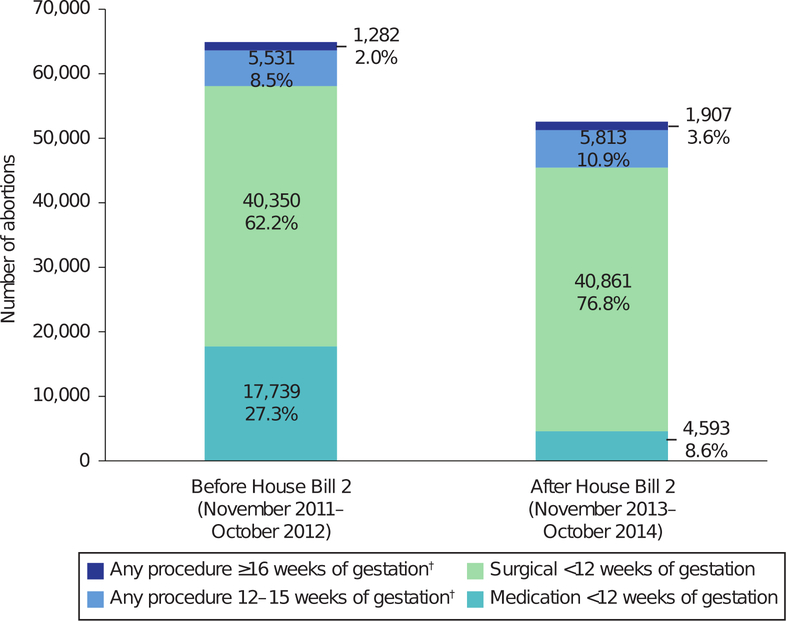
Results: Overall, 64,902 Texas-resident abortions occurred in the period before the law was introduced and 53,174 occurred after its implementation. After implementation, 14.5% of abortions were performed at 12 weeks of gestation or more, compared with 10.5% before the law (P<.001; unadjusted odds ratio [OR] 1.45; 95% CI 1.40-1.50). Adjusting for distance to the nearest facility and facility network size reduced the odds of having a second-trimester abortion after implementation (OR 1.17; 95% CI 1.10-1.25). Women living 50-99 miles from the nearest facility (vs less than 10 miles) had higher odds of second-trimester abortion (OR 1.24; 95% CI 1.11-1.39), as did women in regions with less than one facility per 250,000 reproductive-aged women compared with women in areas that had 1.5 or more facilities (OR 1.57; 95% CI 1.41-1.75). After implementation, women waited 1 to 14 days for a consultation visit; longer waits were associated with higher odds of second-trimester abortion.
Conclusion: Increases in second-trimester abortion after the law's implementation were due to women having more limited access to abortion services.
Figures
References
-
- Nash E, Gold RB, Mohammed L, Ansari-Thomas Z, Cappello O. Policy trends in the states, 2017. Washington, D.C.: Guttmacher Institute; 2018. https://www.guttmacher.org/article/2018/01/policy-trends-states-2017. Accessed June 9, 2018.
-
- Upadhyay UD, Desai S, Zlidar V, et al. Incidence of emergency department visits and complications after abortion. Obstet Gynecol 2015;125(1):175–183. - PubMed
Publication types
MeSH terms
Grants and funding
LinkOut - more resources
Full Text Sources
Medical
