Comparative Study
. 2019 Mar 14;14(3):e0213909.
doi: 10.1371/journal.pone.0213909. eCollection 2019.

Depolarizing metrics for plant samples imaging

Affiliations
Comparative Study

Depolarizing metrics for plant samples imaging

Albert Van Eeckhout et al. PLoS One. .

Abstract

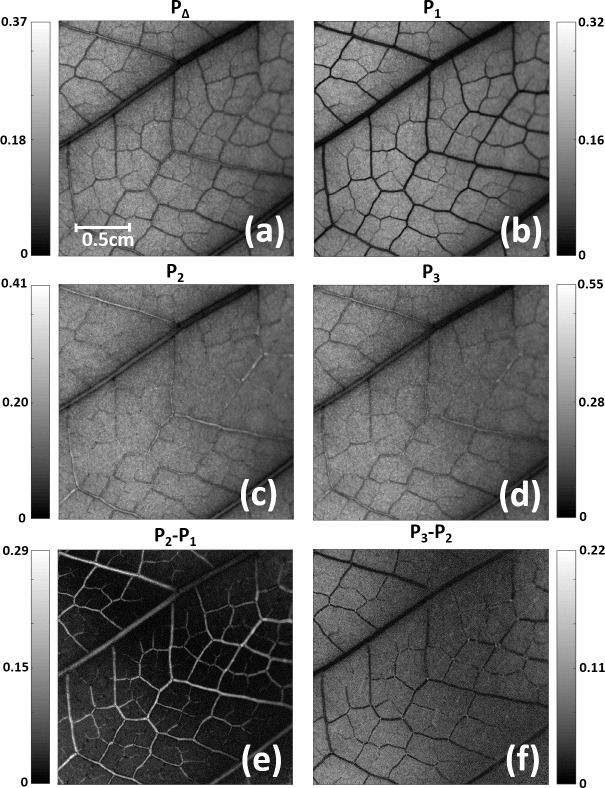
Optical methods, as fluorescence microscopy or hyperspectral imaging, are commonly used for plants visualization and characterization. Another powerful collection of optical techniques is the so-called polarimetry, widely used to enhance image contrast in multiple applications. In the botanical applications framework, in spite of some works have already highlighted the depolarizing print that plant structures left on input polarized beams, the potential of polarimetric methods has not been properly exploited. In fact, among the few works dealing with polarization and plants, most of them study light scattered by plants using the Degree of Polarization (DoP) indicator. Other more powerful depolarization metrics are nowadays neglected. In this context, we highlight the potential of different depolarization metrics obtained using the Mueller matrix (MM) measurement: the Depolarization Index and the Indices of Polarimetric Purity. We perform a qualitative and quantitative comparison between DoP- and MM-based images by studying a particular plant, the Hedera maroccana. We show how Mueller-based metrics are generally more suitable in terms of contrast than DoP-based measurements. The potential of polarimetric measurements in the study of plants is highlighted in this work, suggesting they can be applied to the characterization of plants, plant taxonomy, water stress in plants, and other botanical studies.


Conflict of interest statement

The authors have declared that no competing interests exist.

Figures

Fig 1
Fig 1
Plant sample used for the polarimetric analysis: (a) Hedera maroccana plant; (b) Hedera maroccana measured leaf (Sample A).
Fig 2
Fig 2. Scheme of the imaging polarimeter used to measure the Mueller matrices of plant leaves.
Fig 3
Fig 3
(a) Nonpolarized light intensity image of the Hedera maroccana (Sample A) obtained on transmission. (b)-(d) DoP image for an input polarization: (b) linear polarization at 0°; (c) linear polarization at 45°; (d) left-handed circular polarization. Input polarization is marked in red at the top-right corner of the images.
Fig 4
Fig 4. Poincaré sphere showing the location of the input polarizations (N = 200) used to study the dependence of the input polarization on the DoP-based images contrast.
Fig 5
Fig 5. DoP values as a function of the input linear polarization orientations.
Orange (squared), red (circle), blue (triangle) and purple (inverted triangle) curves correspond to the segments of the same color in Fig 3A.
Fig 6
Fig 6. Visibility values calculated from DoP images corresponding to 200 different input polarizations (k parameter).
(a) Orange curve and blue curve provide the visibility related to the orange and blue segments in Fig 3A, respectively; and (b) Mean visibility (black curve) as a function of the input polarization, calculated from 10 different segments (orange, blue and 8 green lines in Fig 3A) arbitrarily selected along the leaf. The corresponding standard deviations values are given by the upper and lower dashed black lines.
Fig 7
Fig 7
Hedera maroccana (Sample A) images obtained by using different depolarizing based indicators: (a) Depolarization Index PΔ; (b)-(d) Indices of Polarimetric Purity (IPPs), P1, P2 and P3. Sample A images obtained by combining different IPP channels: (e) P2-P1; and (f) P3-P2.

References

    1. Ovečka M, von Wangenheim D, Tomančák P, Šamajová O, Komis G, and Šamaj J, Multiscale imaging of plant development by light-sheet fluorescence microscopy, Nature Plants 2018; 4: 639–650. 10.1038/s41477-018-0238-2 - DOI - PubMed
    1. Yu K-Q, Zhao Y-R, Li X-L, Shao Y-N, Liu F, et al. Hyperspectral Imaging for Mapping of Total Nitrogen Spatial Distribution in Pepper Plant. PLoS ONE 2014; 9(12): e116205 10.1371/journal.pone.0116205 - DOI - PMC - PubMed
    1. Staedler YM, Masson D, and Schönenberger J, Plant Tissues in 3D via X-Ray Tomography: Simple Contrasting Methods Allow High Resolution Imaging. PLoS ONE 2013; 8(9): e75295 10.1371/journal.pone.0075295 - DOI - PMC - PubMed
    1. Huisken J, Swoger J, Del Bene F, Wittbrodt J, and Stelzer E.H.K, Optical Sectioning Deep Inside Live Embryos by Selective Plane Illumination Microscopy, Science 2004; 305(5686): 1007–1009. 10.1126/science.1100035 - DOI - PubMed
    1. Noda J, Okamoto K, Sasaki Y, Polarization-maintaining fibers and their applications, J. Lightwave Techn. 1986; 4(8): 1071–1089.

Publication types