. 2019 Mar 14;15(3):e1007617.
doi: 10.1371/journal.ppat.1007617. eCollection 2019 Mar.

Recurrent herpes simplex virus-1 infection induces hallmarks of neurodegeneration and cognitive deficits in mice

Affiliations

Recurrent herpes simplex virus-1 infection induces hallmarks of neurodegeneration and cognitive deficits in mice

Giovanna De Chiara et al. PLoS Pathog. .

Abstract

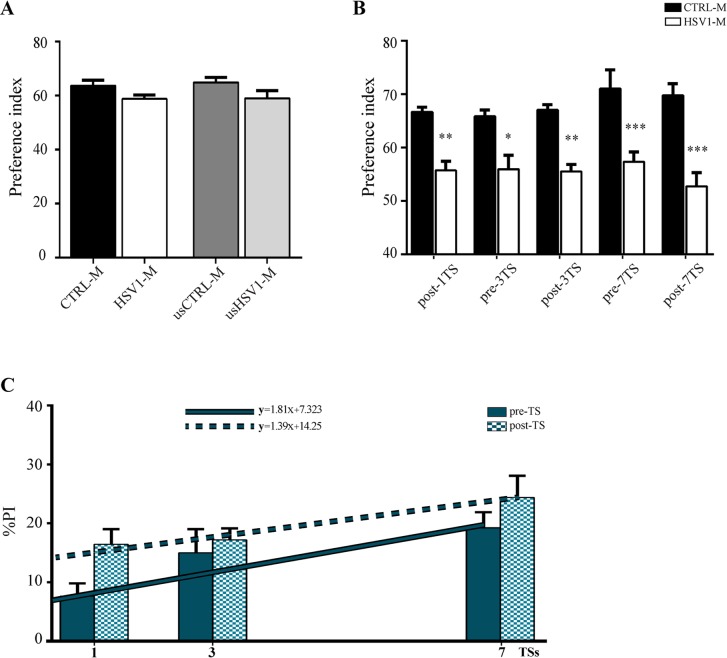
Herpes simplex virus type 1 (HSV-1) is a DNA neurotropic virus, usually establishing latent infections in the trigeminal ganglia followed by periodic reactivations. Although numerous findings suggested potential links between HSV-1 and Alzheimer's disease (AD), a causal relation has not been demonstrated yet. Hence, we set up a model of recurrent HSV-1 infection in mice undergoing repeated cycles of viral reactivation. By virological and molecular analyses we found: i) HSV-1 spreading and replication in different brain regions after thermal stress-induced virus reactivations; ii) accumulation of AD hallmarks including amyloid-β protein, tau hyperphosphorylation, and neuroinflammation markers (astrogliosis, IL-1β and IL-6). Remarkably, the progressive accumulation of AD molecular biomarkers in neocortex and hippocampus of HSV-1 infected mice, triggered by repeated virus reactivations, correlated with increasing cognitive deficits becoming irreversible after seven cycles of reactivation. Collectively, our findings provide evidence that mild and recurrent HSV-1 infections in the central nervous system produce an AD-like phenotype and suggest that they are a risk factor for AD.


Conflict of interest statement

The authors have declared that no competing interests exist.

Figures

Fig 1
Fig 1. Schematic representation of the experimental design.
(A) Timeline of biochemical and molecular analyses: 6–8 week-old BALB/c mice were infected with HSV-1 (n = 45, HSV1-M) or mock solution (n = 29, CTRL-M); 6 CTRL-M and 6 HSV1-M were separated 6 weeks post infection (p.i.) as UNSTRESSED group (named hereafter usHSV1-M and usCTRL-M, see upper arrow), the other mice undergone several cycles of thermal stress (TS) as described in Methods (bottom arrow); one day before the 1st TS (6 weeks p.i.), 6 HSV1-M and 2 CTRL-M were sacrificed and their brain samples were collected for PCR analysis. Similarly, other mice were sacrificed, and their brain samples collected 24 h post the 1st TS (n = 9 HSV1-M, n = 2 CTRL-M), the 3rd TS (n = 5 HSV1-M, n = 3 CTRL-M) and following the 7th TS (n = 9 HSV1-M, n = 8 CTRL-M). Brain areas from 3 TK+ HSV1-M sacrificed 24 h post the 3rd TS, and from 4 TK+ HSV1-M sacrificed 14 days post the 7th TS were used for WB and ELISA assay. Matched CTRL-M were similarly analyzed. Fourteen days post the 3rd TS (n = 2) and the 7th TS (n = 3) the indicated HSV1-M were perfused with PFA and their brain slices analyzed by IF. Matched CTRL-M were sacrificed for the same analyses. Timeline of behavioral tests: UNSTRESSED mice were tested in NOR 11 months p.i., and then sacrificed for biochemical analyses (upper arrow); 7 days before and after the indicated TS the same subset of 9 HSV1-M and 9 CTRL-M were subjected to NOR test (lasting 3 days), and then sacrificed for biochemical and molecular analyses as indicated above (bottom arrow). (B) 6–8 week-old BALB/c mice were infected with HSV-1 (n = 24, HSV1-M) or mock solution (n = 15, CTRL-M) under the same experimental conditions of A. Four days p.i., 6 HSV1-M and 2 CTRL-M were sacrificed and their lips, TGs and bran tissues collected and analyzed by virological techniques for the presence of the virus; TGs were also assessed by WB for ICP4 presence. The other mice undergone several cycles of TS as for mice described in A. Infectious virus isolation was performed from TGs and brain areas from 4 HSV1-M and 4 CTRL-M sacrificed 24 h post the 3rd TS and titered by SPA post incubation on VERO cells, as described in methods. Infectious virus isolation was performed also from TGs and brain areas from 3 HSV1-M and 2 CTRL-M sacrificed before the 7th TS and 2 HSV1-M and 2 CTRL-M sacrificed 24h post the 7th TS. Their titers were directly assessed by ICW assay. Fourteen days after the 7th TS, 3 HSV1-M were perfused with PFA (post-7TS). In parallel, 4 HSV1-M that did not undergo the 7th TS were perfused with PFA (pre-7TS). Brain slices from pre- and post-7TS mice were then analyzed by IF for gB expression and phospho-tau (p-tau) levels. Matched CTRL-M were parallel analyzed in IF.
Fig 2
Fig 2. Presence of HSV-1 in the brain.
(A) Table summarizing the percentage of TK+ brains at the indicated time points as found with PCR performed on subsets of mice sacrificed 6 weeks p.i. (0 TS), and following the 1st, 3rd, and 7th TS. These analyses were performed on DNA isolated from whole brain or from specific cerebral regions: those brains showing TK gene in at least one region were considered positive. (B) Representative image of PCR amplification of TK gene in 4 out of 29 HSV1-M and the corresponding CTRL-M. C = negative control of PCR reaction; V = HSV-1 TK amplification, as positive control. The total number of the studied brains and the percentages of TK+ brains are shown under the gel. (C) Confocal immunofluorescence analysis of gB and Glial Fibrillary Acidic Protein (GFAP) expression in brain slices from HSV1-M (n = 3) and CTRL-M (n = 2) sacrificed following the 7th TS. Two randomly selected coronal sections were analyzed for each brain. Representative images of different areas within hippocampus (DG = dentate gyrus, CA1/molecular layer), and somatosensory neocortex (CTX) are shown. Nuclear bodies were stained by DAPI. Dotted lines delimitate pyramidal neuron layer in CA1 and granule cell layer (GCL) from hilus in DG. Arrowheads indicate gB+ cells. Scale bar: 50 μm.
Fig 3
Fig 3. Efficacy of virus inoculation and reactivation in mice.
(A-C) Efficacy of virus inoculation. (A) Western blot showing the presence of ICP4 in trigeminal ganglia (TGs) from HSV1-M (n = 6) and CTRL-M (n = 2) sacrificed 4 days p.i.; tubulin expression level was used as sample loading control. (B) Lip, TG, hippocampus (HP), cortex (CTX) and cerebellum (CB) from HSV1-M were homogenized as described in Methods, and incubated on VERO cells for 3 h, then replaced with complete RPMI. Four days p.i., cell supernatants were harvested and then assayed on VERO cells by standard plaque assay (SPA, n = 2 for each tissue) and Reed and Muench method (TCDI50, n = 2 for each tissue) to evaluate virus titer. Scatter dot plot shows the individual and mean values of virus titer (log10 PFU/ml) assayed by SPA (blue dots) and TCID50 (purple dots). (C) In Cell Western (ICW) assay, upper image: after 3h of incubation with the indicated serial dilutions of TG-derived supernatants (TG-derived supernatants, n = 2, obtained as described in B), VERO cells were left for 72 h with RPMI 2% FBS and then fixed and stained with anti-gB antibody (green, upper wells); lower image: the same staining was performed on VERO cells infected for 24 h with stock HSV-1 or mock solution at the indicated dilutions (Infected VERO cells). Arrowheads indicate representative gB+ foci of infection. (D) TG and the indicated brain tissues were harvested from 4 HSV1-M sacrificed 24h after the 3rd TS, homogenized as described in Methods, incubated on VERO cells for 3 h, then replaced with complete RPMI. Four days p.i., cell supernatants were harvested and then assayed on VERO cells by SPA. Scatter dot plot shows the individual and mean values of virus titer (log10 PFU/ml) assayed by SPA (blue dots).
Fig 4
Fig 4. Multiple HSV-1 reactivations induce increased Aβ accumulation.
Confocal immunofluorescence analysis of coronal brain slices from HSV1-M and CTRL-M undergone 7 TSs (n = 3 mice for each experimental group). Two/three coronal sections were analyzed for each brain. Aβ40/42 were recognized by immunoreactivity for a specific antibody (see S7B Fig). Neurons were identified by their immunoreactivity for anti-NeuN antibody. Cell nuclei were stained with DAPI. Panels show representative images from dentate gyrus (DG), hippocampal CA1 (including the molecular layer) and somatosensory neocortex (CTX). Insets show higher magnification (4×) of boxes outlined in each panel. Dotted lines delimitate pyramidal neuron layer in CA1 and granule cell layer (GCL) from hilus in DG. Scale bar: 50 μm. Bar graphs showing mean Aβ fluorescence intensity quantified in the studied brain areas and expressed as fold change with respect to CTRL-M. Data are represented as: mean ± SEM, * p<0.05, ** p<0.01.
Fig 5
Fig 5. Multiple HSV-1 reactivations induce Aβ accumulation and deposition in amyloid plaques.
(A) Representative images of immunoperoxidase staining of Aβ40/42 in coronal brain slices from HSV1-M and CTRL-M undergone 7 TSs. (B) Thioflavin-S (ThS) staining (green) in brain slices from mice undergone 7 TSs. Representative images of CTX, CA1 and DG are shown from 1 out of the 3 studied mice. As positive control the same analysis was performed on brain slices from 9-month-old 3×TgAD mouse. Arrowheads indicate plaques, dotted lines delimitate pyramidal neuron layer in CA1 and granule cell layer (GCL) between molecular layer (mol) and hilus in DG. Scale bars: 50 μm.
Fig 6
Fig 6. Multiple HSV-1 reactivations induce tau phosphorylation, cleavage and aggregation.
Levels of phospho-tau and of its cleaved fragment TauC3 were investigated by the aid of specific antibodies in (A) neocortex (left gel) and hippocampus (right gel) homogenates from CTRL-M and HSV1-M sacrificed following 7 TSs (n = 4 for each experimental group), (B) neocortex homogenates from usCTRL-M and usHSV1-M (n = 4 for each experimental group). Actin or tubulin expression level was used as sample loading control. Densitometric analysis of immunoreactive signals normalized to matched tau (for phospho-tau) or actin (for tau [Tau] and TauC3) are shown in the graphs: values represent the normalized fold changes in protein levels from HSV1-M or usHSV1-M with respect to CTRL-M or usCTRL-M, respectively (mean ± SEM); * p<0.05 HSV1-M vs CTRL-M assessed by Mann-Whitney statistic.
Fig 7
Fig 7. Multiple HSV-1 reactivations induce increased levels of phosphoThr205-tau (pT205).
(A) Confocal immunofluorescence analysis of coronal brain slices from HSV1-M and CTRL-M undergone 7 TSs (n = 3 mice for each experimental group). Two/three coronal sections were analyzed for each brain. Phosphorylation of tau at Thr205 (pT205) was studied by a specific antibody (see S7B Fig). Neurons were identified by their immunoreactivity for anti-NeuN antibody. Cell nuclei were stained with DAPI. Panels show representative images from dentate gyrus (DG), CA1/molecular layer and somatosensory neocortex (CTX). Dotted lines delimitate pyramidal neuron layer in CA1 and granule cell layer (GCL) from hilus in DG. Arrowheads indicate pT205 in neurons of the hilus and in the axons of molecular layer. (B) Bar graphs showing pT205 fluorescence as the mean value of fluorescence quantified in DG and in CA1 of the hippocampus, and in CTX expressed as fold changes with respect to CTRL-M. Values are expressed as mean ± SEM, *** p<0.001 (p = 0.000159 for DG and CA1, p = 0.44 for CTX, assessed by ANOVA on ranks). Scale bar: 50 μm (C) Representative images of immunoperoxidase staining of pT205 in coronal brain slices from HSV1-M and CTRL-M undergone 7 TSs.
Fig 8
Fig 8. HSV-1 reactivations in the brain induce astrogliosis and increase brain levels of IL-1β and IL-6.
Confocal immunofluorescence analysis of coronal brain slices from HSV1-M and CTRL-M undergone 3 TSs (A, n = 2 mice for each experimental group) and 7 TSs (B, n = 3 mice for each experimental group). Three (A) or two (B) coronal sections were analyzed for each brain. GFAP was recognized by a specific antibody (see S7B Fig). Cell nuclei were stained with DAPI. Panels show representative images from hippocampal DG and CA1, and CTX. Scale bars: 75 μm. Bar graphs showing mean IL-6 (C) and IL-1β (D) levels in cortex homogenates from HSV1-M and CTRL-M undergone 3TSs and 7TSs. Values represent the normalized fold changes in protein levels from HSV1-M with respect to CTRL-M (mean ± SEM, * p<0.05 HSV1-M vs matched CTRL-M).
Fig 9
Fig 9. Behavioral alterations induced by recurrent HSV-1 infections in mice.
(A) CTRL-M (n = 9) and HSV1-M (n = 9) were tested in NOR 5 weeks p.i.. UNSTRESSED CTRL-M (usCTRL-M, n = 6) and UNSTRESSED HSV1-M (usHSV1-M, n = 6) were tested in NOR 11 months p.i.. Bar graphs show the mean values of preference index for novel object. (B-C) NOR test was repeated one week post the 1st TS (post-1TS), then one week before and after the third (pre-3TS and post-3TS, respectively) and the seventh TS (pre-7TS and post-7TS, respectively) in the same 9 CTRL-M and 9 HSV1-M tested in A, as schematized in Fig 1A. (B) Mean values of preference index for novel object are shown in the graph; * p<0.05, ** p<0.01, *** p<0.001 vs matched CTRL-M assessed by One WAY ANOVA with Tukey post-hoc correction; (C) % of NOR impairment in HSV1-M (vs matched CTRL-M) assessed as %PI (see methods) at experimental time points shown in A and B; linear regression analyses are shown as blue line for pre-TS values (F1-25 = 6.728, p = 0.016), and dashed blue line for post-TS values (F1-25 = 4.684, p = 0.04).
Fig 10
Fig 10. A schematic summary of the main results.

Similar articles

Cited by

References

    1. Roizman B, Knipe DM. Herpes simplex virus and their replication In: Knipe DM, Howley PM, editors. Fields Virology: Philadelphia, PA: Lippincott Williams and Wilkins; 2001. p. 2432–4.
    1. Kastrukoff L, Hamada T, Schumacher U, Long C, Doherty PC, Koprowski H. Central nervous system infection and immune response in mice inoculated into the lip with herpes simplex virus type 1. J Neuroimmunol. 1982;2(3–4):295–305. - PubMed
    1. Jamieson GA, Maitland NJ, Wilcock GK, Yates CM, Itzhaki RF. Herpes simplex virus type 1 DNA is present in specific regions of brain from aged people with and without senile dementia of the Alzheimer type. J Pathol. 1992;167(4):365–8. 10.1002/path.1711670403 - DOI - PubMed
    1. Schmutzhard E. Viral infections of the CNS with special emphasis on herpes simplex infections. J Neurol. 2001;248(6):469–77. - PMC - PubMed
    1. Lewandowski G, Zimmerman MN, Denk LL, Porter DD, Prince GA. Herpes simplex type 1 infects and establishes latency in the brain and trigeminal ganglia during primary infection of the lip in cotton rats and mice. Arch Virol. 2002;147(1):167–79. - PubMed

Publication types

MeSH terms

Substances