. 2019 Mar 14;15(3):e1007650.
doi: 10.1371/journal.ppat.1007650. eCollection 2019 Mar.

Varicella zoster virus productively infects human peripheral blood mononuclear cells to modulate expression of immunoinhibitory proteins and blocking PD-L1 enhances virus-specific CD8+ T cell effector function

Affiliations

Varicella zoster virus productively infects human peripheral blood mononuclear cells to modulate expression of immunoinhibitory proteins and blocking PD-L1 enhances virus-specific CD8+ T cell effector function

Dallas Jones et al. PLoS Pathog. .

Abstract

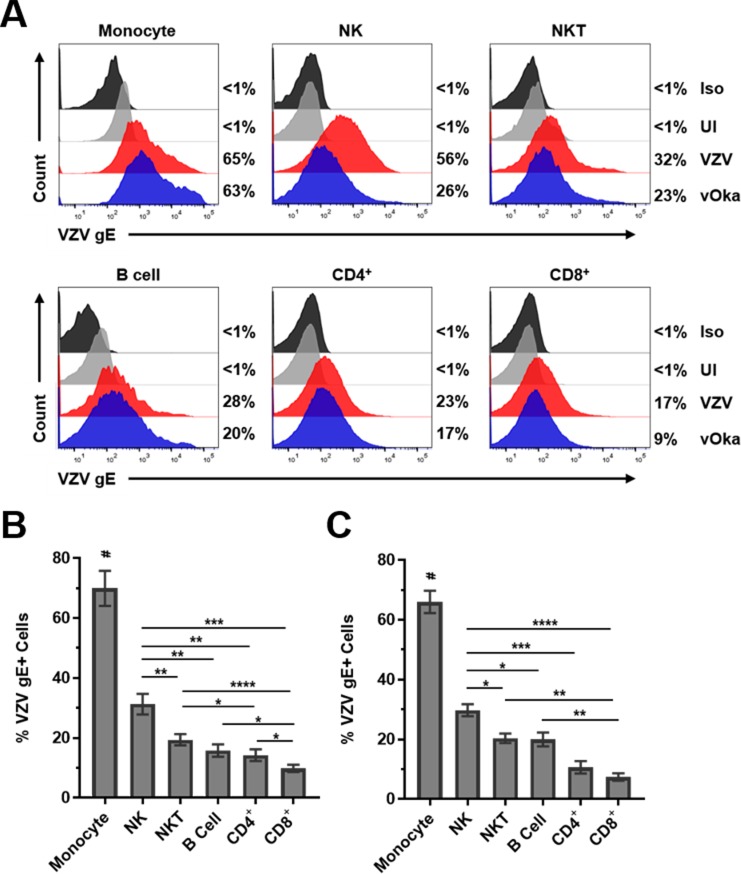
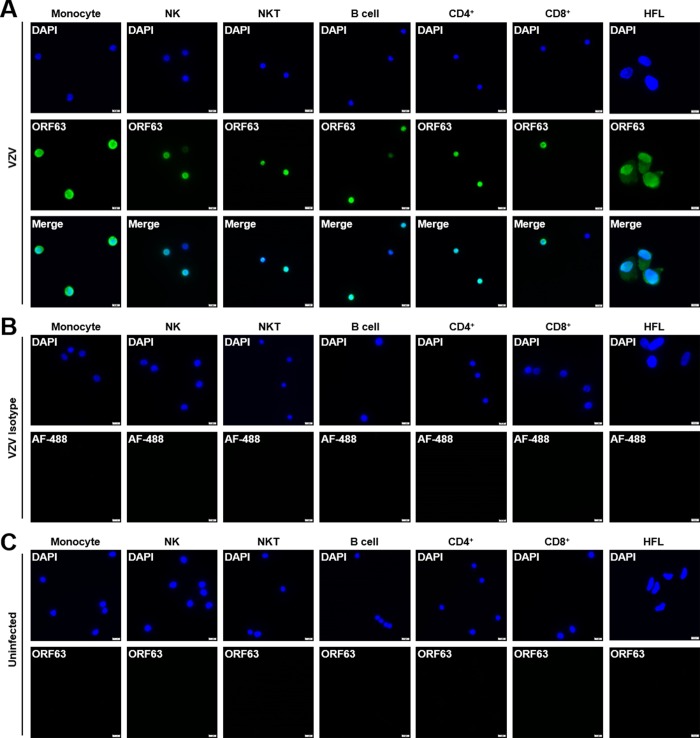
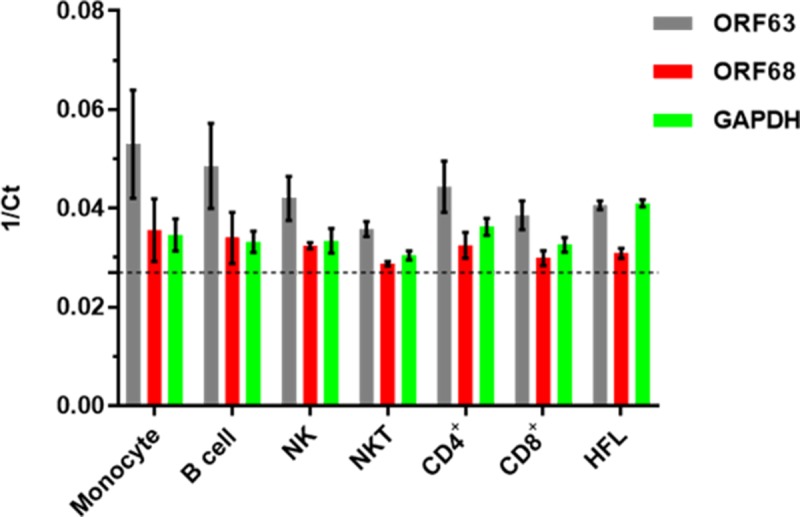
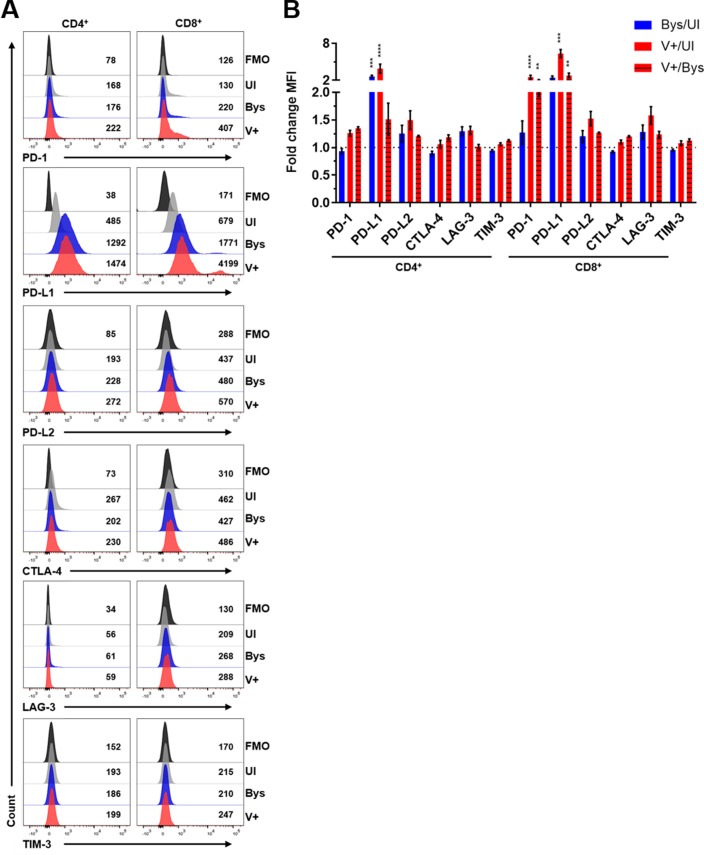
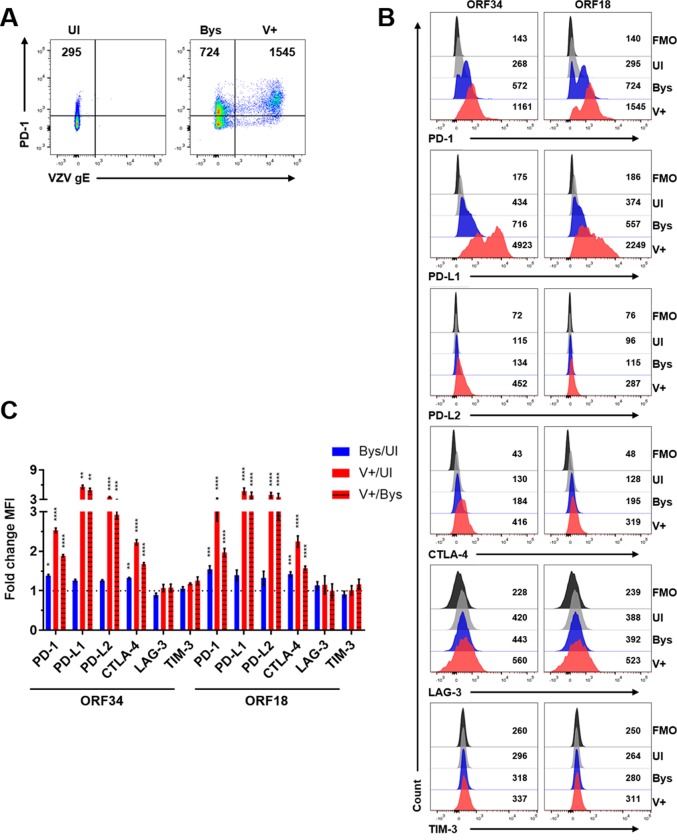
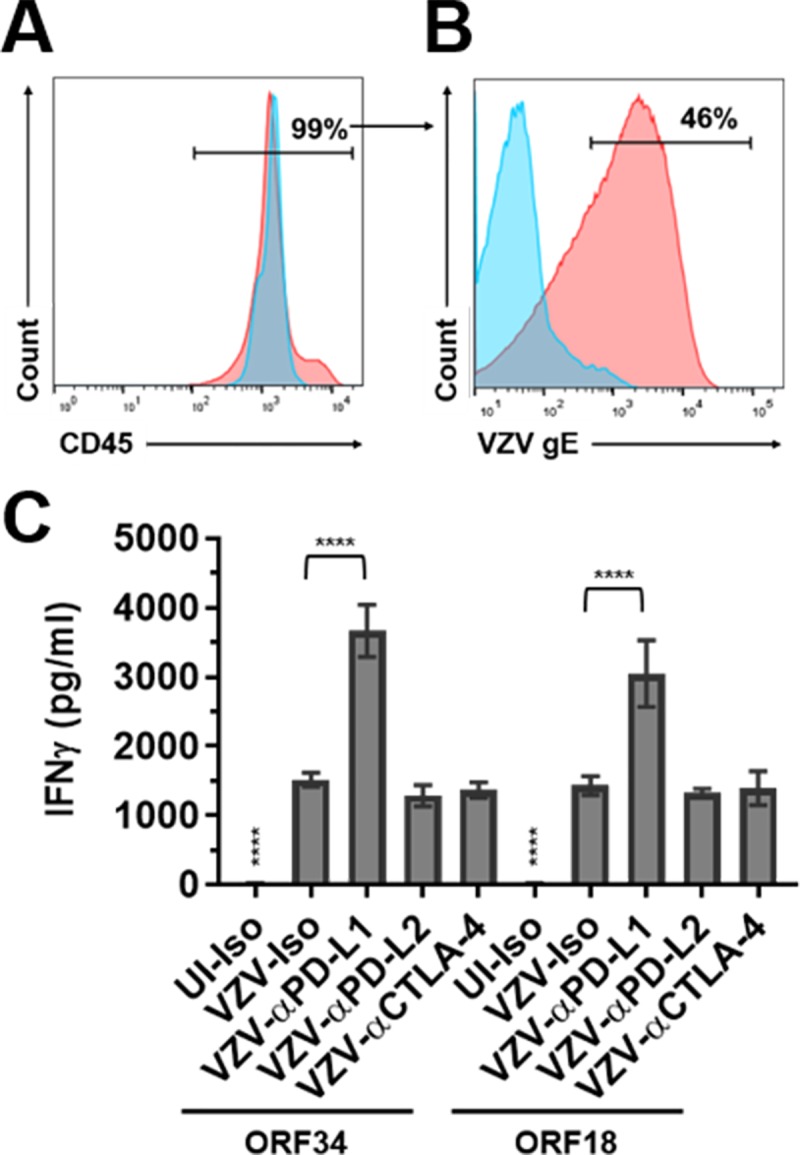
Varicella zoster virus (VZV) is a lymphotropic alpha-herpesvirinae subfamily member that produces varicella on primary infection and causes zoster, vascular disease and vision loss upon reactivation from latency. VZV-infected peripheral blood mononuclear cells (PBMCs) disseminate virus to distal organs to produce clinical disease. To assess immune evasion strategies elicited by VZV that may contribute to dissemination of infection, human PBMCs and VZV-specific CD8+ T cells (V-CD8+) were mock- or VZV-infected and analyzed for immunoinhibitory protein PD-1, PD-L1, PD-L2, CTLA-4, LAG-3 and TIM-3 expression using flow cytometry. All VZV-infected PBMCs (monocytes, NK, NKT, B cells, CD4+ and CD8+ T cells) and V-CD8+ showed significant elevations in PD-L1 expression compared to uninfected cells. VZV induced PD-L2 expression in B cells and V-CD8+. Only VZV-infected CD8+ T cells, NKT cells and V-CD8+ upregulated PD-1 expression, the immunoinhibitory receptor for PD-L1/PD-L2. VZV induced CTLA-4 expression only in V-CD8+ and no significant changes in LAG-3 or TIM-3 expression were observed in V-CD8+ or PBMC T cells. To test whether PD-L1, PD-L2 or CTLA-4 regulates V-CD8+ effector function, autologous PBMCs were VZV-infected and co-cultured with V-CD8+ cells in the presence of blocking antibodies against PD-L1, PD-L2 or CTLA-4; ELISAs revealed significant elevations in IFNγ only upon blocking of PD-L1. Together, these results identified additional immune cells that are permissive to VZV infection (monocytes, B cells and NKT cells); along with a novel mechanism for inhibiting CD8+ T cell effector function through induction of PD-L1 expression.


Conflict of interest statement

The authors have declared that no competing interests exist.

Figures

Fig 1
Fig 1. VZV infection of human monocytes, B cells, NK cells, NKT cells, CD4+ T cells and CD8+ T cells.
(A) Human PBMCs were co-cultured with uninfected- (UI) or VZV-infected HFLs for 48 h then harvested and analyzed using flow cytometry. Specific cell types expressed the following markers: monocytes = CD3-CD56-CD19-CD14hiMHC-II+; B cells = CD3-CD56-CD19+; NK cells = CD3-CD56+; NKT cells = CD3+CD56+; CD4+ T cells = CD3+CD4+CD8-, and; CD8+ T cells = CD3+CD8+CD4-. Black histograms represent isotype control (Iso) stained VZV-infected cells, grey histograms represent UI cells, red histograms represent VZV-Ellen-infected cells (VZV) and blue histograms represent vOka-infected cells (vOka). Numbers on right side of each graph represent % VZV glycoprotein E-positive (gE+) cells. (B-C) Summary of flow cytometry analyses above from VZV-Ellen (B) and vOka (C) infections from 12 and 5 different healthy individuals, respectively, with bar graphs representing average % VZV-gE+ immune cells ± SEM. *P<0.05, **P<0.01, ***P<0.001, ****P<0.0001; # above monocytes represents P<0.01 (B) and P<0.0005 (C) for significant increases in % VZV-gE+ monocytes compared to all other immune cell populations analyzed. Statistical significance was determined using RM one-way ANOVA with the Greenhouse-Geisser correction and Tukey posttest.
Fig 2
Fig 2. VZV-infected monocytes, NK cells, NKT cells, B cells, CD4+ T cells and CD8+ T cells all express nuclear VZV ORF63.
Human PBMCs were co-cultured with uninfected- or VZV-infected HFLs for 48 h, then uninfected- and VZV-infected monocytes, NK, NKT, B cells, CD4+ T and CD8+ T cells based upon surface VZV gE expression were sorted using flow cytometry and analyzed for VZV ORF63 expression using immunofluorescence. Uninfected- and VZV-infected HFLs were analyzed for ORF63 expression as well. (A) VZV-infected monocytes, NK cells, NKT cells, B cells, CD4+ T cells, CD8+ T cells and HFLs all express nuclear VZV ORF63 (green). (B) VZV-infected monocytes, NK cells, NKT cells, B cells, CD4+ T cells, CD8+ T cells and HFLs were stained with Alexa Fluor-488 (AF-488, green) only as an isotype control for ORF63 expression. (C) Uninfected monocytes, NK cells, NKT cells, B cells, CD4+ T cells, CD8+ T cells and HFLs have no VZV ORF63 expression (green). DAPI (blue) was used as cell nucleus stain. Magnification, X400. Size bar = 10μm. Results representative of duplicate experiments using PBMCs from 2 different healthy donors.
Fig 3
Fig 3. Quantitative RT-PCR analyses of GAPdH, VZV ORF63 and ORF68 expression in VZV-infected monocytes, NK cells, NKT cells, B cells, CD4+ T cells, CD8+ T cells and HFLs.
Human PBMCs were infected with VZV as described in Fig 1, then uninfected- and VZV-infected monocytes, NK cells, NKT cells, B cells, CD4+ T cells and CD8+ T cells were sorted using flow cytometry. RNA was harvested and then analyzed by quantitative RT-PCR for ORF63 (grey bars), ORF68 (red bars) and GAPdH (green bars) transcripts. In addition, VZV-infected HFLs that were >90% VZV gE+ based upon flow cytometry analyses were harvested as a positive control for viral transcript expression. Results representative of sorted PBMCs from 3 different healthy individuals and from 3 independent HFL infections, with bar graphs representing average 1/Ct ± SD. Dotted line represents threshold for Ct values (1/36). All immune cell populations were >93% pure based upon flow cytometry sorting.
Fig 4
Fig 4. Monocytes, NK cells, NKT cells, B cells, CD4+ T cells and CD8+ T cells are productively infected by VZV and capable of transmitting virus.
Human PBMCs were co-cultured with VZV-infected HFLs for 48 h, then VZV-infected monocytes, NK, NKT, B cells, CD4+ T and CD8+ T cells were sorted using flow cytometry. Individual sorted immune cells were then washed with citrate buffer followed by FACS buffer before co-culturing with uninfected HFLs. After 5 days of co-culture, immunofluorescence analyses of VZV ORF63 (green) and VZV glycoprotein B (gB, red) revealed productive infection of HFLs by all individual immune cell populations analyzed. Specifically, top panels 1 to 3 (left to right) show individual channels for DAPI, ORF 63 and VZV gB in HFLs exposed to VZV-infected monocytes—with panel 4 representing a merged image demonstrating expression of both VZV proteins. Lower merged panels show co-expression of ORF 63 and VZV gB in HFLs exposed to VZV-infected NK cells, NKT cells, B cells, CD4+ T cells and CD8+ T cells. Negative controls were provided by omission of primary antibody on VZV-infected HFLs (top right panel). DAPI (blue) was used as cell nucleus stain. Magnification, X100. Results representative of duplicate experiments using PBMCs from 2 different healthy donors.
Fig 5
Fig 5. VZV-mediated regulation of PD-L1, PD-L2 and PD-1 expression in human monocytes, B cells, NK cells and NKT cells.
Human PBMCs were co-cultured with uninfected- or VZV-infected HFLs for 48 h as described in Fig 1 then harvested and analyzed for PD-1, PD-L1, PD-L2 and VZV gE expression using flow cytometry. (A) Flow cytometry gating strategy for uninfected (UI), VZV gE-negative bystander (Bys) and VZV gE+ (V+) immune cell populations. (B) Representative flow cytometry plots of PD-L1, PD-L2 and PD-1 MFI expression levels in monocytes (Mono), NK cells, NKT cells and B cells. Black histograms = FMO control, grey histograms = UI, blue histograms = Bys and red histograms = V+ cells. (C-E) Summary of fold change in MFI in PD-L1 (C), PD-L2 (D) and PD-1 (E) expression levels in: Bys/UI (blue), V+/UI (red) and V+/Bys (red with black stripes) with respect to all immune cell populations analyzed. Results are representative of eight independent experiments with PBMCs from eight healthy individuals. Bar graphs represent average fold-change in MFI ± SEM. *P<0.05, **P<0.01, ***P<0.001, ****P<0.0001. Statistical significance was determined using RM one-way ANOVA with the Greenhouse-Geisser correction and Tukey posttest.
Fig 6
Fig 6. VZV-mediated regulation of PD-1, PD-L1, PD-L2, CTLA-4, LAG-3 and TIM-3 expression in human CD4+ and CD8+ T cells.
Human PBMCs from Fig 4 were co-cultured with uninfected- or VZV-infected HFLs for 48 h as described in Fig 1 then harvested and analyzed for PD-1, PD-L1, PD-L2, CTLA-4, LAG-3, TIM-3 and VZV gE expression using flow cytometry. (A) Representative flow cytometry plots of PD-1, PD-L1, PD-L2, CTLA-4, LAG-3 and TIM-3 MFI expression levels in CD4+ and CD8+ T cells. Black histograms = FMO control, grey histograms = UI, blue histograms = Bys and red histograms = V+ cells. (B) Summary of fold change in MFI in PD-1, PD-L1, PD-L2, CTLA-4, LAG-3 and TIM-3 expression levels in: Bys/UI (blue), V+/UI (red) and V+/Bys (red with black stripes) with respect to CD4+ and CD8+ T cells. Results are representative of eight independent experiments with PBMCs from eight healthy individuals that are from the same experiments shown in Fig 4. Bar graphs represent average fold-change in MFI ± SEM. **P<0.01, ***P<0.001, ****P<0.0001. Statistical significance was determined using RM one-way ANOVA with the Greenhouse-Geisser correction and Tukey posttest.
Fig 7
Fig 7. VZV ORF34- and ORF18-specific CD8+ T cells recognize VZV-infected HBVAFs and are prone to infection.
(A) HBVAFs were uninfected- (UI) or VZV-infected (V+) for 72 h and then cultured alone or with VZV ORF34- or ORF18-specific CD8+ T cells for an additional 48 h. After 48 h of co-culturing, phase contrast microscopy images were taken. Black arrows represent CD8+ T cells and red arrows represent VZV-infected region of HBVAFs. Magnification, X100. Representative images of 4 independent experiments. (B) Cell culture supernatants were harvested 24 h after co-culturing VZV ORF34- or ORF18-specific CD8+ T cells with UI- or VZV-infected HBVAFs/HFLs and analyzed for IFNγ levels using ELISA. Results representative of 8 independent experiments with bar graphs representing average IFNγ levels (pg/ml) ± SEM. Statistical significance was determined using the unpaired Student’s t-test. ****P<0.0001. (C) Representative flow cytometry analyses of VZV gE expression in live CD8+ T cells 48 h after co-culturing. Black histograms = Isotype control (Iso), grey = UI cells, blue histograms = VZV-infected ORF34 cells, red histograms = VZV-infected ORF18 cells. Numbers represent % of cells VZV gE+. (D) Summary of flow cytometry analyses of % VZV gE+ cells in live CD8+ ORF34- or ORF-18 specific T cells. Results representative of 19 and 16 independent experiments from VZV ORF18- and ORF34-specific CD8+ T cells, respectively. Bar graphs represent average % of cells VZV gE+ ± SEM.
Fig 8
Fig 8. VZV-mediated induction of PD-1, PD-L1, PD-L2 and CTLA-4 expression in VZV ORF34- or ORF18-specific CD8+ T cells.
VZV ORF34- or ORF18-specific CD8+ T cells were co-cultured with uninfected- or VZV-infected HFLs/HBVAFs for 48 h, harvested and analyzed for VZV-gE, PD-1, PD-L1, PD-L2, CTLA-4, LAG-3 and TIM-3 expression. Live CD8+ cells are shown. (A) Flow cytometry gating strategy for uninfected (UI), VZV gE-negative bystander (Bys) and VZV gE+ (V+) CD8+ T cells. (B) Representative flow cytometry plots of PD-1, PD-L1, PD-L2, CTLA-4, LAG-3 and TIM-3 MFI expression levels. Black histograms = FMO control, grey histograms = UI, blue histograms = Bys and red histograms = V+ cells. (C) Summary of fold change in MFI in PD-1, PD-L1, PD-L2, CTLA-4, LAG-3 and TIM-3 expression levels in: Bys/UI (blue), V+/UI (red) and V+/Bys (red with black stripes) with respect to ORF34- or ORF18-specific CD8+ T cells. Results are representative of 19, 16 and 12 independent experiments for PD-1/PD-L1, PD-L2/CTLA-4 and LAG-3/TIM-3 expression in VZV ORF18-specific CD8+ T cells, respectively, and of 14, 10 and 6 independent experiments for PD-1/PD-L1, PD-L2/CTLA-4 and LAG-3/TIM-3 expression in VZV ORF34-specific CD8+ T cells, respectively. Bar graphs represent average fold-change in MFI ± SEM. *P<0.05, **P<0.01, ***P<0.001, ****P<0.0001. Statistical significance was determined using RM one-way ANOVA with the Greenhouse-Geisser correction and Tukey posttest.
Fig 9
Fig 9. Only PD-L1 blockade enhances IFNγ secretion by VZV ORF34- or ORF18-specific CD8+ T cells during co-culture with autologous VZV-infected PBMCs.
PBMCs from the same donor as the VZV ORF34- and ORF18-specific CD8+ T cells were co-cultured with uninfected- or VZV-infected HFLs for 48 h and then cells were harvested and analyzed by flow cytometry for percent CD45 purity (A) and percent VZV-gE positive (B) before co-culturing with VZV ORF34- or ORF18-specific CD8+ T cells. Blue histograms represent uninfected PBMCs and red histograms represent VZV-infected PBMCs. (C) Uninfected- (UI) or VZV-infected autologous PBMCs were co-cultured with VZV ORF34- or ORF18-specific CD8+ T cells in the presence of PD-L1 (αPD-L1), PD-L2 (αPD-L2) or CTLA-4 (αCTLA-4) blocking antibodies along with isotype controls (Iso). After 24 h, cell culture supernatants were harvested and analyzed for IFNγ levels using ELISA. Results from all experiments shown are representative of triplicate experiments, with bar graphs representing mean IFNγ levels (pg/ml) ± SD. **** above UI-Iso denotes P<0.0001 for increases in IFNγ levels in all VZV-infected co-cultures compared to uninfected co-cultures. **** above VZV-αPD-L1 denotes P<0.0001 for increase in IFNγ levels compared to VZV-infected isotype controls. Statistical significance was determined using RM one-way ANOVA with the Greenhouse-Geisser correction and Tukey posttest.

References

    1. Zerboni L, Sen N, Oliver SL, Arvin AM. Molecular mechanisms of varicella zoster virus pathogenesis. Nat Rev Microbiol. 2014;12(3):197–210. Epub 2014/02/11. 10.1038/nrmicro3215 - DOI - PMC - PubMed
    1. Schmader K, George LK, Burchett BM, Pieper CF, Hamilton JD. Racial differences in the occurrence of herpes zoster. J Infect Dis. 1995;171(3):701–4. Epub 1995/03/01. . - PubMed
    1. Erskine N, Tran H, Levin L, Ulbricht C, Fingeroth J, Kiefe C, et al. A systematic review and meta-analysis on herpes zoster and the risk of cardiac and cerebrovascular events. PLoS One. 2017;12(7):e0181565 Epub 2017/07/28. 10.1371/journal.pone.0181565 - DOI - PMC - PubMed
    1. Matsukura H, Murakami M, Sakaki H, Mitani T, Shimura S. Varicella glomerulonephritis preceding the cutaneous lesions. Clin Nephrol. 2009;72(2):161–2. Epub 2009/07/31. . - PubMed
    1. Mantadakis E, Anagnostatou N, Danilatou V, Markaki EA, Spanaki AM, Briassoulis G, et al. Fulminant hepatitis due to varicella zoster virus in a girl with acute lymphoblastic leukemia in remission: report of a case and review. J Pediatr Hematol Oncol. 2005;27(10):551–3. Epub 2005/10/12. . - PubMed

Publication types

MeSH terms