

Glycogen metabolism in mink uterine epithelial cells and its regulation by estradiol, progesterone and insulin
- PMID: 30870708
- PMCID: PMC6701937
- DOI: 10.1016/j.theriogenology.2019.02.023
Glycogen metabolism in mink uterine epithelial cells and its regulation by estradiol, progesterone and insulin
Abstract
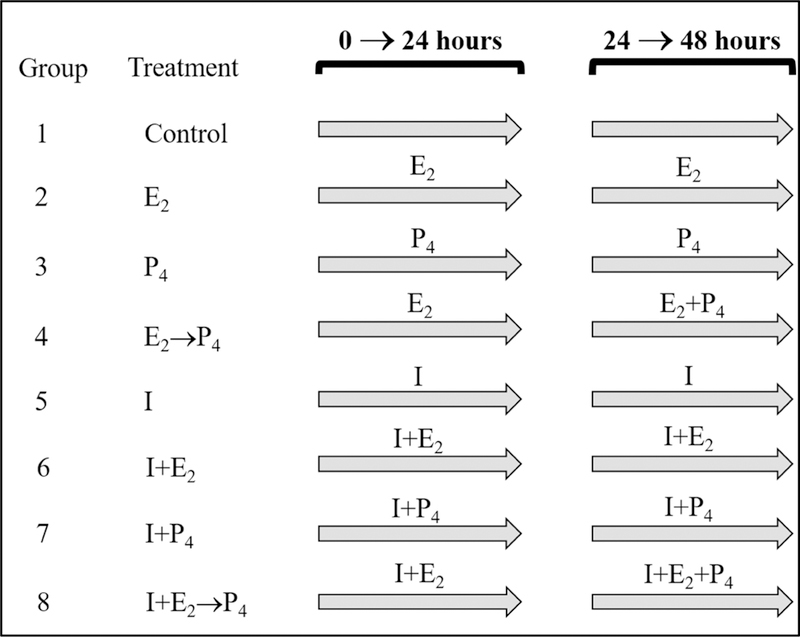
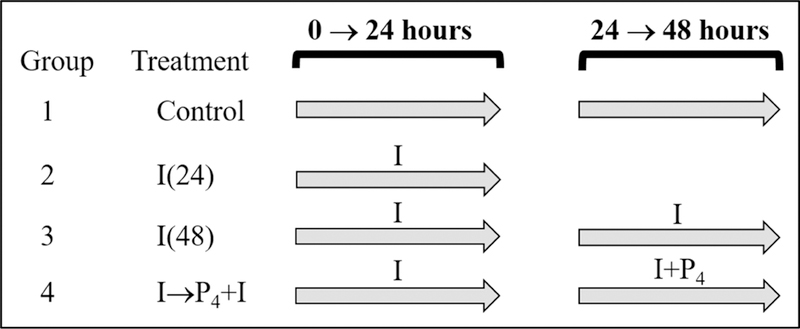
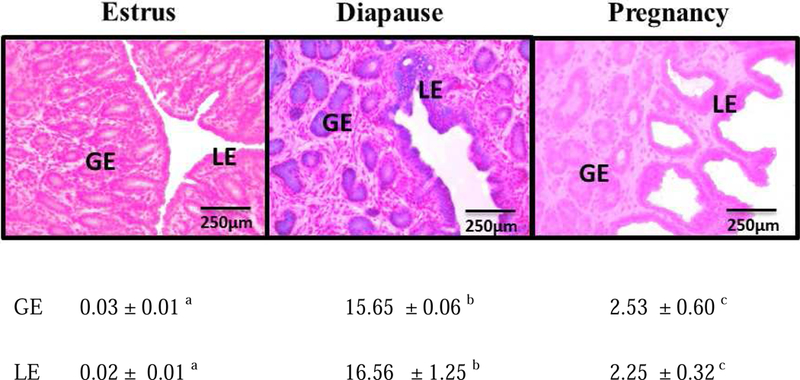
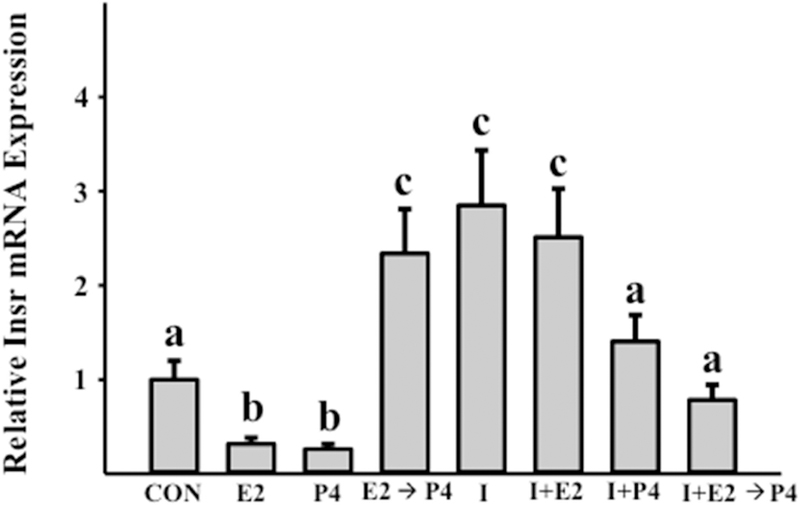
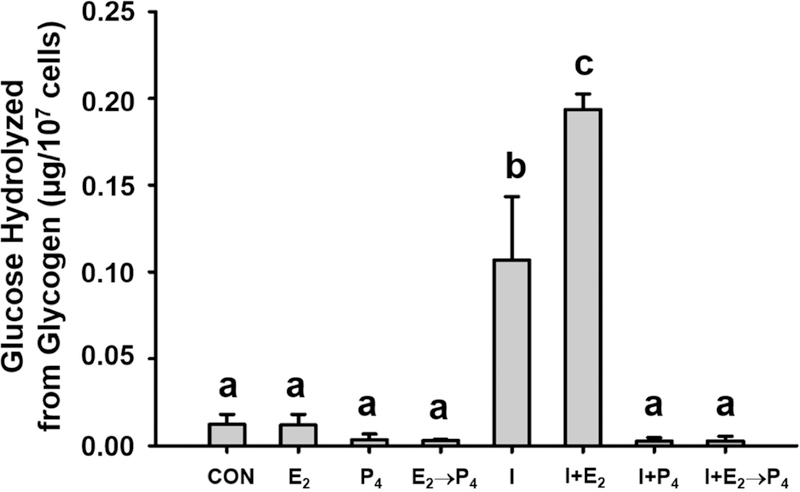
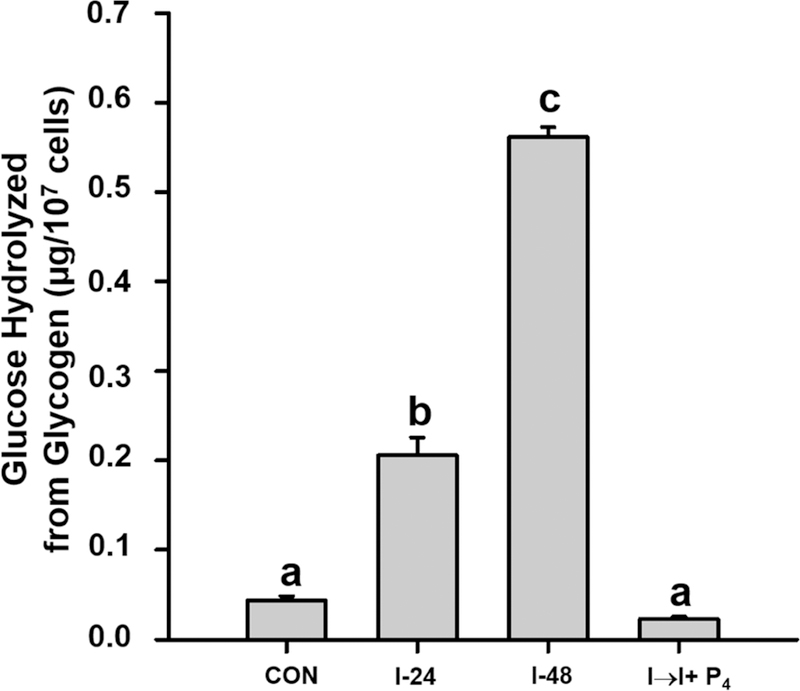
Glycogen content in mink uterine glandular and luminal epithelia (GE and LE) is maximal during estrus and is depleted before implantation while embryos are in diapause. Uterine glycogen synthesis in vivo is stimulated by estradiol (E2) while its mobilization is induced by progesterone (P4). Nevertheless, treatment of an immortalized mink uterine epithelial cell line (GMMe) with E2 did not affect glycogen production. Interestingly, insulin alone significantly increased synthesis of the nutrient and glycogen content in response to insulin + E2 was greater than for insulin alone. Our objectives were to determine: 1) If insulin receptor protein (INSR) is expressed by mink uterine GE and LE in vivo and if the amount differs between estrus, diapause and pregnancy; 2) if E2, P4 or insulin regulate insulin receptor gene (Insr) expression by GMMe cells, and 3) if E2 and P4 act independently to regulate glycogen metabolism by GMMe cells and/or if their effects are mediated in part through the actions of insulin. The mean (±S.E.) percent INSR content of uterine epithelia was greatest during diapause (GE: 15.65 ± 0.06, LE:16.56 ± 1.25), much less during pregnancy (GE: 2.53 ± 0.60, LE:2.25 ± 0.32) and barely detectable in estrus (GE: 0.03 ± 0.01, LE:0.02 ± 0.01). Glycogen concentrations in GMMe cells increased 10-fold in response to insulin and 20-fold with insulin + E2 when compared to controls. Expression of Insr was increased 2-fold by insulin and insulin + E2 when compared to controls and there was no difference between the two hormone treatments, indicating that E2 does not increase Insr expression in insulin-treated cells. To simulate E2-priming, cells were treated with Insulin + E2 for 24 h, followed by the same hormones + P4 for the second 24 h (Insulin + E2 → P4) which resulted in Insr and glycogen levels not different from controls. Similarly, cells treated with Insulin + P4 resulted in glycogen concentrations not different from controls. We conclude that the glycogenic actions of E2 on GMMe cells are due to increased responsiveness of the cells to insulin, but not as a result of up-regulation of the insulin receptor. Glycogen mobilization in response to P4 was the result of decreased glycogenesis and increased glycogenolysis occurring concomitantly with reduced Insr expression. Mink uterine glycogen metabolism appears to be regulated in a reproductive cycle-dependent manner in part as a result of the actions of E2 and P4 on cellular responsiveness to insulin.
Keywords: Estradiol; Glycogen; Insulin; Mink; Progesterone; Uterus.
Copyright © 2019 Elsevier Inc. All rights reserved.
Conflict of interest statement
Figures
Similar articles
-
Estradiol and progesterone affect enzymes but not glucose consumption in a mink uterine cell line (GMMe).Biosci Rep. 2020 Apr 30;40(4):BSR20193512. doi: 10.1042/BSR20193512. Biosci Rep. 2020. PMID: 32239183 Free PMC article.
-
Estradiol stimulates glycogen synthesis whereas progesterone promotes glycogen catabolism in the uterus of the American mink (Neovison vison).Anim Sci J. 2017 Jan;88(1):45-54. doi: 10.1111/asj.12564. Epub 2016 May 12. Anim Sci J. 2017. PMID: 27170562 Free PMC article.
-
Activation of the IGF1 receptor stimulates glycogen synthesis by mink uterine epithelial cells.Mol Reprod Dev. 2018 May;85(5):449-458. doi: 10.1002/mrd.22981. Epub 2018 Apr 23. Mol Reprod Dev. 2018. PMID: 29573521
-
Interferons and uterine receptivity.Semin Reprod Med. 2009 Jan;27(1):90-102. doi: 10.1055/s-0028-1108013. Epub 2009 Feb 5. Semin Reprod Med. 2009. PMID: 19197808 Review.
-
Estradiol and progesterone in female reward-learning, addiction, and therapeutic interventions.Front Neuroendocrinol. 2023 Jan;68:101043. doi: 10.1016/j.yfrne.2022.101043. Epub 2022 Nov 7. Front Neuroendocrinol. 2023. PMID: 36356909 Review.
Cited by
-
Endometrial Glucose Metabolism During Early Pregnancy.Reprod Fertil. 2023 Nov 1;4(4):e230016. doi: 10.1530/RAF-23-0016. Online ahead of print. Reprod Fertil. 2023. PMID: 37934727 Free PMC article.
-
Insulin Exacerbates Inflammation in Fibroblast-Like Synoviocytes.Inflammation. 2020 Jun;43(3):916-936. doi: 10.1007/s10753-020-01178-0. Inflammation. 2020. PMID: 31981062 Free PMC article.
-
Estradiol and progesterone affect enzymes but not glucose consumption in a mink uterine cell line (GMMe).Biosci Rep. 2020 Apr 30;40(4):BSR20193512. doi: 10.1042/BSR20193512. Biosci Rep. 2020. PMID: 32239183 Free PMC article.
-
Methimazole-Induced Hypothyroidism Increases the Content of Glycogen and Changes the Expression of LDH, GLUT4, and Aromatase in the Pregnant Uterus of Rabbits.Metabolites. 2025 Jan 30;15(2):82. doi: 10.3390/metabo15020082. Metabolites. 2025. PMID: 39997707 Free PMC article.
-
Progesterone increases metabolism via the pentose phosphate pathway in bovine uterine epithelial cells.Mol Biol Rep. 2024 Oct 19;51(1):1076. doi: 10.1007/s11033-024-10001-0. Mol Biol Rep. 2024. PMID: 39425753 Free PMC article.
References
-
- Gao H, Wu G, Spencer TE, Johnson GA, Bazer FW. Select nutrients in the ovine uterine lumen. II. Glucose transporters in the uterus and peri-implantation conceptuses. Biol Reprod 2009;80:94–104. - PubMed
-
- Gray CA, Taylor KM, Ramsey WS, Hill JR, Bazer FW. Bartol FF, Spencer TE, Endometrial glands are required for preimplantation conceptus elongation and survival. Biol Reprod 2001;64:1608–1613. - PubMed
-
- Hempstock J, Cindrova-Davies T, Jauniaux E, Burton GJ. Endometrial glands as a source of nutrients, growth factors and cytokines during the first trimester of human pregnancy: A morphological and immunohistochemical study. Reprod Biol Endocrinol 2004;2:58 10.1186/1477-7827-2-58. - DOI - PMC - PubMed
-
- Barnett DK, Bavister BD. What is the relationship between the metabolism of preimplantation embryos and their developmental competence? Mol Reprod Develop 1996;43:105–133. - PubMed
MeSH terms
Substances
Grants and funding
LinkOut - more resources
Full Text Sources
Medical
Miscellaneous
