. 2019 Mar 12;20(5):1238.
doi: 10.3390/ijms20051238.

The Impact of the C-Terminal Region on the Interaction of Topoisomerase II Alpha with Mitotic Chromatin

Affiliations

The Impact of the C-Terminal Region on the Interaction of Topoisomerase II Alpha with Mitotic Chromatin

Melissa Antoniou-Kourounioti et al. Int J Mol Sci. .

Abstract

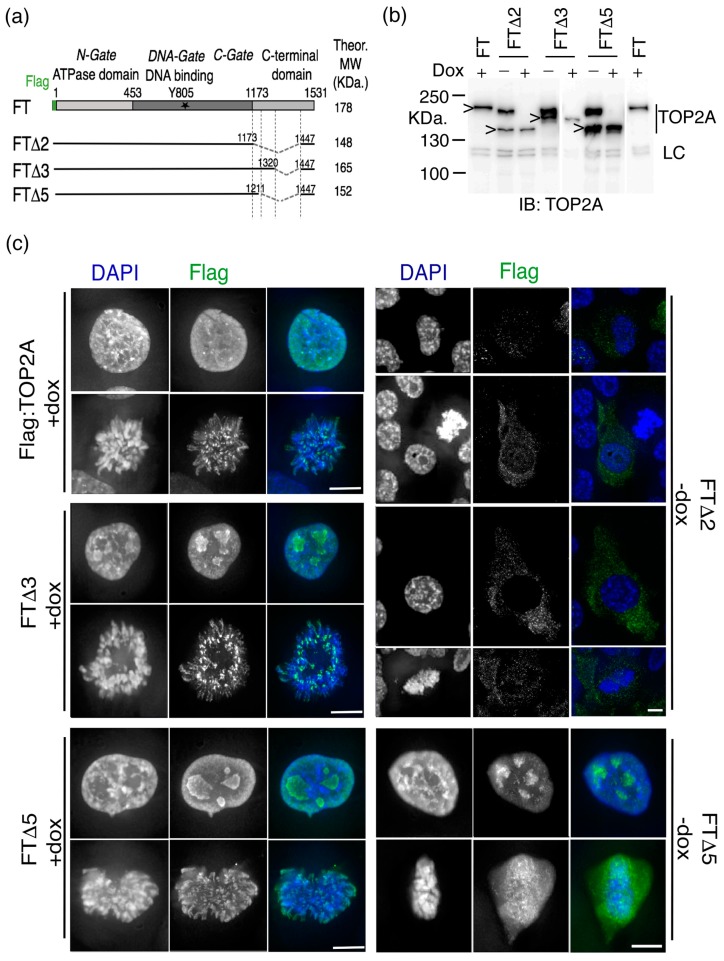
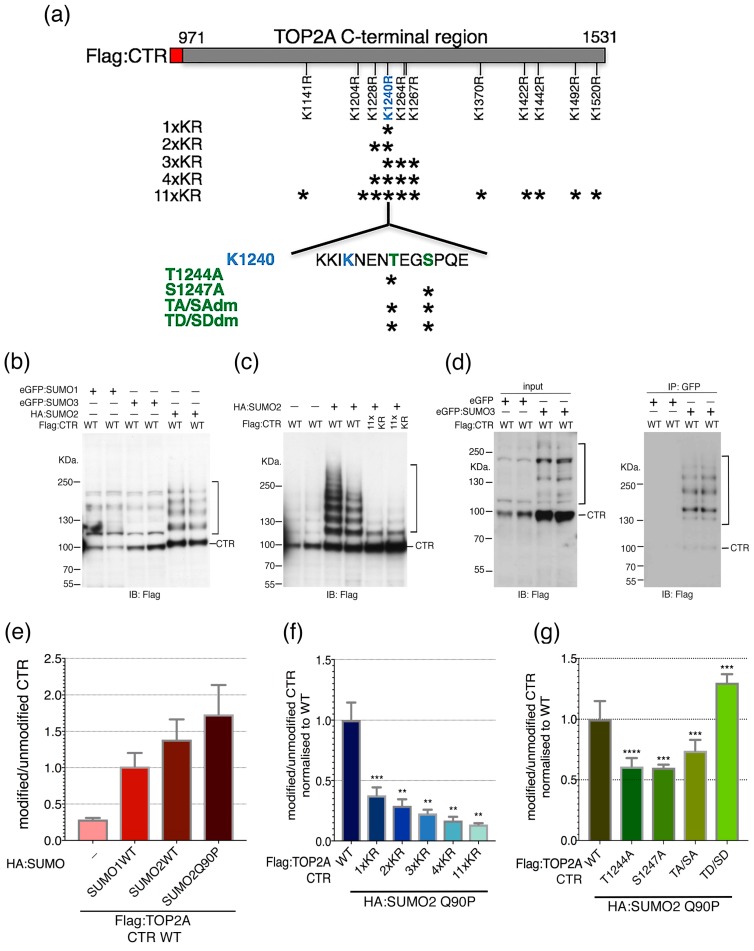
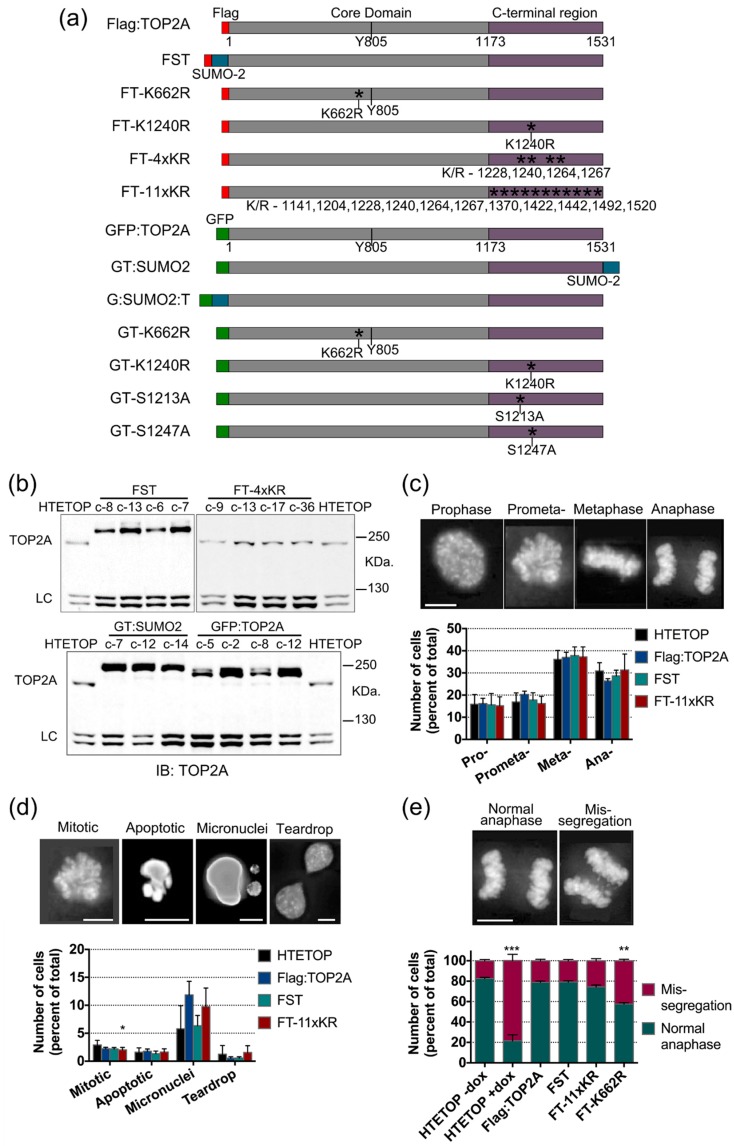
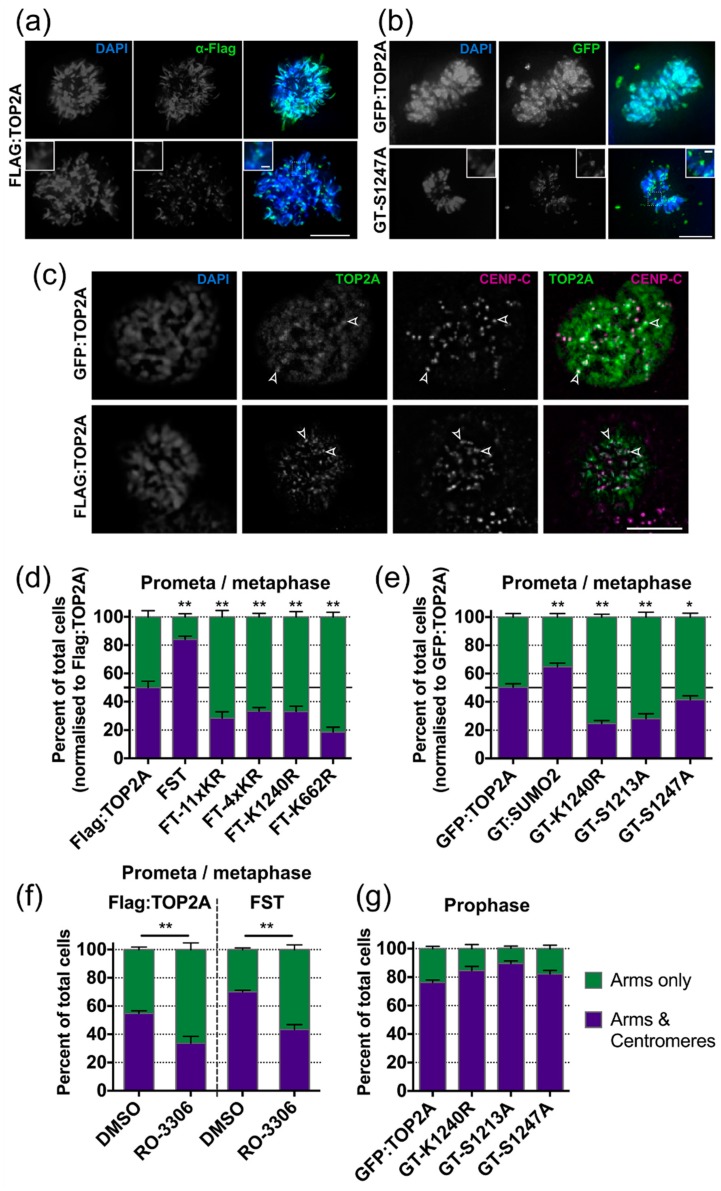
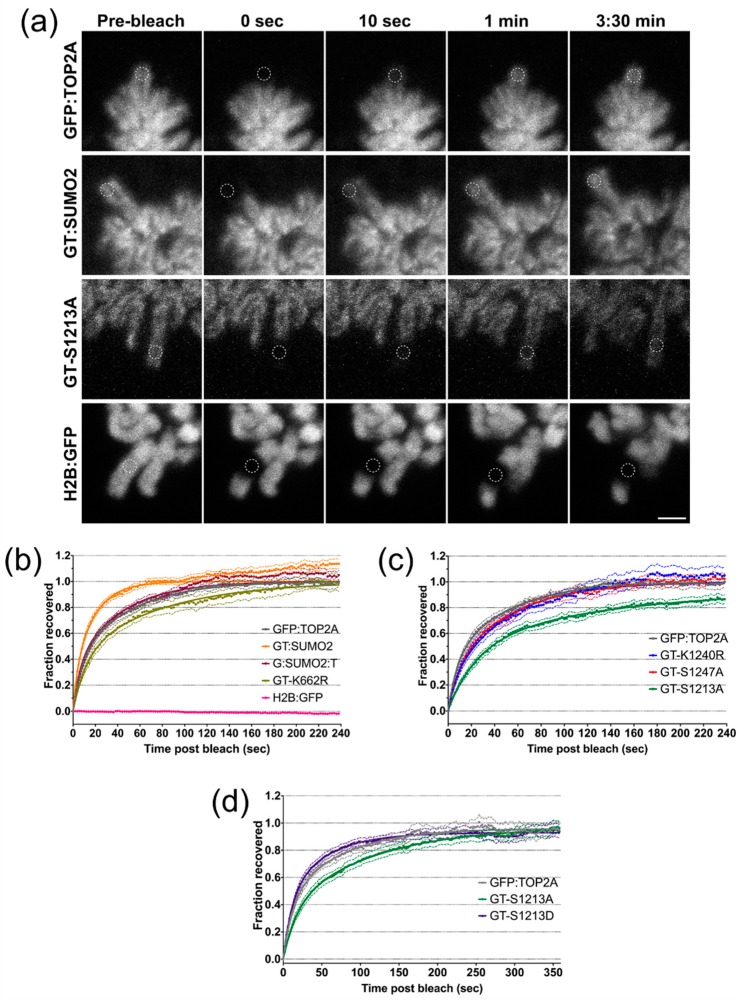
Type II topoisomerase enzymes are essential for resolving DNA topology problems arising through various aspects of DNA metabolism. In vertebrates two isoforms are present, one of which (TOP2A) accumulates on chromatin during mitosis. Moreover, TOP2A targets the mitotic centromere during prophase, persisting there until anaphase onset. It is the catalytically-dispensable C-terminal domain of TOP2 that is crucial in determining this isoform-specific behaviour. In this study we show that, in addition to the recently identified chromatin tether domain, several other features of the alpha-C-Terminal Domain (CTD). influence the mitotic localisation of TOP2A. Lysine 1240 is a major SUMOylation target in cycling human cells and the efficiency of this modification appears to be influenced by T1244 and S1247 phosphorylation. Replacement of K1240 by arginine results in fewer cells displaying centromeric TOP2A accumulation during prometaphase-metaphase. The same phenotype is displayed by cells expressing TOP2A in which either of the mitotic phosphorylation sites S1213 or S1247 has been substituted by alanine. Conversely, constitutive modification of TOP2A by fusion to SUMO2 exerts the opposite effect. FRAP analysis of protein mobility indicates that post-translational modification of TOP2A can influence the enzyme's residence time on mitotic chromatin, as well as its subcellular localisation.

Keywords: C-terminal domain; SUMO; centromere; chromosome; mitosis; phosphorylation; post-translational modification; topoisomerase II alpha.


Conflict of interest statement

The authors declare no conflict of interest.

Figures

Figure 1
Figure 1
The impact of internal deletions of the CTD on the mitotic localisation of TOP2A (a) Schematic of human TOP2A showing the domain structure: the N-terminal ATPase gate (consisting of the ATPase and transducer domains); the DNA-binding gate (consisting of the TOPRIM domain, the Winged Helix Domain (with the active site tyrosine 805) and the Tower domain); the C-gate (formed by the coiled-coil domain); and the unstructured C-Terminal Domain (CTD). Shown below are the internally deleted variants analysed. In each the terminal amino acids 1447–1531, which encompass the main nuclear localisation signal (NLS) and the chromatin tether domain (ChT) are retained. (b) Western blotting of whole cell lysates from HTETOP-derived transfectants stably expressing Flag-tagged TOP2A, either full length (FT) or internally deleted variants (FTΔ2, Δ3 and Δ5). The antigen recognised by the TOP2A isoform-specific antibody is retained in all variants. Transfectants have been grown in the presence or absence, of doxycycline. The full length untagged TOP2A protein (~170 KDa.) present in the parental HTETOP cells is transcribed under a tet-regulatable promoter and is suppressed by doxycycline, while the Flag-tagged versions of the protein (expressed under a CMV promoter) are unaffected (indicated by “>”). LC = an unidentified protein detected by the TOP2A antibody and described previously [45]. (c) Immunofluorescence localisation of the internally deleted forms of TOP2A in interphase and mitotic cells of stable transfectants, detected using an anti-Flag antibody (green), shown alongside cells expressing the Flag-tagged full length protein (FT). DNA has been counterstained with DAPI (blue). FT (Flag:TOP2A WT) and FTΔ3 cells are shown grown in the presence of dox (the localisation phenotypes were unchanged in the absence of dox/presence of untagged TOP2A WT protein). The FTΔ2 cells shown had been passaged in the absence of dox (long term growth in doxycycline is lethal). FTΔ5 cells grown in both the presence or absence, of dox are shown. This variant localises normally to the nucleus but its targeting of mitotic chromatin is perturbed. This disruption is especially severe in the presence of full length TOP2A protein, where the Flag-tagged variant appears largely cytosolic. Scale bar, 10 μm.
Figure 2
Figure 2
Assaying the biological importance of potential SUMO acceptor sites within the TOP2A C-terminal region (CTR) by Hek-293T transient transfection. (a) Schematic of residues tested within the TOP2A CTR. (b,c) Representative immunoblots probed with anti-Flag antibody. Whole cell extracts were prepared 24–48 h post-transfection and resolved on 3–8% Tris-Acetate gradient gels. (b) Cells were co-transfected with Flag:CTR and either eGFP:SUMO1/3 or HA:SUMO2. (c) Cells were co-transfected with HA:SUMO2 and either WT or 11xKR-substituted CTR. In (b,c) samples in paired lanes (e.g., lanes 1 & 2, 3 & 4, 5 & 6) were from independently transfected wells from the same experiment. (d) eGFP:SUMO (or eGFP alone) and Flag:CTR co-transfected samples were subjected to GFP immunoprecipitation and detected using anti-Flag antibody. Input cell lysates were resolved on an 8% Tris-Glycine SDS-PAGE gel and IP samples on a 3–8% Tris-Acetate gradient gel. The samples in paired lanes are duplicates. (e) Graph showing levels of HMW Flag:CTR products relative to the unmodified ~100 KDa. Flag:CTR in cells expressing endogenous SUMO only or various forms of HA:SUMO (SUMO1 WT, SUMO2 WT or SUMO2 Q90P). For each transient transfection multiple independent experiments were undertaken (n, 3–6). Errors bars represent s.e.m. (f) Effect of selected K/R substitutions on CTR SUMOylation levels following co-expression with HA:SUMO2 Q90P. Levels were assessed by fluorescence immunoblotting and quantitation of the HMW Flag:CTR ladder relative to the unmodified ~100 KDa CTR. The value for each K/R-substituted CTR was normalised against the mean WT CTR value (n8, un-matched). For each variant, multiple independent experiments were undertaken (n, 2–8), with multiple replicates of each sample analysed. (g) Effect of selected phosphosite mutations on CTR SUMOylation following co-expression with HA:SUMO2 Q90P. Levels were estimated by fluorescence immunoblotting and quantitation of the HMW Flag:CTR ladder relative to the unmodified ~100 KDa CTR. The value for each CTR variant was normalised against the WT CTR value from within the same experiment (matched). For each variant, multiple independent experiments were undertaken (n, 4–9), with multiple replicates of each sample analysed. In (f,g) Error bars represent s.e.m. Significance was calculated by performing an ANOVA analysis to compare all samples to WT with the P value corrected using the Holm-Sidak’s multiple comparisons test. **** p < 0.0001, *** p = 0.0001–0.001, ** p = 0.001–0.01.
Figure 3
Figure 3
Impact of TOP2A variants on mitotic progression and chromosome segregation. (a) Schematic showing the Flag- (red) and GFP (green)-tagged TOP2A variants studied in this work. (b) Representative immunoblots from HTETOP-derived transfectants stably expressing variant forms of TOP2A. Transfectants have been grown in the presence of doxycycline to repress the full length untagged TOP2A protein (~170 KDa) present in parental HTETOP cells. LC = an unidentified protein detected by the TOP2A antibody and described previously [45]. (c,d) Representative images and percentage of cells found at each stage of mitosis (c) and showing various nuclear phenotypes (d). Cells were scored by eye at 40× magnification. Three transfectant clones were tested for each variant and three independent experiments were performed. Approx. 500 mitotic cells and 1000 nuclei were scored per repeat. Slides were fixed in methanol and DNA stained with DAPI. Error bars represent standard error of the mean (s.e.m.). Significance was assessed by performing a one-way ANOVA analysis and post-hoc Tukey HSD test to compare lines to the HTETOP (-dox) control. (e) Representative images and percentage of cells, showing normal chromosome segregation and mis-segregation in anaphase. Cells were fixed in methanol and DNA stained with DAPI. Scale bar: 10 μm. Growth of the conditional null mutant line HTETOP in doxycycline for 48 h results in high levels of anaphase mis-segregation. Expressing Flag-tagged TOP2A in dox-treated HTETOP cells rescues the mis-segregation phenotype. Three transfectant clones were tested for each Flag-tagged variant. Three independent experiments performed with approx. 300 cells scored for each repeat. Error bars represent s.e.m. Significance was assessed by performing a one-way ANOVA to compare lines expressing the various Flag-tagged TOP2A variants to the HTETOP-dox control with the p value corrected using the post-hoc Tukey HSD analysis for multiple comparisons. *** p = 0.0001–0.001, ** p = 0.001–0.01, * p = 0.01–0.05.
Figure 4
Figure 4
TOP2A mitotic localisation phenotypes. (a) Representative images of the main TOP2A localisation patterns displayed in mitotic cells expressing Flag-tagged TOP2A (unmutated). Cells were fixed in formaldehyde (PTEMF) and stained using anti-Flag antibody (green). DNA was stained using DAPI (blue). Two main phenotypes were observed: staining along the chromosome arms only or on the arms together with more intense accumulation at centromeres. (b) Representative images of the main TOP2A localisation patterns displayed in mitotic cells expressing GFP-tagged TOP2A (unmutated and S1247A). Cells were fixed in methanol and GFP visualised directly (green). DNA was stained using DAPI (blue). Scale bars in (a,b): main image, 10 μm; inset 1 μm. (c) Immunofluorescence images showing co-localisation of punctateTOP2A signals with centromeres. Cells were fixed in formaldehyde (PTEMF) and stained using anti-TOP2A antibody (green) and anti-CENP-C antibody (magenta). DNA was stained using DAPI. The open arrowheads indicate examples of TOP2A and CENP-C co-localisation. Scale bar: 10 μm. (d) Graph of fixed prometaphase and metaphase cells showing the main TOP2A localisation patterns in stable cell lines expressing various Flag-tagged TOP2A forms. The value for each variant was normalised against the Flag:TOP2A (unmutated) from within the same experiment, with the WT value set as 50%. Three clones were analysed for each TOP2A variant, with three repeats performed for each clone and ~200 cells scored per repeat. Significance was estimated by one-way ANOVA to compare all lines to the Flag:TOP2A (unmutated) with the p value corrected using the post-hoc Tukey HSD analysis for multiple comparisons. Error bars represent s.e.m. (e) Graph of fixed prometaphase and metaphase cells showing the main TOP2A localisation patterns in stable cell lines expressing various forms of GFP-tagged TOP2A. Data collection and statistical analysis were performed as described for (d). (f) Graph showing the percentage of fixed prometaphase and metaphase cells showing the main TOP2A localisation patterns in Flag:TOP2A and FST cell lines one hour after release from overnight (18 h) treatment with the CDK1 inhibitor RO-3306 (or 0.1% DMSO alone). Two independent experiments (each consisting of two parallel replicates) were performed and ≥100 cells scored per sample. Error bars represent s.e.m. Significance was assessed by performing a Student’s t-test. (g) Graph showing the percentage of fixed prophase cells showing intense punctate centromeric TOP2A signals in stable cells lines expressing various GFP-tagged TOP2A forms. Prophase cells were identified on the basis of cyclin B1 staining. One clone was analysed for each TOP2A variant, with three repeats performed for each variant and ~100 cells scored per repeat. Error bars represent s.e.m. ** p = 0.001–0.01, * p = 0.01–0.05.
Figure 5
Figure 5
The mobility of TOP2A on mitotic chromatin. (a) Still images from FRAP movies showing the last frame before bleaching (Pre-bleach), the first frame post-bleach (0 s) and three frames showing progress of recovery at the indicated timepoints. The white dashed line indicates the circular region that has been bleached. Representative images shown for the GFP:TOP2A, GT:SUMO2 and GT-S1213A cell lines respectively. Also included is a cell line expressing H2B:GFP. Scale bar: 2 μm. (bd) FRAP recovery plots. Normalised mean recovery for the cell lines indicated. Three independent replicates were performed per cell line, with at least 5 movies analysed per replicate. Error bars representing s.e.m. are shown around each recovery curve.

References

    1. Vos S.M., Tretter E.M., Schmidt B.H., Berger J.M. All tangled up: How cells direct, manage and exploit topoisomerase function. Nat. Rev. Mol. Cell Biol. 2011;12:827–841. doi: 10.1038/nrm3228. - DOI - PMC - PubMed
    1. Roca J. Topoisomerase II: A fitted mechanism for the chromatin landscape. Nucleic Acids Res. 2009;37:721–730. doi: 10.1093/nar/gkn994. - DOI - PMC - PubMed
    1. Higgins N.P. A human TOP2A core DNA binding X-ray structure reveals topoisomerase subunit dynamics and a potential mechanism for SUMO modulation of decatenation. J. Mol. Biol. 2012;424:105–108. doi: 10.1016/j.jmb.2012.10.002. - DOI - PubMed
    1. Wendorff T.J., Schmidt B.H., Heslop P., Austin C.A., Berger J.M. The structure of DNA-bound human topoisomerase II alpha: Conformational mechanisms for coordinating inter-subunit interactions with DNA cleavage. J. Mol. Biol. 2012;424:109–124. doi: 10.1016/j.jmb.2012.07.014. - DOI - PMC - PubMed
    1. Schmidt B.H., Osheroff N., Berger J.M. Structure of a topoisomerase II-DNA-nucleotide complex reveals a new control mechanism for ATPase activity. Nat. Struct. Mol. Biol. 2012;19:1147–1154. doi: 10.1038/nsmb.2388. - DOI - PMC - PubMed

MeSH terms

Substances