

HIV Replication in Humanized IL-3/GM-CSF-Transgenic NOG Mice
- PMID: 30871027
- PMCID: PMC6470732
- DOI: 10.3390/pathogens8010033
HIV Replication in Humanized IL-3/GM-CSF-Transgenic NOG Mice
Abstract
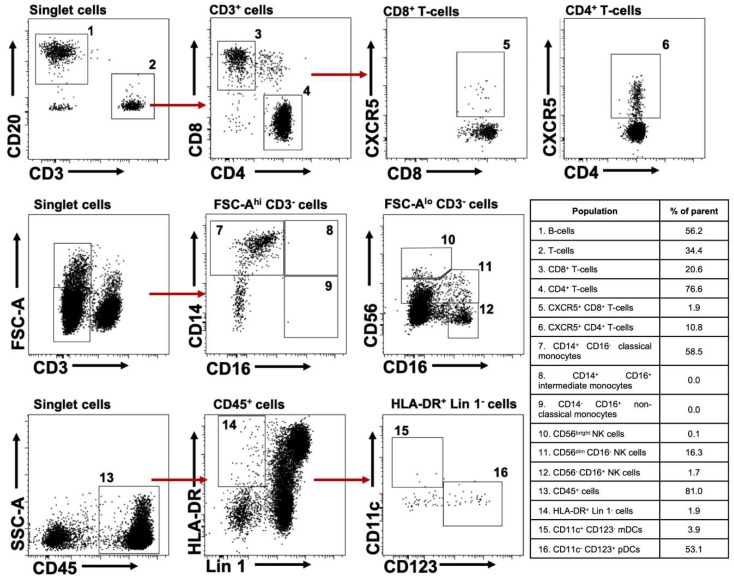
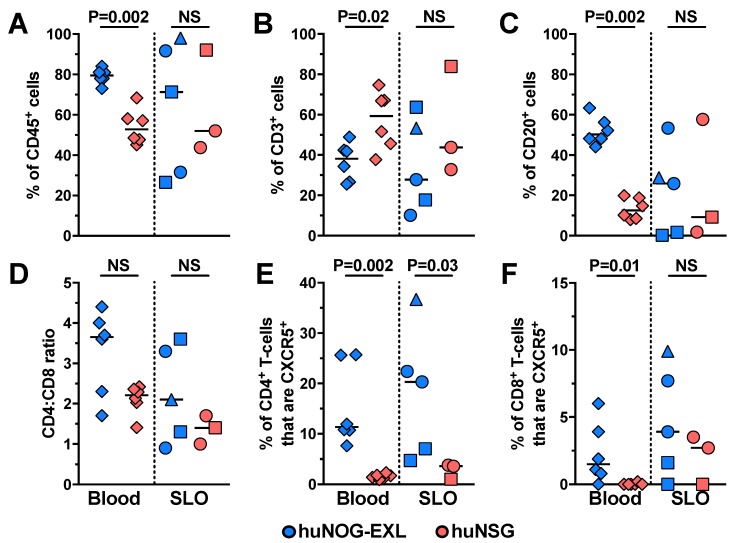
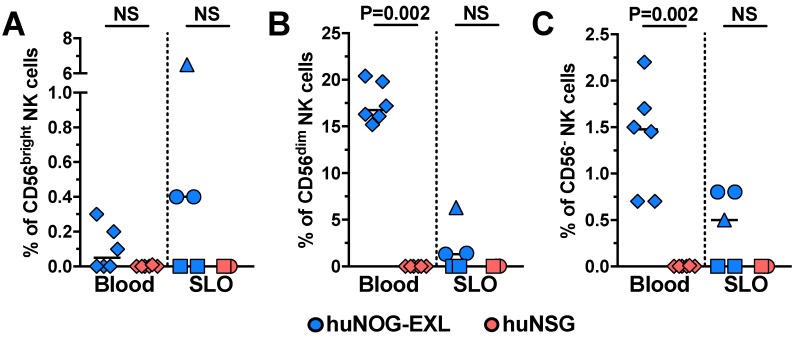
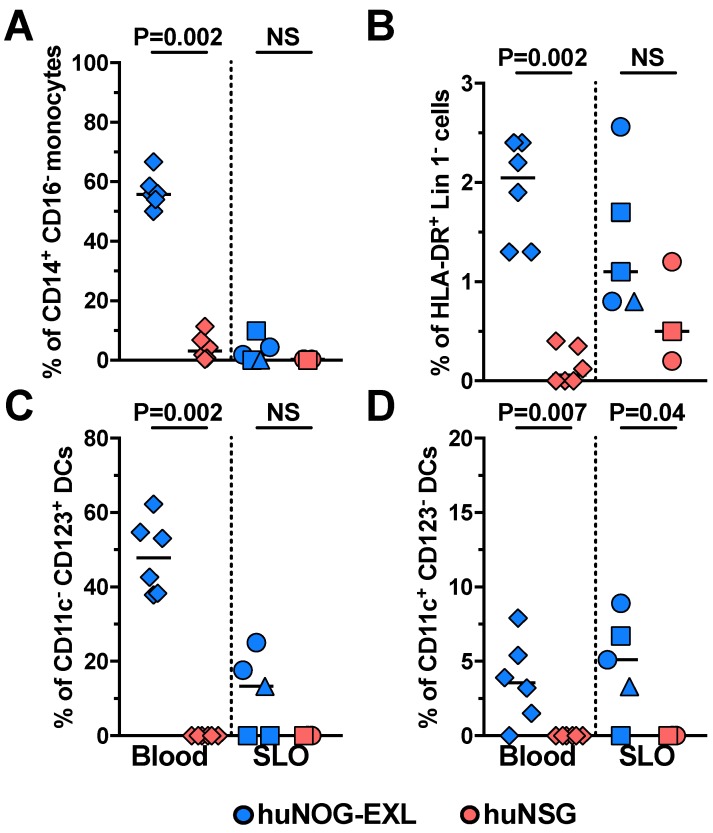
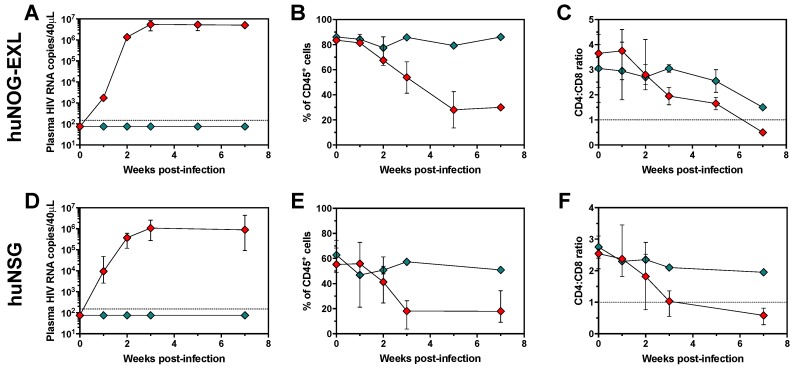
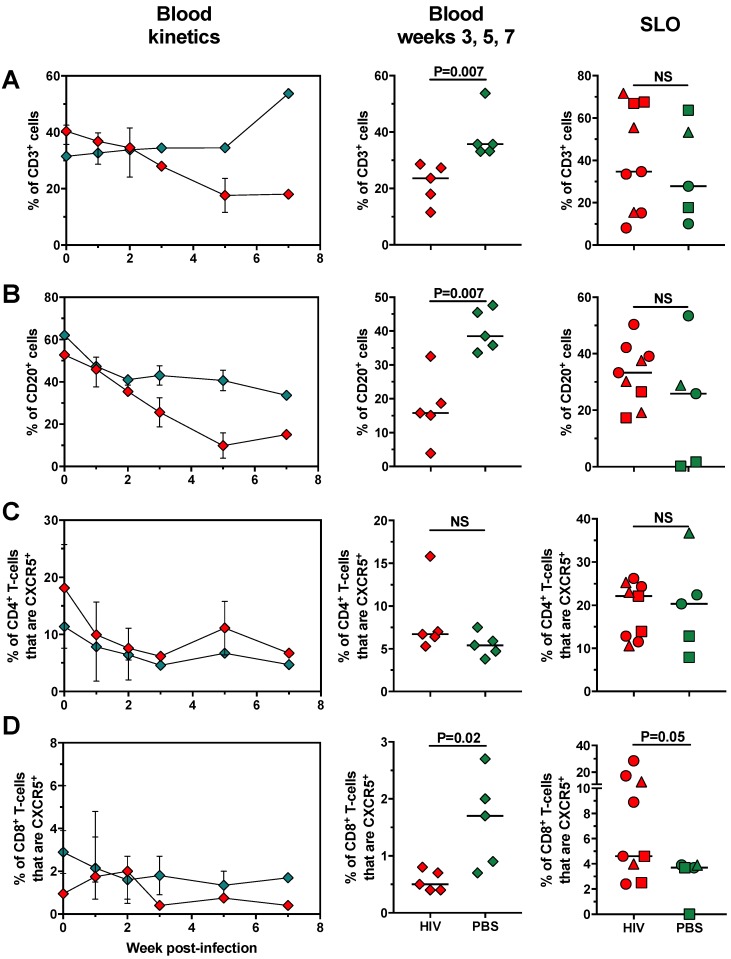
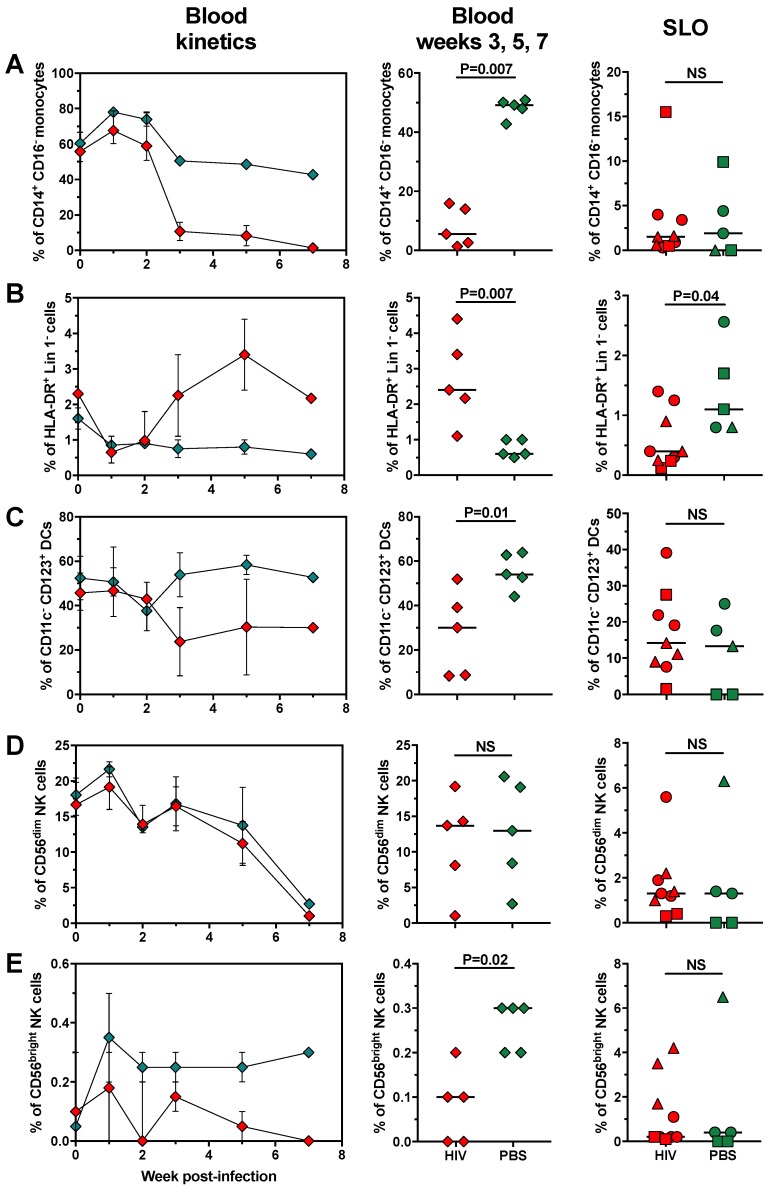
The development of mouse models that mimic the kinetics of Human Immunodeficiency Virus (HIV) infection is critical for the understanding of the pathogenesis of disease and for the design of novel therapeutic strategies. Here, we describe the dynamics of HIV infection in humanized NOD/Shi-scid-IL2rγnull (NOG) mice bearing the human genes for interleukin (IL)-3 and granulocyte-macrophage colony-stimulating factor (GM-CSF) (NOG-EXL mice). The kinetics of viral load, as well as the frequencies of T-cells, B-cells, Natural killer cells (NK), monocytes, and dendritic cells in blood and secondary lymphoid organs were evaluated throughout the time of infection. In comparison with a non-transgenic humanized mouse (NSG) strain, lymphoid and myeloid populations were more efficiently engrafted in humanized NOG-EXL mice, both in peripheral blood and lymphoid tissues. In addition, HIV actively replicated in humanized NOG-EXL mice, and infection induced a decrease in the percentage of CD4⁺ T-cells, inversion of the CD4:CD8 ratio, and changes in some cell populations, such as monocytes and dendritic cells, that recapitulated those found in human natural infection. Thus, the humanized IL-3/GM-CSF-transgenic NOG mouse model is suitable for the study of the dynamics of HIV infection and provides a tool for basic and preclinical studies.
Keywords: GM-CSF; HIV; Humanized mice (huNOG or huNOG-EXL); IL-3; NOG mice.
Conflict of interest statement
The authors declare no conflict of interest. The funders had no role in the design of the study; in the collection, analyses, or interpretation of data; in the writing of the manuscript, or in the decision to publish the results.
Figures
Similar articles
-
The Tumor Milieu Promotes Functional Human Tumor-Resident Plasmacytoid Dendritic Cells in Humanized Mouse Models.Front Immunol. 2020 Sep 8;11:2082. doi: 10.3389/fimmu.2020.02082. eCollection 2020. Front Immunol. 2020. PMID: 33013879 Free PMC article.
-
Human GM-CSF/IL-3 enhance tumor immune infiltration in humanized HCC patient-derived xenografts.JHEP Rep. 2024 Nov 8;7(3):101264. doi: 10.1016/j.jhepr.2024.101264. eCollection 2025 Mar. JHEP Rep. 2024. PMID: 40028346 Free PMC article.
-
Human GM-CSF/IL-3 enhance tumor immune infiltration in humanized HCC patient-derived xenografts.bioRxiv [Preprint]. 2024 Oct 31:2023.10.05.561117. doi: 10.1101/2023.10.05.561117. bioRxiv. 2024. Update in: JHEP Rep. 2024 Nov 08;7(3):101264. doi: 10.1016/j.jhepr.2024.101264. PMID: 39554038 Free PMC article. Updated. Preprint.
-
NOD/Shi-scid IL2rgamma(null) (NOG) mice more appropriate for humanized mouse models.Curr Top Microbiol Immunol. 2008;324:53-76. doi: 10.1007/978-3-540-75647-7_3. Curr Top Microbiol Immunol. 2008. PMID: 18481452 Review.
-
Current humanized mouse models for studying human immunology and HIV-1 immuno-pathogenesis.Sci China Life Sci. 2010 Feb;53(2):195-203. doi: 10.1007/s11427-010-0059-7. Epub 2010 Mar 7. Sci China Life Sci. 2010. PMID: 20596827 Free PMC article. Review.
Cited by
-
The Hematology of Tomorrow Is Here-Preclinical Models Are Not: Cell Therapy for Hematological Malignancies.Cancers (Basel). 2022 Jan 24;14(3):580. doi: 10.3390/cancers14030580. Cancers (Basel). 2022. PMID: 35158848 Free PMC article. Review.
-
Humanized mouse models for preclinical evaluation of HIV cure strategies.AIDS Rev. 2022 Oct 25;24(3):139-151. doi: 10.24875/AIDSRev.22000013. AIDS Rev. 2022. PMID: 35622983 Free PMC article. Review.
-
Advances in Humanized Mouse Models to Improve Understanding of HIV-1 Pathogenesis and Immune Responses.Front Immunol. 2021 Mar 5;11:617516. doi: 10.3389/fimmu.2020.617516. eCollection 2020. Front Immunol. 2021. PMID: 33746940 Free PMC article. Review.
-
Humanized mouse model: a review on preclinical applications for cancer immunotherapy.Am J Cancer Res. 2020 Dec 1;10(12):4568-4584. eCollection 2020. Am J Cancer Res. 2020. PMID: 33415020 Free PMC article. Review.
-
Recent Advances in Allergy Research Using Humanized Mice.Int J Mol Sci. 2019 Jun 4;20(11):2740. doi: 10.3390/ijms20112740. Int J Mol Sci. 2019. PMID: 31167385 Free PMC article. Review.
References
-
- Billerbeck E., Barry W.T., Mu K., Dorner M., Rice C.M., Ploss A. Development of human CD4+FoxP3+ regulatory T cells in human stem cell factor-, granulocyte-macrophage colony-stimulating factor-, and interleukin-3-expressing NOD-SCID IL2R??null humanized mice. Blood. 2011;117:3076–3086. doi: 10.1182/blood-2010-08-301507. - DOI - PMC - PubMed
LinkOut - more resources
Full Text Sources
Research Materials
