. 2019 Mar 12;20(5):1242.
doi: 10.3390/ijms20051242.

Increased iNOS and Nitrosative Stress in Dopaminergic Neurons of MDMA-Exposed Rats

Affiliations

Increased iNOS and Nitrosative Stress in Dopaminergic Neurons of MDMA-Exposed Rats

Stefania Schiavone et al. Int J Mol Sci. .

Abstract

Several mechanisms underlying 3,4-Methylenedioxy-N-methylamphetamine (MDMA) neurotoxicity have been proposed, including neurochemical alterations and excitotoxicity mediated by reactive oxygen species (ROS), nitric oxide (NO), and reactive nitrogen species (RNS). However, ROS, NO, and RNS sources in the brain are not fully known. We aimed to investigate possible alterations in the expression of the ROS producer NOX enzymes (NOX2, NOX1, and NOX4), NO generators (iNOS, eNOS, and nNOS), markers of oxidative (8-hydroxy-2'-deoxyguanosine, 8OHdG), and nitrosative (3-nitrotyrosine, NT) stress, as well as the colocalization between cells positive for the dopamine transporter (DT1) and cells expressing the neuronal nuclei (NeuN) marker, in the frontal cortex of rats receiving saline or MDMA, sacrificed 6 h, 16 h, or 24 h after its administration. MDMA did not affect NOX2, NOX1, and NOX4 immunoreactivity, whereas iNOS expression was enhanced. The number of NT-positive cells was increased in MDMA-exposed animals, whereas no differences were detected in 8OHdG expression among experimental groups. MDMA and NT markers colocalized with DT1 positive cells. DT1 immunostaining was found in NeuN-positive stained cells. Virtually no colocalization was observed with microglia and astrocytes. Moreover, MDMA immunostaining was not found in NOX2-positive cells. Our results suggest that iNOS-derived nitrosative stress, but not NOX enzymes, may have a crucial role in the pathogenesis of MDMA-induced neurotoxicity, highlighting the specificity of different enzymatic systems in the development of neuropathological alterations induced by the abuse of this psychoactive compound.

Keywords: MDMA; NADPH oxidases; iNOS; nitrosative stress; oxidative stress.


Conflict of interest statement

The authors declare no conflict of interest.

Figures

Figure 1
Figure 1
Nicotinamide adenine dinucleotide phosphate (NADPH) oxidase immunoreactivity is not affected by 3,4-Methylenedioxy-N-methylamphetamine (MDMA) administration. (AD) Representative images (light microscopy, 40×) of NOX2 immunoreactivity in the frontal cortex of rats receiving (A) saline (controls = CTRL) and of rats receiving MDMA and sacrificed after (B) 6 h, (C) 16 h, and (D) 24 h from its administration. (EH) Representative images (light microscopy, 40×) of NOX1 immunoreactivity in the frontal cortex of rats receiving (E) saline (CTRL) and of rats receiving MDMA and sacrificed after (F) 6 h, (G) 16 h, and (H) 24 h from its administration. (IL) Representative images (light microscopy, 40×) of NOX4 immunoreactivity in the frontal cortex of rats receiving (I) saline (CTRL) and of rats receiving MDMA and sacrificed after (J) 6 h, (K) 16 h, and (L) 24 h from its administration. Scale bar for images in panels (AL) = 50 μm. (MO) Quantification of (M) NOX2, (N) NOX1, and (O) NOX4 positive-stained cells/area analyzed in controls (CTRL) and MDMA-exposed rats, sacrificed after 6 h, 16 h, and 24 h from its administration. One-way ANOVA followed by Tukey’s post-hoc test. For NOX2: F = 2.281, p ˃ 0.05; for NOX1: F = 0.9608, p ˃ 0.05; for NOX4: F = 1.333, p ˃ 0.05.
Figure 2
Figure 2
Inducible nitric oxide synthase (iNOS) immunoreactivity is increased following MDMA administration. (AD) Representative images (light microscopy, 40×) of iNOS immunoreactivity in the frontal cortex of rats receiving (A) saline (CTRL) and of rats receiving MDMA and sacrificed after (B) 6 h, (C) 16 h, and (D) 24 h from its administration. (EH) Representative images (light microscopy, 40×) of endothelial nitric oxide synthase (eNOS) immunoreactivity in the frontal cortex of rats receiving (E) saline (CTRL) and of rats receiving MDMA and sacrificed after (F) 6 h, (G) 16 h, and (H) 24 h from its administration. (IL) Representative images (light microscopy, 40×) of neuronal nitric oxide synthase (nNOS) immunoreactivity in the frontal cortex of rats receiving (I) saline (CTRL) and of rats receiving MDMA and sacrificed after (J) 6 h, (K) 16 h, and (L) 24 h from its administration. Scale bar for images in panels (AL) = 50 μm. (MO) Quantification of (M) iNOS, (N) eNOS, and (O) nNOS positive-stained cells/area analyzed in controls (CTRL) and MDMA-exposed rats, sacrificed after 6 h, 16 h, and 24 h from its administration. One-way ANOVA followed by Tukey’s post-hoc test. For iNOS: F = 9.090, *** p < 0.001 6 h vs. CTRL, ** p < 0.01 16 h vs. CTRL and 24 h vs. CTRL, p ˃ 0.05 6 h vs. 16 h, 6 h vs. 24 h, and 16 h vs. 24 h; for eNOS: F = 0.7276, p ˃ 0.05; for nNOS: F = 1.290, p ˃ 0.05.
Figure 3
Figure 3
3-nitrotyrosine (NT) immunoreactivity is increased following MDMA administration. (AD) Representative images (light microscopy, 40×) of 8-hydroxy-2′-deoxyguanosine (8OHdG) immunoreactivity in the frontal cortex of rats receiving (A) saline (CTRL) and of rats receiving MDMA and sacrificed after (B) 6 h, (C) 16 h, and (D) 24 h from its administration. (EH) Representative images (light microscopy, 40×) of NT immunoreactivity in the frontal cortex of rats receiving (E) saline (CTRL) and of rats receiving MDMA and sacrificed after (F) 6 h, (G) 16 h, and (H) 24 h from its administration. Scale bar for images in panels (AH) = 50 μm. (IJ) Quantification of (I) 8OHdG and (J) NT positive-stained cells/area analyzed in controls (CTRL) and MDMA-exposed rats, sacrificed after 6 h, 16 h, and 24 h from its administration. One-way ANOVA followed by Tukey’s post-hoc test. For 8OHdG: F = 3.141, p ˃ 0.05; for NT: F = 9.471, *** p < 0.001 6 h vs. CTRL, ** p < 0.01 16 h vs. CTRL and 24 h vs. CTRL, p ˃ 0.05 6 h vs. 16 h, 6 h vs. 24 h, and 16 h vs. 24 h.
Figure 4
Figure 4
MDMA and NT colocalized with dopamine transporter (DT1). (A,B) Representative images (light microscopy, 40×) of MDMA/DT1 double immunostaining in the frontal cortex of rats receiving (A) saline (CTRL) and of rats receiving (B) MDMA (MDMA-exposed, sacrificed after 6 h). (C) Blown-up image of the dotted area highlighted in (B). (D,E) Representative images (light microscopy, 40×) of NT/DT1 double immunostaining in the frontal cortex of rats receiving (D) saline (CTRL) and in rats receiving (E) MDMA (MDMA-exposed, sacrificed after 6 h). (F) Blown-up image of the dotted area highlighted in (E). Scale bar for images in (A,B,D,E) = 50 μm. (GI) Representative images (light microscopy, 40×) of DT1 (G-red staining)/NeuN (H-green staining) immunofluorescence and merged images with 4′, 6-diamidino-2-phenylindole (DAPI) (I-blue staining) in the frontal cortex. Scale bar for images in (GI) = 100 μm. Arrows indicate a representative DT1/NeuN double-stained cell.
Figure 5
Figure 5
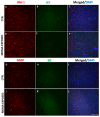
MDMA immunofluorescence is not present in microglia and astrocytes. (AF) Representative immunofluorescence images (light microscopy, 40×) of ionized calcium-binding adapter molecule 1 (IBA-1) (red staining)/MDMA (green staining) and merged images with DAPI (blue staining) in the frontal cortex of (AC) saline-exposed (CTRL) and (DF) MDMA-exposed (sacrificed after 6 h from its administration) rats. (GL) Representative immunofluorescence images (light microscopy, 40×) of glial fibrillary acidic protein (GFAP) (red staining)/MDMA (green staining) and merged images with DAPI (blue staining) in the frontal cortex of (GI) saline-exposed (CTRL) and (JL) MDMA-exposed (sacrificed after 6 h from its administration) rats. Scale bar for images in panels (AL) = 100 μm.
Figure 6
Figure 6
NT immunofluorescence is not present in microglia and astrocytes. (AF) Representative immunofluorescence images (light microscopy, 40×) of IBA-1 (red staining)/NT (green staining) and merged images with DAPI (blue staining) in the frontal cortex of (AC) saline-exposed (CTRL) and (DF) MDMA-exposed (sacrificed after 6 h from its administration) rats. (GL) Representative immunofluorescence images (light microscopy, 40×) of GFAP (red staining)/NT (green staining) and merged images with DAPI (blue staining) in the frontal cortex of (GI) saline-exposed (CTRL) and (JL) MDMA-exposed (sacrificed after 6 h from its administration) rats. Scale bar for images in panels (AL) = 100 μm.
Figure 7
Figure 7
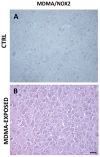
MDMA staining does not colocalize with NOX2 immunoreactivity. (A,B) Representative images (light microscopy, 40×) of MDMA/NOX2 double immunostaining in the frontal cortex of rats receiving (A) saline (CTRL) and of rats receiving (B) MDMA (sacrificed after 6 h from its administration). Scale bar for images in panels (A,B) = 50 μm.

Similar articles

Cited by

References

    1. Michael W.C. How MDMA’s pharmacology and pharmacokinetics drive desired effects and harms. J. Clin. Pharmacol. 2014;54:245–252. doi: 10.1002/jcph.266. - DOI - PubMed
    1. Parrott A.C. Human psychobiology of MDMA or ‘Ecstasy’: An overview of 25 years of empirical research. Hum. Psychopharmacol. 2013;28:289–307. doi: 10.1002/hup.2318. - DOI - PubMed
    1. Parrott A.C. Human research on MDMA (3,4-methylene-dioxymethamphetamine) neurotoxicity: Cognitive and behavioural indices of change. Neuropsychobiology. 2000;42:17–24. doi: 10.1159/000026666. - DOI - PubMed
    1. Halpin L.E., Collins S.A., Yamamoto B.K. Neurotoxicity of methamphetamine and 3,4-methylenedioxymethamphetamine. Life Sci. 2014;97:37–44. doi: 10.1016/j.lfs.2013.07.014. - DOI - PMC - PubMed
    1. Benningfield M.M., Cowan R.L. Brain serotonin function in MDMA (ecstasy) users: Evidence for persisting neurotoxicity. Neuropsychopharmacology. 2013;38:253–255. doi: 10.1038/npp.2012.178. - DOI - PMC - PubMed

MeSH terms

Substances