. 2019 Mar 13;11(3):612.
doi: 10.3390/nu11030612.

Association of Protein Intake in Three Meals with Muscle Mass in Healthy Young Subjects: A Cross-Sectional Study

Affiliations

Association of Protein Intake in Three Meals with Muscle Mass in Healthy Young Subjects: A Cross-Sectional Study

Jun Yasuda et al. Nutrients. .

Abstract

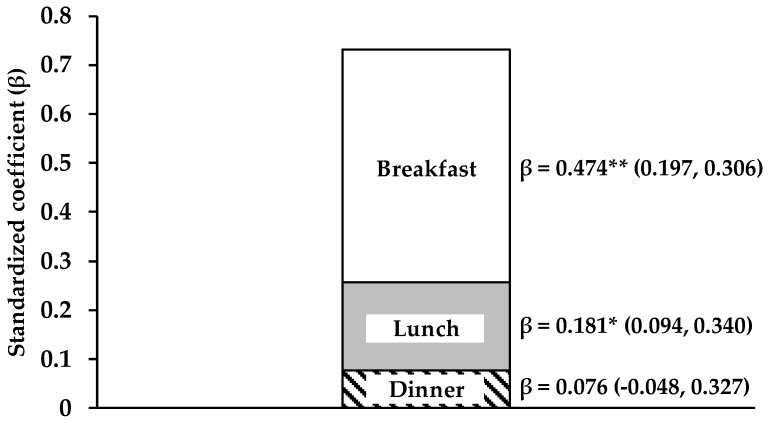
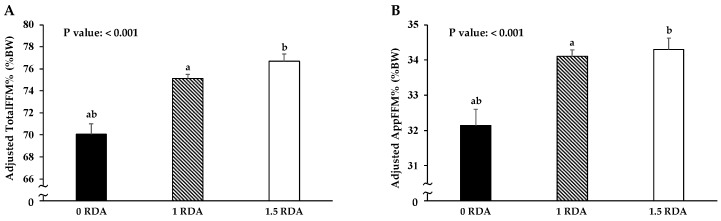
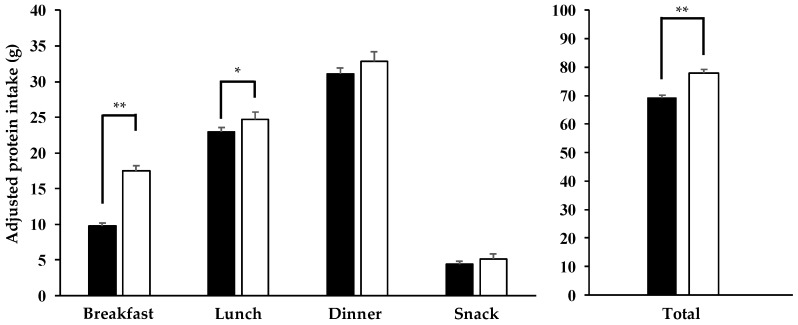
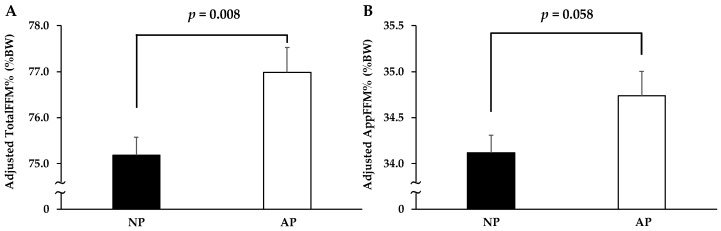
Protein intake of >0.24 g/kg of body weight (BW) at a single meal is necessary to maximize muscle protein synthesis in a young population. However, the association between the protein intake rate for three meals and muscle mass in the young population has not been evaluated. We hypothesized that a protein intake of >0.24 g/kg BW at all three meals is effective for maintaining muscle mass. Therefore, we cross-sectionally examined the association between protein intake at all three meals with muscle mass in 266 healthy young subjects (aged 21.4 ± 2.4 years). Subjects were divided into the AP group, which achieved protein intake >0.24 g/kg BW at all three meals; and the NP group, which did not. We calculated total fat-free mass (FFM) and appendicular fat-free mass (AppFFM) with dual-energy X-ray absorptiometry, and the percentage of total FFM (TotalFFM%) and appendicular FFM (AppFFM%) were calculated as the percentage of BW (%BW). We demonstrated that TotalFFM% (77.0 ± 0.5 vs. 75.2 ± 0.4%, p = 0.008) and AppFFM% (34.7 ± 0.3 vs. 34.1 ± 0.2%, p = 0.058) were higher in the AP than in the NP group. This finding suggests that achieving protein intake of >0.24 g/kg BW at all three meals is important for muscle mass maintenance in young populations.

Keywords: DXA; appendicular fat-free mass; cross-sectional study; dietary records; dual-energy X-ray absorptiometry; fat-free mass; muscle mass; protein intake; young subjects.


Conflict of interest statement

The authors declare no conflict of interest. The funders had no role in the design of the study; in the collection, analyses, or interpretation of data; in the writing of the manuscript, or in the decision to publish the results.

Figures

Figure 1
Figure 1
Contribution of achieving 0.24 g/kg BW of protein intake at each meal to total protein intake in all subjects. Multivariate regression analysis was used to examine the association of achieving 0.24 g/kg BW of protein intake at breakfast, lunch, and dinner (0: not achieved, 1: achieved, respectively) with total protein intake. Standardized coefficient (β) was obtained with adjustment for age, sex, drinking habit, smoking habit, living condition (alone or family), PSQI, MEQ, and IPAQ scores, and total energy intake with residual methods 7. *: p < 0.05, **: p < 0.001. Abbreviations: BW, Body Weight; PSQI, Pittsburgh Sleep Quality Index; MEQ, Morningness–Eveningness Questionnaire; IPAQ, International Physical Activity Questionnaire.
Figure 2
Figure 2
Comparisons of adjusted body compositions among the three groups (■: 0 RDA group, <0.9 g/kg BW, n = 30; ▧: 1 RDA group, 0.9–1.34 g/kg BW, n = 174; ☐: 1.5 RDA group, ≥ 1.35 g/kg BW/day of total protein intake, n = 62) in (A) adjusted TotalFFM% and (B) adjusted AppFFM%. Values are expressed as means ± SE, and adjusted for age, sex, drinking habit, smoking habit, living condition (alone or with family), PSQI, MEQ, and IPAQ scores, and total energy intake with residual methods [7] (post hoc analysis with Bonferroni correction; the same letters (a and b) indicating significant difference, p < 0.001). Abbreviations: RDA, recommended dietary allowance; BW, Body Weight; TotalFFM, total fat-free mass; AppFFM, appendicular fat-free mass; BW, body weight; PSQI, Pittsburgh Sleep Quality Index; MEQ, Morningness–Eveningness Questionnaire; IPAQ, International Physical Activity Questionnaire.
Figure 3
Figure 3
Adjusted protein intake at each meal and in total between the AP (☐: n = 83) and NP (■: n = 153) groups. AP group, achieving over 0.24 g/kg BW of protein intake at all three meals; NP group, not achieving 0.24 g/kg BW of protein intake from at least one meal. Values are expressed as means ± SE, and adjusted for age, sex, drinking habit, smoking habit, living condition (alone or with family), PSQI, MEQ, and IPAQ scores, and total energy intake with residual methods [7]. *: p < 0.05, **: p < 0.001. Abbreviations: BW, Body Weight; PSQI, Pittsburgh Sleep Quality Index; MEQ, Morningness–Eveningness Questionnaire; IPAQ, International Physical Activity Questionnaire.
Figure 4
Figure 4
Comparisons of adjusted body compositions between AP (☐: n = 83) and NP (■: n = 153) groups with total protein intake more than RDA. After adjusting energy intake with residual methods 7, the subjects were separated into the two groups: the AP group, achieving over 0.24 g/kg BW of protein intake at all three meals; and the NP group, not achieving 0.24 g/kg BW of protein intake in at least one meal. Values are expressed as means ± SE, and adjusted for age, sex, drinking habit, smoking habit, living condition (alone or family), PSQI, MEQ, and IPAQ scores. Abbreviations: RDA, recommended dietary allowance; BW, Body Weight; PSQI, Pittsburgh Sleep Quality Index; MEQ, Morningness–Eveningness Questionnaire; IPAQ, International Physical Activity Questionnaire.

References

    1. Scott D., Park M.S., Kim T.N., Ryu J.Y., Hong H.C., Yoo H.J., Baik S.H., Jones G., Choi K.M. Associations of low muscle mass and the metabolic syndrome in Caucasian and Asian middle-aged and older Adults. J. Nutr. Health Aging. 2016;20:248–255. doi: 10.1007/s12603-015-0559-z. - DOI - PubMed
    1. Son J.W., Lee S.S., Kim S.R., Yoo S.J., Cha B.Y., Son H.Y., Cho N.H. Low muscle mass and risk of type 2 diabetes in middle-aged and older adults: Findings from the KoGES. Diabetologia. 2017;60:865–872. doi: 10.1007/s00125-016-4196-9. - DOI - PubMed
    1. Shimokata H., Ando F., Yuki A., Otsuka R. Age-related changes in skeletal muscle mass among community-dwelling Japanese: A 12-year longitudinal study. Geriatr. Gerontol. Int. 2014;14(Suppl. 1):85–92. doi: 10.1111/ggi.12219. - DOI - PubMed
    1. Abe T., Dankel S.J., Buckner S.L., Jessee M.B., Mattocks K.T., Mouser J.G., Bell Z.W., Loenneke J.P. Differences in 100-m sprint performance and skeletal muscle mass between elite male and female sprinters. J. Sports Med. Phys. Fit. 2018 doi: 10.23736/S0022-4707.18.08267-1. - DOI - PubMed
    1. Mujika I., Ronnestad B.R., Martin D.T. Effects of increased muscle strength and muscle mass on endurance-cycling performance. Int. J. Sports Physiol. Perform. 2016;11:283–289. doi: 10.1123/ijspp.2015-0405. - DOI - PubMed

Substances