. 2019 Mar 13;20(6):1268.
doi: 10.3390/ijms20061268.

Key Maize Drought-Responsive Genes and Pathways Revealed by Comparative Transcriptome and Physiological Analyses of Contrasting Inbred Lines

Affiliations

Key Maize Drought-Responsive Genes and Pathways Revealed by Comparative Transcriptome and Physiological Analyses of Contrasting Inbred Lines

Tinashe Zenda et al. Int J Mol Sci. .

Abstract

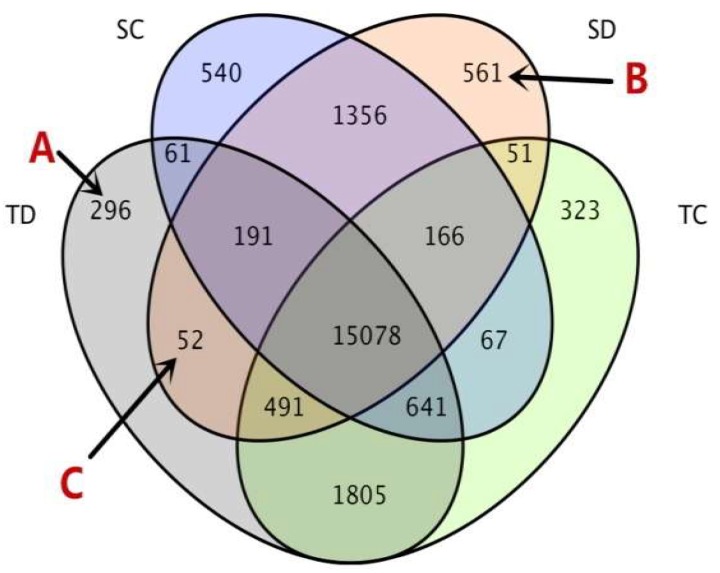
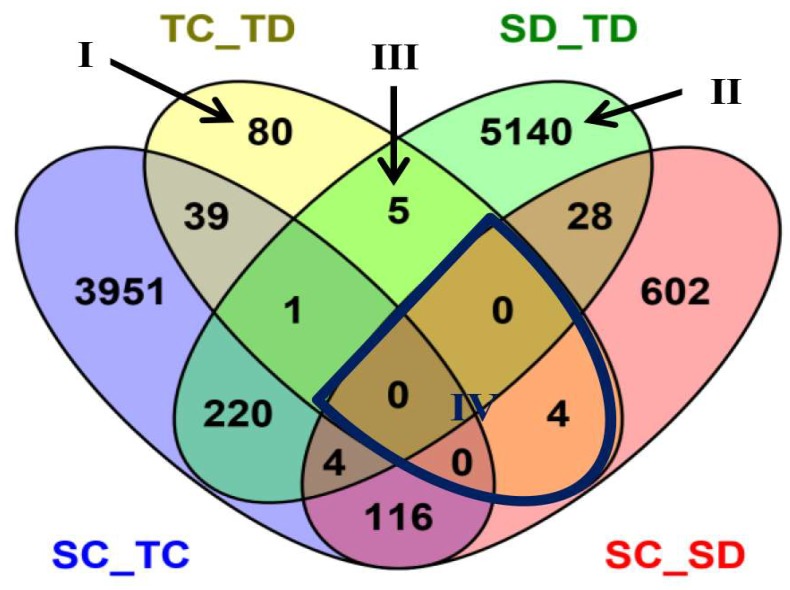
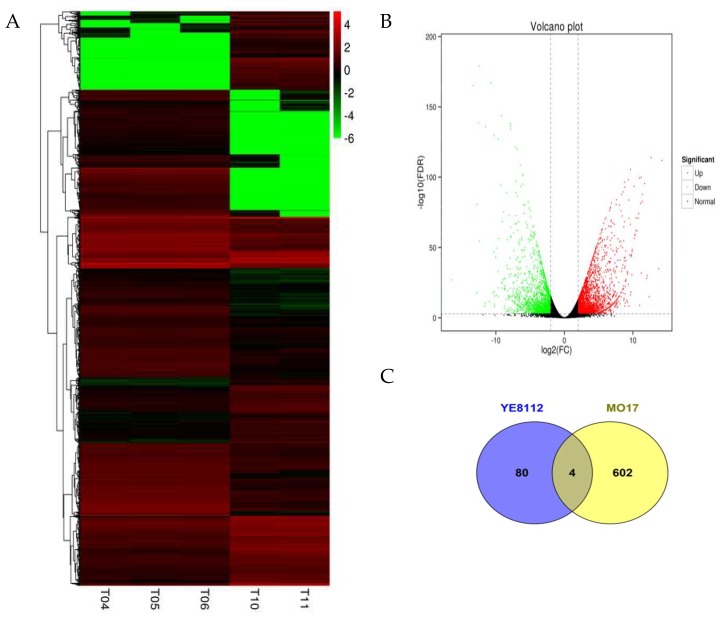
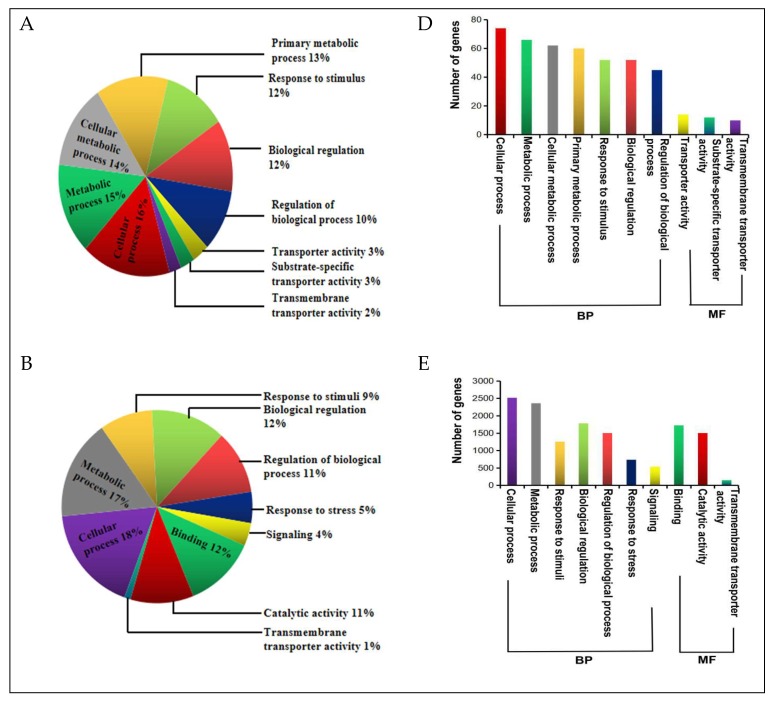
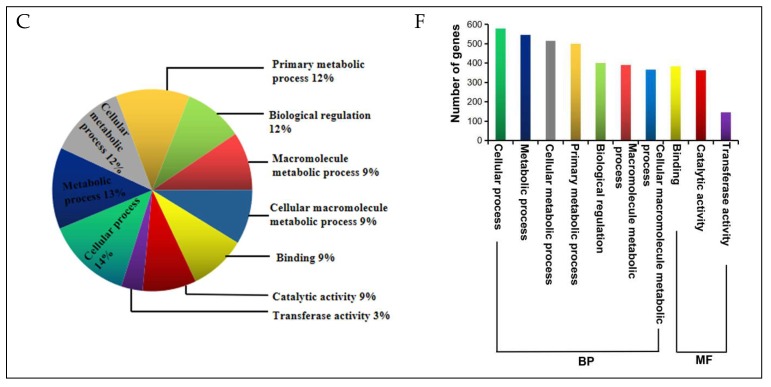
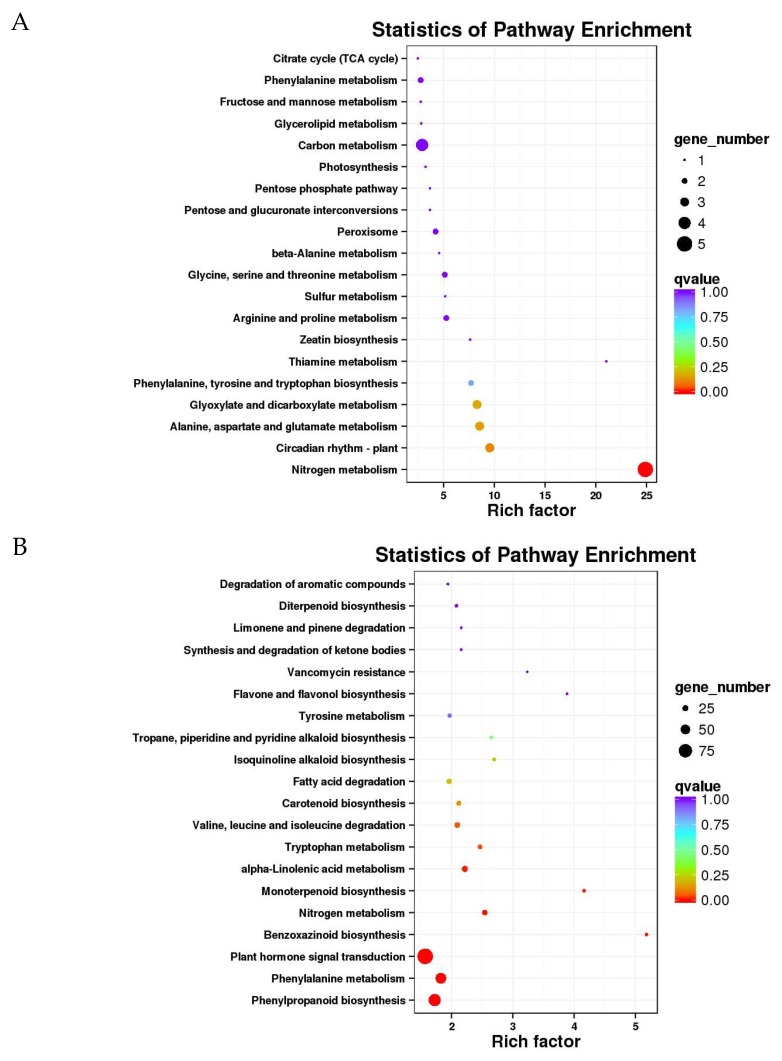
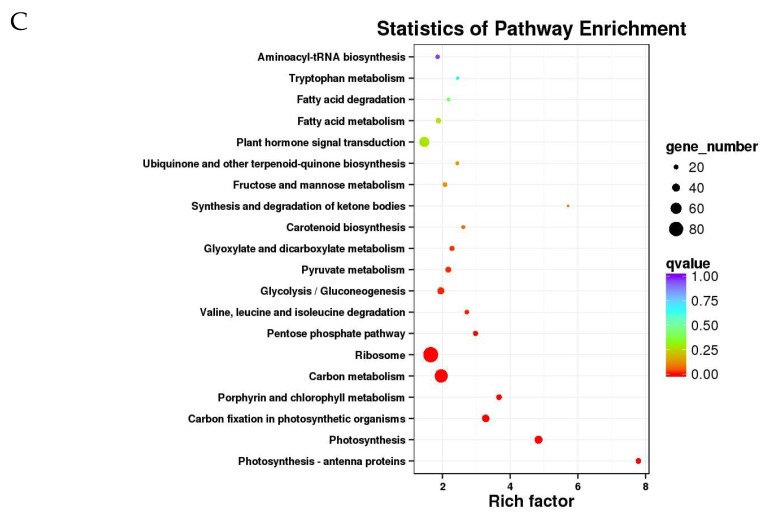
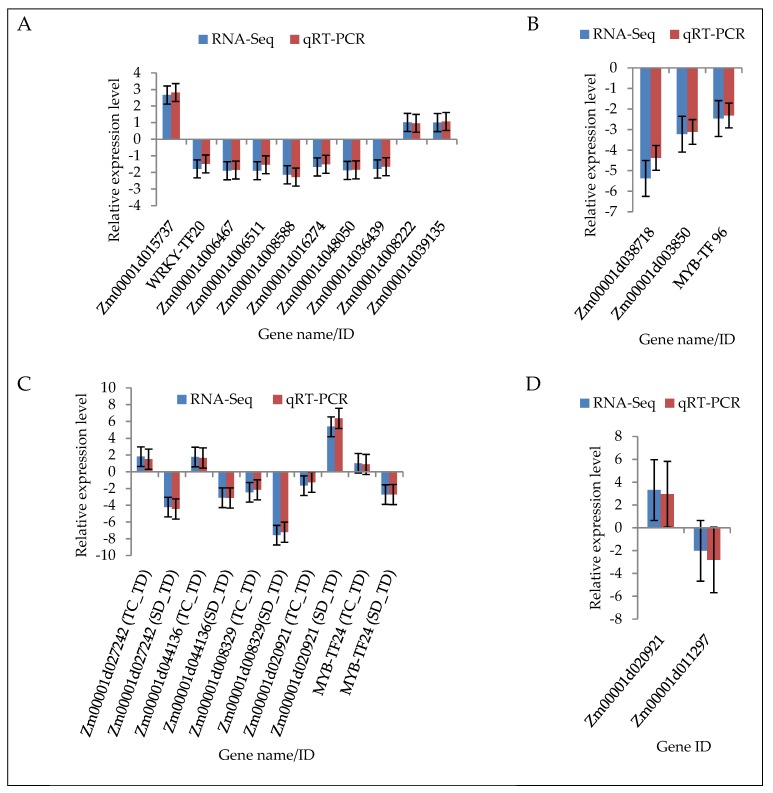
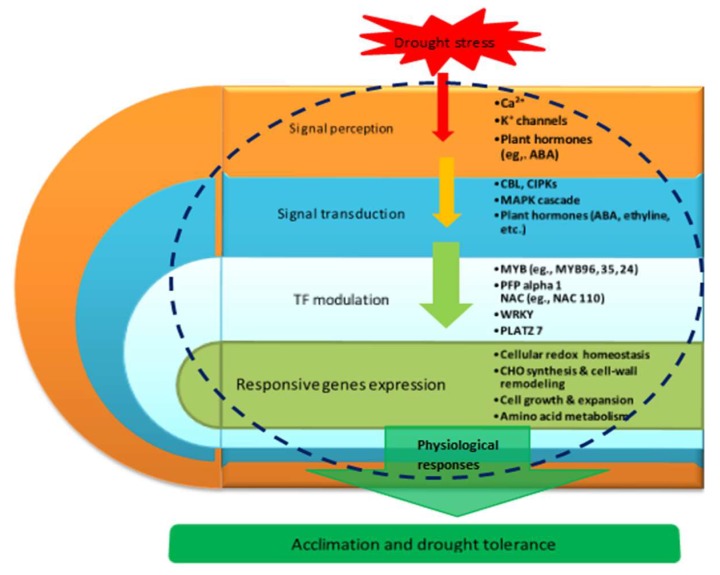
To unravel the molecular mechanisms underpinning maize (Zea mays L.) drought stress tolerance, we conducted comprehensive comparative transcriptome and physiological analyses of drought-tolerant YE8112 and drought-sensitive MO17 inbred line seedlings that had been exposed to drought treatment for seven days. Resultantly, YE8112 seedlings maintained comparatively higher leaf relative water and proline contents, greatly increased peroxidase activity, but decreased malondialdehyde content, than MO17 seedlings. Using an RNA sequencing (RNA-seq)-based approach, we identified a total of 10,612 differentially expressed genes (DEGs). From these, we mined out four critical sets of drought responsive DEGs, including 80 specific to YE8112, 5140 shared between the two lines after drought treatment (SD_TD), five DEGs of YE8112 also regulated in SD_TD, and four overlapping DEGs between the two lines. Drought-stressed YE8112 DEGs were primarily associated with nitrogen metabolism and amino-acid biosynthesis pathways, whereas MO17 DEGs were enriched in the ribosome pathway. Additionally, our physiological analyses results were consistent with the predicted RNA-seq-based findings. Furthermore, quantitative real-time polymerase chain reaction (qRT-PCR) analysis and the RNA-seq results of twenty representative DEGs were highly correlated (R² = 98.86%). Crucially, tolerant line YE8112 drought-responsive genes were predominantly implicated in stress signal transduction; cellular redox homeostasis maintenance; MYB, NAC, WRKY, and PLATZ transcriptional factor modulated; carbohydrate synthesis and cell-wall remodeling; amino acid biosynthesis; and protein ubiquitination processes. Our findings offer insights into the molecular networks mediating maize drought stress tolerance.

Keywords: RNA sequencing (RNA-seq); Zea mays L.; differentially expressed genes (DEGs); drought stress; qRT-PCR; transcriptome.


Conflict of interest statement

The authors declare that they have no conflicts of interest. Furthermore, the founding sponsors had no role in the design of the study; in the collection, analyses, or interpretation of data; in the writing of the manuscript, and in the decision to publish the results.

Figures

Figure 1
Figure 1
Profile of gene expression by inbred line and drought treatment. The gene expression profile is illustrated as the number of transcriptomic responses by using a Venn diagram. A total of 21,679 genes were expressed. Drought treatments are labeled Control (C) and Drought (D). The tolerant line (YE8112) and the sensitive line (MO17) are labeled “T” and “S”, respectively. The biological samples of four combinations are TC, TD, SC, and SD, respectively. The area labeled “A” represents the genes exclusively expressed in tolerant line YE8112 after drought treatment (TD). The area labeled “B” represents the genes specifically expressed in sensitive line MO17 after drought treatment (SD). The area labeled “C” represents the drought responsive genes shared by the tolerant and sensitive lines (i.e., TD and SD, but excluding SC and TC).
Figure 2
Figure 2
Venn diagram showing the profile of differentially expressed genes (DEGs). The differentiations were compared between inbred lines under each drought treatment, or between drought treatments in each inbred line. Drought treatments are labeled Control (C) and Drought (D). The tolerant line (YE8112) and the sensitive line (MO17) are labeled “T” and “S”, respectively. The four treatment-line biological samples are tolerant-control (TC), tolerant-drought (TD), sensitive-control (SC), and sensitive-drought (SD). Each compared combination is separated by an underscore (e.g., TC_TD). In the Venn diagram, the numbers of DEGs are shown across intersection areas among the compared combinations. In total we found 10,612 DEGs from all the areas. Four critical areas, labeled I, II, III, and IV, totally contain 5229 DEGs. Area I contains the tolerant treatment response DEGs, excluding others. Area II contains the line response under drought DEGs, excluding others. Area III contains both tolerance treatment response and line response under drought DEGs, excluding others. Area IV contains the treatment response DEGs within line.
Figure 3
Figure 3
Clustering analysis of differentially expressed genes (DEGs) and number of DEGs in YE8112 and MO17. (A) Clustering analysis of DEGs in the inbred lines after drought stress treatment (SD_TD). The x-axis represents different samples. T04, T05, and T06 refer to the three replicates of tolerant line YE8112 drought stressed (TD); T10 and T11 refer to the two replicates of the sensitive MO17 drought stressed (SD); and the y-axis represents the differential genes expressed. The scale bar indicates up-regulated (red) and down-regulated (green) DEGs. The darker the color, the higher the expression, while the lighter the color, the lower the expression; G=genes of the same expression pattern are clustered together; (B) volcano plot showing the (log2 FC, −log10 FDR) expression of the DEGs in the SD_TD experimental comparison; (C) number of DEGs in drought stressed YE8112 and MO17 seedlings. The overlapping section of the Venn diagram shows the DEPs common to YE8112 and MO17 seedlings under drought stress conditions.
Figure 4
Figure 4
Gene ontology (GO) enrichment analysis of the DEGs (from the critical areas labelled I, II, and V in Figure 2) in specific level 2 GO terms. The GO analysis results shown here are for the top 10 GO terms from the biological processes (BP) and molecular functions (MF) categories combined, for (A) GO enrichment of DEGs corresponding to tolerant treatment response (TC_TD); (B) GO enrichment of DEGs corresponding to line response under drought (SD_TD); and (C) GO enrichment of DEGs corresponding to sensitive treatment response (SC_SD); (DF) Number of DEGs enriched in each specific GO term in each experimental comparison (TC_TD, SD_TD, and SC_SD, respectively). Each area contained a background total of 80, 5140, and 602 DEGs, for TC_TD, SD_TD, and SC_SD, respectively.
Figure 4
Figure 4
Gene ontology (GO) enrichment analysis of the DEGs (from the critical areas labelled I, II, and V in Figure 2) in specific level 2 GO terms. The GO analysis results shown here are for the top 10 GO terms from the biological processes (BP) and molecular functions (MF) categories combined, for (A) GO enrichment of DEGs corresponding to tolerant treatment response (TC_TD); (B) GO enrichment of DEGs corresponding to line response under drought (SD_TD); and (C) GO enrichment of DEGs corresponding to sensitive treatment response (SC_SD); (DF) Number of DEGs enriched in each specific GO term in each experimental comparison (TC_TD, SD_TD, and SC_SD, respectively). Each area contained a background total of 80, 5140, and 602 DEGs, for TC_TD, SD_TD, and SC_SD, respectively.
Figure 5
Figure 5
KEGG pathway enrichment analysis of the differentially expressed genes (DEGs). The sub-figures show the most significantly enriched pathways in (A) TC_TD; (B) SD_TD; and (C) SC_SD experimental comparisons, based on the hypergeometric test. The significance of the enrichment of the KEGG pathway is based on the Student’s t-test, q < 0.01. The color gradient represents the size of the q value; the color is from red to blue, and the nearer the red represents the smaller the q value, and the higher the significant level of enrichment of the corresponding KEGG pathway. The “rich factor” shows the ratio of the number of the DEGs to the total gene number in certain pathways.
Figure 5
Figure 5
KEGG pathway enrichment analysis of the differentially expressed genes (DEGs). The sub-figures show the most significantly enriched pathways in (A) TC_TD; (B) SD_TD; and (C) SC_SD experimental comparisons, based on the hypergeometric test. The significance of the enrichment of the KEGG pathway is based on the Student’s t-test, q < 0.01. The color gradient represents the size of the q value; the color is from red to blue, and the nearer the red represents the smaller the q value, and the higher the significant level of enrichment of the corresponding KEGG pathway. The “rich factor” shows the ratio of the number of the DEGs to the total gene number in certain pathways.
Figure 6
Figure 6
qRT-PCR validation of the RNA-seq data of the 20 randomly selected maize seedling leaf differentially expressed genes (DEGs). (A) TC_TD specific DEGs; (B) SD_TD specific DEGs; (C) DEGs shared between TC_TD and SD_TD; and (D) DEGs specific to SC_SD. The y-axis represents the gene relative expression levels (fold changes) in the real-time PCR analysis and fold changes in the RNA-seq data. All the genes with negative values of expression level means that they were down-regulated in response to drought stress. Maize gene GAPDH (accession no. X07156) was used as the internal reference. Error bars represent the SE (n = 3).
Figure 7
Figure 7
Schematic molecular model of maize seedling drought stress tolerance. This model was developed based on our key putative components of drought response identified in this study, supported by previously described schemes of plant abiotic stress response pathways/networks [9,38,72]. The blue dotted enclosure signifies the molecular interactions occurring in the cellular environment. The down-ward pointing arrows show the connections between the components of the drought response network, from stress signal perception through signal transduction to transcriptional regulation of gene expression, until physiological and acclimation mechanisms are instituted in whole plants to effect drought tolerance. Key to abbreviations: Ca2+, calcium signals receptors; K+, potassium channels signal receptors; ABA, abscisic acid; CBL, calcineurin B-like; CIPKs, CBL-interacting protein kinases; MAPK, mitogen-activated protein kinases; TF, transcription factor; MYB, myeloblastosis oncogene; PFP alpha 1, pyrophosphate fructose-6-phosphate 1-phosphotransferase subunit alpha 1; NAC, (NAM, ATAF1/2, and CUC2) domain proteins; WRKY, family denoted by protein domain composed of a conserved WRKYGQK motif and a zinc-finger domain; PLATZ, plant AT-rich sequence and zinc binding protein 1; CHO, carbohydrates.

Similar articles

Cited by

References

    1. Ghatak A., Chaturvedi P., Weckwerth W. Cereal crop proteomics: Systemic analysis of crop drought stress responses towards marker-assisted selection breeding. Front. Plant Sci. 2017;8:757. doi: 10.3389/fpls.2017.00757. - DOI - PMC - PubMed
    1. Miao Z., Han Z., Zhang T., Chen S., Ma C. A systems approach to spatio-temporal understanding of the drought stress response in maize. Sci. Rep. 2017;7:6590. doi: 10.1038/s41598-017-06929-y. - DOI - PMC - PubMed
    1. Min H., Chen C., Wei S., Shang X., Sun M., Xia R., Liu X., Hao D., Chen H., Xie Q. Identification of drought tolerant mechanisms in maize seedlings based on transcriptome analysis of recombination inbred lines. Front. Plant Sci. 2016;7:1080. doi: 10.3389/fpls.2016.01080. - DOI - PMC - PubMed
    1. Wu S., Ning F., Zhang Q., Wu X., Wang W. Enhancing omics research of crop responses to drought under field conditions. Front. Plant Sci. 2017;8:174. doi: 10.3389/fpls.2017.00174. - DOI - PMC - PubMed
    1. Feller U., Vaseva I.I. Extreme climatic events: Impacts of drought and high temperature on physiological processes in agronomically important plants. Front. Environ. Sci. 2014;2:39. doi: 10.3389/fenvs.2014.00039. - DOI

MeSH terms

LinkOut - more resources