Comparison of postoperative visual performance between bifocal and trifocal intraocular Lens based on randomized controlled trails: a meta-analysis
- PMID: 30871503
- PMCID: PMC6419463
- DOI: 10.1186/s12886-019-1078-1
Comparison of postoperative visual performance between bifocal and trifocal intraocular Lens based on randomized controlled trails: a meta-analysis
Abstract
Background: To compare the clinical performance of bifocal and trifocal intraocular lenses (IOLs) in cataract surgery, a meta-analysis on randomized controlled trials was conducted.
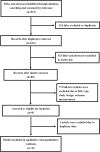
Methods: A comprehensive literature retrieval of PubMed, Science Direct and EMBASE was performed in this systematic review. Clinical outcomes included visual acuity (VA), contrast sensitivity (CS), spectacle independence, postoperative refraction and surgical satisfaction.
Results: There were 8 RCTs included in this study. The difference of uncorrected near VA (UNVA) between the bifocal IOLs and trifocal IOLs had no significance [MD = 0.02, 95%CI: (- 0.03,0.06)]. There was no significant difference in the distant-corrected near VA (DCNVA) with MD of 0.04 [95%CI (- 0.02, 0.10)]. Compared with trifocal group, the uncorrected intermediate visual acuity (UIVA) [MD = 0.09,95%CI:(0.01,0.17)] was significantly worse in the bifocal group. No difference was found in distance-corrected intermediate VA (DCIVA) [MD = 0.09, 95%CI: (- 0.04, 0.23)] between two groups. Analysis on AT LISA subgroup indicated the bifocal group had worse intermediate VA than trifocal group (AT LISA tri 839 M) [MD = 0.18, 95%CI: (0.12, 0.24) for UIVA and MD = 0.19, 95%CI: (0.13, 0.25) for DCIVA]. However, there was no statistically significant difference between the two groups in the uncorrected distance VA (UDVA) and corrected distance visual acuity (CDVA) [MD = 0.01, 95%CI: (- 0.01,0.04) for UDVA; MD = 0.00, 95%CI: (- 0.01,0.01) for CDVA]. The postoperative refraction of bifocal group was similar to that of trifocal group [MD = -0.08, 95% CI: (- 0.19, 0.03) for spherical equivalent; MD = -0.09, 95%CI: (- 0.21, 0.03) for cylinder; MD = -0.09, 95% CI: (- 0.27, 0.08) for sphere]. No difference was found for spectacle independence, posterior capsular opacification (PCO) incidence and patient satisfaction between bifocal IOLs and trifocal IOLs. [RR = 0.89, 95% CI: (0.71, 1.12) for spectacle independence; RR = 1.81, 95% CI: (0.50, 6.54) for PCO incidence; RR = 0.98, 5% CI: (0.86, 1.12) for patient satisfaction].
Conclusion: Patients receiving trifocal IOLs, especially AT LISA tri 839 M, have a better intermediate VA than those receiving bifocal IOLs. Near and distance visual performance, spectacle independence, postoperative refraction and surgical satisfaction of bifocal IOLs were similar to those of trifocal IOLs.
Keywords: Bifocal; Cataract surgery; IOLs; Intraocular lenses; Meta-analysis; Randomized; Trifocal.
Conflict of interest statement
Ethics approval and consent to participate
Not applicable
Consent for publication
Not applicable
Competing interests
No authors have a financial and proprietary interest in any material and method mentioned. The authors declare that they have no competing interests.
Publisher’s Note
Springer Nature remains neutral with regard to jurisdictional claims in published maps and institutional affiliations.
Figures


References
-
- Blindness: vision 2020 - the global initiative for the elimination of avoidable blindness. https://www.who.int/mediacentre/factsheets/fs213/en/. Accessed 2 May 2018.
-
- Cheng JW, Cheng SW, Cai JP, Li Y, Wei RL. The prevalence of visual impairment in older adults in mainland China: a systematic review and meta-analysis. Ophthalmic Res. 2013;49(1):1–10. - PubMed
-
- YB L, DS F, TY W, SY Z, LP S, JJ W, XR D, XH Y, FH W, Q Z, et al. Prevalence and causes of low vision and blindness in a rural chinese adult population: the Handan eye study. Ophthalmology. 2008;115(11):1965–1972. - PubMed
-
- Tan X, Lin H, Li YT, Huang L, Zhu Y, Ni Y, Huang WY, Liu Y. Cataract screening in a rural area of southern China: a retrospective cohort study. Lancet. 2016;2016:S53.
-
- Kohnen T. How far we have come: from Ridley's first intraocular lens to modern IOL technology. J Cataract Refract Surg. 2009;35(12):2039. - PubMed
Publication types
MeSH terms
LinkOut - more resources
Full Text Sources

