. 2019 May 8;102(3):683-693.e4.
doi: 10.1016/j.neuron.2019.02.014. Epub 2019 Mar 11.

Hippocampal Contributions to Model-Based Planning and Spatial Memory

Affiliations

Hippocampal Contributions to Model-Based Planning and Spatial Memory

Oliver M Vikbladh et al. Neuron. .

Abstract

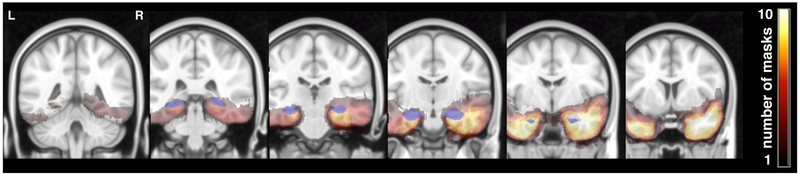
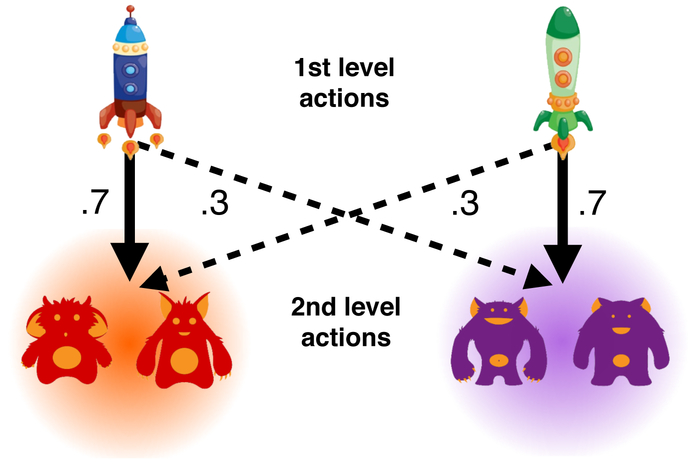
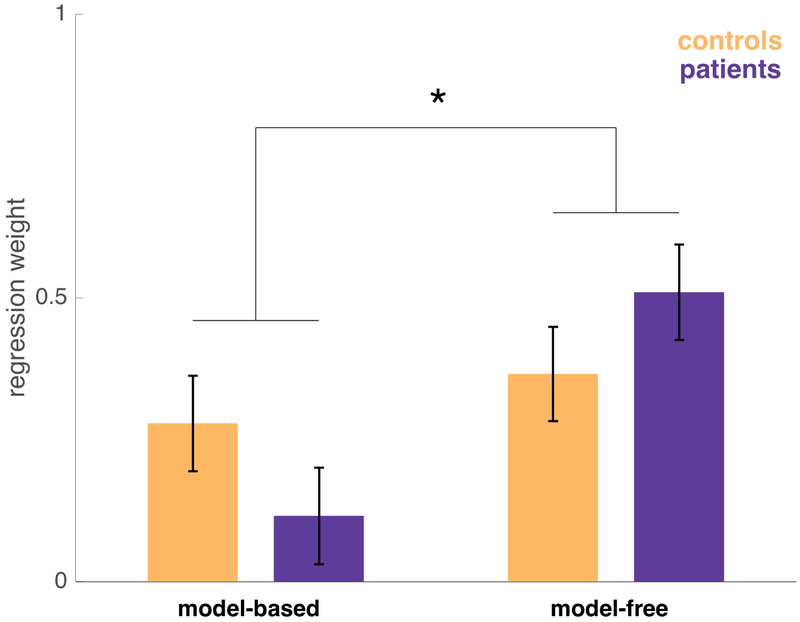
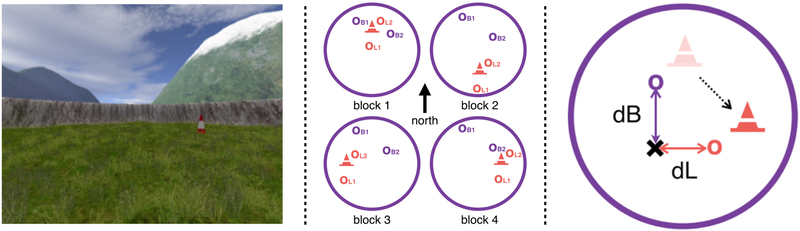
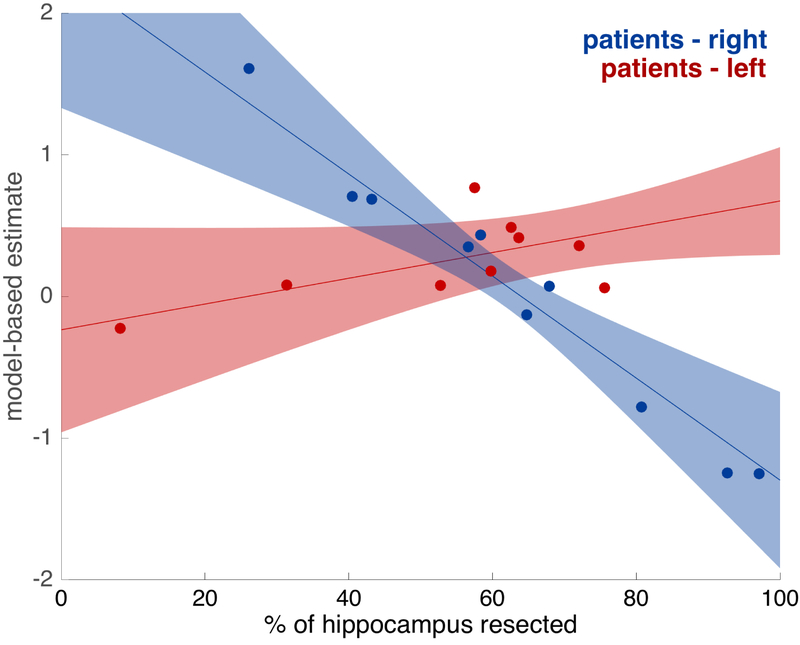
Little is known about the neural mechanisms that allow humans and animals to plan actions using knowledge of task contingencies. Emerging theories hypothesize that it involves the same hippocampal mechanisms that support self-localization and memory for locations. Yet limited direct evidence supports the link between planning and the hippocampal place map. We addressed this by investigating model-based planning and place memory in healthy controls and epilepsy patients treated using unilateral anterior temporal lobectomy with hippocampal resection. Both functions were impaired in the patient group. Specifically, the planning impairment was related to right hippocampal lesion size, controlling for overall lesion size. Furthermore, although planning and boundary-driven place memory covaried in the control group, this relationship was attenuated in patients, consistent with both functions relying on the same structure in the healthy brain. These findings clarify both the neural mechanism of model-based planning and the scope of hippocampal contributions to behavior.

Keywords: anterior temporal lobe; decision-making; hippocampus; human; lesion; memory; model-based; planning; reinforcement learning; spatial.


Conflict of interest statement

Declaration of Interests

No conflicts of interest to declare.

Figures

Figure 1:
Figure 1:. Patient lesion masks.
Slices (y=82, 92, 102, 112, 122, 132) showing all 19 hand-drawn patient ATL lesion masks normalized to the MNI template. Heat maps indicate the number of masks overlapping at a given voxel. The hippocampus, as defined by Harvard-Oxford Lexicon (p>.5), is shown in blue.
Figure 2:
Figure 2:. Two-step Markov Decision-Task.
On each trial the participants chose one of two first level actions (spaceships). One space ship transitions the participant to red planet with p=.7 while the other space ship transitions the participant to red planet with p=.3. Having transitioned to a second level state, participants chose between two second level actions (aliens) that were unique to each planet. Each alien was associated with a unique, slowly drifting, probability of receiving reward.
Figure 3:
Figure 3:. Model-free and model-based regression weights for controls and patients.
Estimated with a logistic mixed-effects regression controlling for IQ and age. Error bars indicate standard error. The interaction of strategy (model-free vs. model-based) by group was significant (z=2.028, p=0.043).
Figure 4
Figure 4. Left: Virtual arena as seen from first-person perspective.
Landmark (cone), arena boundary (wall) and distal cues (mountains) are visible. Middle: Spatial Task Block Structure, with virtual arena as seen as from above. Between blocks the landmark (cone) moved in relation to the boundaries (large purple circle). Correct location of the two boundary objects (OB1 and OB2) stayed constant with respect to boundaries across all blocks. Correct location of the two landmark objects (OL1 and OL2) stayed constant with respect to the landmark across all blocks. Right: Measuring reliance on boundary and landmark cues. The landmark (cone) moves (dotted line) in relation to boundaries (large purple circle) between blocks. In a trial preceding a landmark move, an example object’s correct location (purple o), i.e. where the object appears during feedback, is in close proximity to the landmark (shaded cone). If participants remember this object location in relation to boundaries and distal cues, the predicted object location in the next block would also be indicated by the purple o. Conversely, if participants learned the object location in relation to the landmark, the predicted object location after the landmark moves to its new location (filled coned) would be the orange o. On the trials following movement of the landmark we thus operationalize place memory by the boundary distance error (dB) between their response (cross) and the location predicted by boundaries and distal cues (purple o). Response memory is operationalized by the landmark distance error (dL) between their response (cross) and the location predicted by the landmark cue (orange o). Lower dB and dL thus means greater reliance on boundary and landmark cues, respectively.
Figure 5:
Figure 5:. Boundary (dB) and response (dL) distance error (arbitrary units) for all objects on trials that follow movements of the landmark.
Estimated with a linear mixed-effects regression, controlling for IQ and age. Error bars indicate standard error. There was a significant group difference in boundary distance error (F1,39.41=2.510,p=0.016), but not landmark distance error (F1,85.3=0, p=0.9990) with a significant interaction of group by cue type (F1,97.58=5.508, p=0.021).
Figure 6:
Figure 6:. Relationship between model-based planning and boundary distance error (arbitrary unit) in controls and patients.
Estimated with a logistic mixed-effects regression, controlling for IQ. Error bars indicate 80% confidence intervals. Individual place memory performance is reflected by mean boundary distance error (dB) from the spatial task. Dots indicate estimates for individual participants, calculated from the mixed-effects logistic regression. The trend was significant in the control group (z=6.6455, p= 0.001), but not in the left patient group (z=0.156, p=0.875). The slope differed significantly between groups (z=2.137, p=0.032).
Figure 7
Figure 7. Top: Model-free and model-based regression weights controls, right and left lateralized ATL patients.
Estimated with a logistic mixed-effects regression, controlling for IQ and age. Error bars indicate standard error. The difference in model-free vs. model-based was significantly different between the control and right patient group (z=2.295 p=0.022). Middle: Boundary (dB) and response (dL) distance error (arbitrary units) for controls and patients with right and left lateralized ATL. Estimated with a linear mixed-effects regression, controlling for IQ and age. Error bars indicate standard error. There was a significant difference between dB and dL when comparing the control and right patient group (F1,92.22=4.463 p=0.034). Bottom: Relationship between model-based planning and boundary distance error (arbitrary unit) for controls and patients with right and left lateralized ATL. Estimated with a logistic mixed-effects regression, controlling for IQ. Error bars indicate 80% confidence intervals. Individual place memory performance is reflected by mean boundary distance error (dB) from the spatial task. Dots indicate estimates for individual participants, calculated from the mixed-effects logistic regression. The association differed significantly between the control and right patient group (z=2.5497, p=0.011).
Figure 8:
Figure 8:. Relationships between model-based planning and hippocampal lesion size., for patients with right and left lateralized ATL.
Estimated with mixed-effects regressions, controlling for IQ, age, and total size of lesion. Error bars indicate 80% confidence intervals. Dots indicate estimates for individual participants, calculated from the mixed-effects logistic regression. There was a significant relationship in the right patient group (z=2.831, p=0.005) but not in the left patient group (z=1.062, p=0.2882), with a significant difference between the right and left patient groups (z=2.508, p=0.0122).

Comment in

References

    1. Adams CD (1982). Variations in the sensitivity of instrumental responding to reinforcer devaluation. The Quarterly Journal of Experimental Psychology, 34(2), 77–98.
    1. Adams CD, and Dickinson A (1981). Instrumental responding following reinforcer devaluation. The Quarterly Journal of Experimental Psychology, 33(2), 109–121.
    1. Addis DR, Cheng T, P Roberts R, & Schacter DL (2011). Hippocampal contributions to the episodic simulation of specific and general future events. Hippocampus, 21(10), 1045–1052. - PMC - PubMed
    1. Akam T, Costa R, and Dayan P (2015). Simple plans or sophisticated habits? State, transition and learning interactions in the two-step task. PLoS Computational Biology, 11(12), e1004648. - PMC - PubMed
    1. Balleine BW, and Dickinson A (1998). Goal-directed instrumental action: contingency and incentive learning and their cortical substrates. Neuropharmacology, 37(4), 407–419. - PubMed

Publication types

LinkOut - more resources