

Global, regional, and national burden of stroke, 1990-2016: a systematic analysis for the Global Burden of Disease Study 2016
- PMID: 30871944
- PMCID: PMC6494974
- DOI: 10.1016/S1474-4422(19)30034-1
Global, regional, and national burden of stroke, 1990-2016: a systematic analysis for the Global Burden of Disease Study 2016
Abstract
Background: Stroke is a leading cause of mortality and disability worldwide and the economic costs of treatment and post-stroke care are substantial. The Global Burden of Diseases, Injuries, and Risk Factors Study (GBD) provides a systematic, comparable method of quantifying health loss by disease, age, sex, year, and location to provide information to health systems and policy makers on more than 300 causes of disease and injury, including stroke. The results presented here are the estimates of burden due to overall stroke and ischaemic and haemorrhagic stroke from GBD 2016.
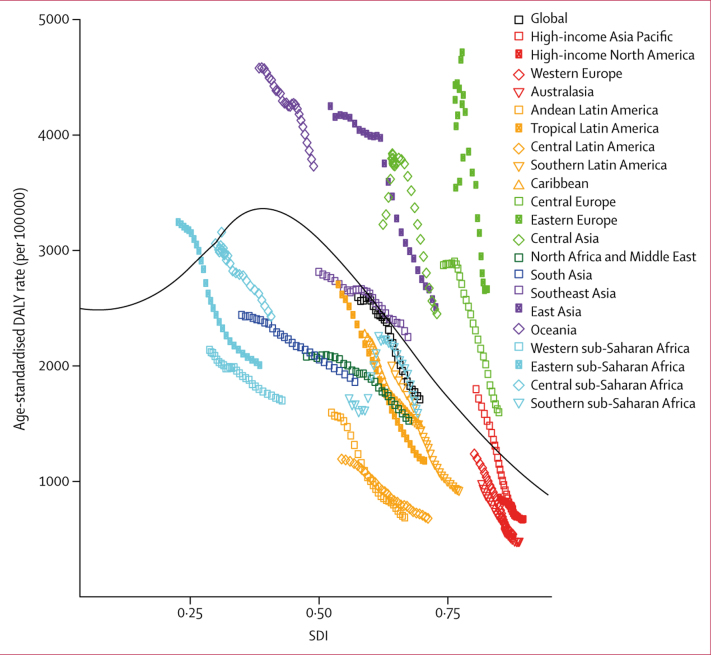
Methods: We report estimates and corresponding uncertainty intervals (UIs), from 1990 to 2016, for incidence, prevalence, deaths, years of life lost (YLLs), years lived with disability (YLDs), and disability-adjusted life-years (DALYs). DALYs were generated by summing YLLs and YLDs. Cause-specific mortality was estimated using an ensemble modelling process with vital registration and verbal autopsy data as inputs. Non-fatal estimates were generated using Bayesian meta-regression incorporating data from registries, scientific literature, administrative records, and surveys. The Socio-demographic Index (SDI), a summary indicator generated using educational attainment, lagged distributed income, and total fertility rate, was used to group countries into quintiles.
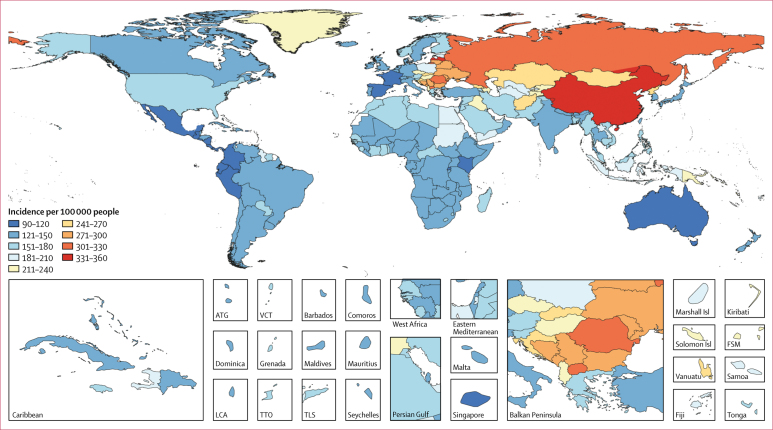
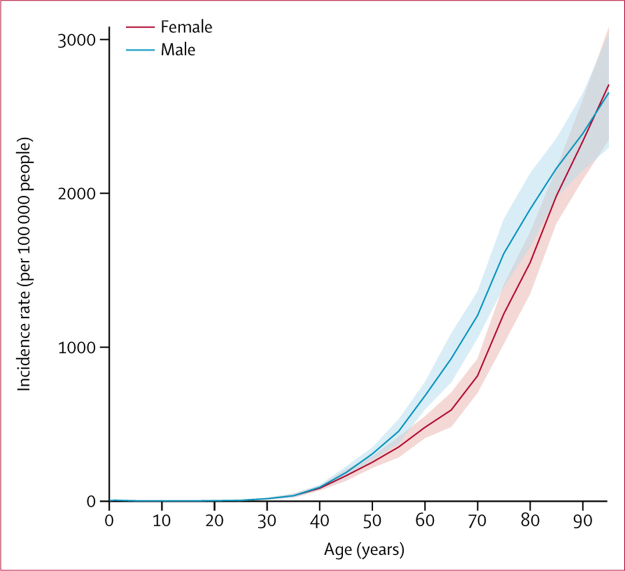
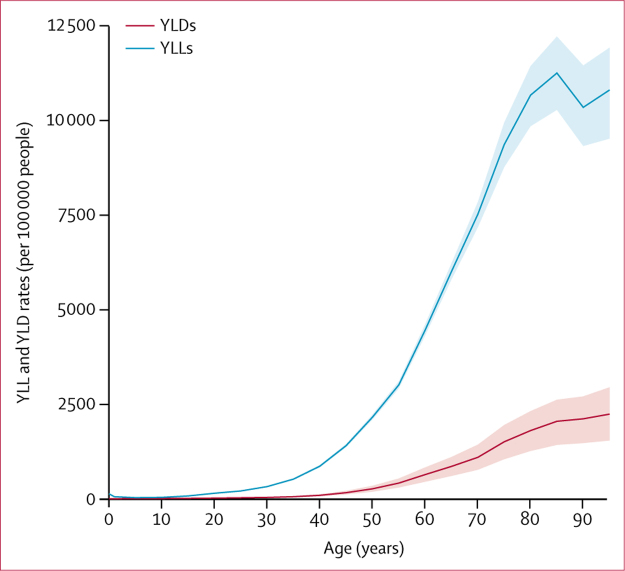
Findings: In 2016, there were 5·5 million (95% UI 5·3 to 5·7) deaths and 116·4 million (111·4 to 121·4) DALYs due to stroke. The global age-standardised mortality rate decreased by 36·2% (-39·3 to -33·6) from 1990 to 2016, with decreases in all SDI quintiles. Over the same period, the global age-standardised DALY rate declined by 34·2% (-37·2 to -31·5), also with decreases in all SDI quintiles. There were 13·7 million (12·7 to 14·7) new stroke cases in 2016. Global age-standardised incidence declined by 8·1% (-10·7 to -5·5) from 1990 to 2016 and decreased in all SDI quintiles except the middle SDI group. There were 80·1 million (74·1 to 86·3) prevalent cases of stroke globally in 2016; 41·1 million (38·0 to 44·3) in women and 39·0 million (36·1 to 42·1) in men.
Interpretation: Although age-standardised mortality rates have decreased sharply from 1990 to 2016, the decrease in age-standardised incidence has been less steep, indicating that the burden of stroke is likely to remain high. Planned updates to future GBD iterations include generating separate estimates for subarachnoid haemorrhage and intracerebral haemorrhage, generating estimates of transient ischaemic attack, and including atrial fibrillation as a risk factor.
Funding: Bill & Melinda Gates Foundation.
Copyright © 2019 The Author(s). Published by Elsevier Ltd. This is an Open Access article under the CC BY 4.0 license. Published by Elsevier Ltd.. All rights reserved.
Figures
Comment in
-
The global burden of stroke: persistent and disabling.Lancet Neurol. 2019 May;18(5):417-418. doi: 10.1016/S1474-4422(19)30030-4. Epub 2019 Mar 11. Lancet Neurol. 2019. PMID: 30871943 No abstract available.
-
Research priorities to improve stroke outcomes.Lancet Neurol. 2022 Apr;21(4):312-313. doi: 10.1016/S1474-4422(22)00044-8. Lancet Neurol. 2022. PMID: 35305334 Free PMC article. No abstract available.
References
-
- Yan LL, Li C, Chen J. Stroke. In: Prabhakaran D, Anand S, Gaziano TA, editors. Cardiovascular, respiratory, and related disorders. 3rd edn. The International Bank for Reconstruction and Development/The World Bank; Washington, DC: 2017. http://www.ncbi.nlm.nih.gov/books/NBK525145/ - PubMed
-
- Thrift AG, Thayabaranathan T, Howard G. Global stroke statistics. Int J Stroke. 2017;12:13–32. - PubMed
Publication types
MeSH terms
Grants and funding
- MR/R024227/1/MRC_/Medical Research Council/United Kingdom
- MC_UU_12026/3/MRC_/Medical Research Council/United Kingdom
- MC_U137686857/MRC_/Medical Research Council/United Kingdom
- MR/S011676/1/MRC_/Medical Research Council/United Kingdom
- IA/CPHI/14/1/501514/WTDBT_/DBT-Wellcome Trust India Alliance/India
LinkOut - more resources
Full Text Sources
Other Literature Sources
Medical
